

Premium

March 24, 2020
Raw Materials Prices: Iron Ore, Coking Coal, Pig Iron, Scrap, Zinc
Written by Peter Wright
Raw materials prices are poised for a rapid decline as the dollar strengthens and the global economy slumps.
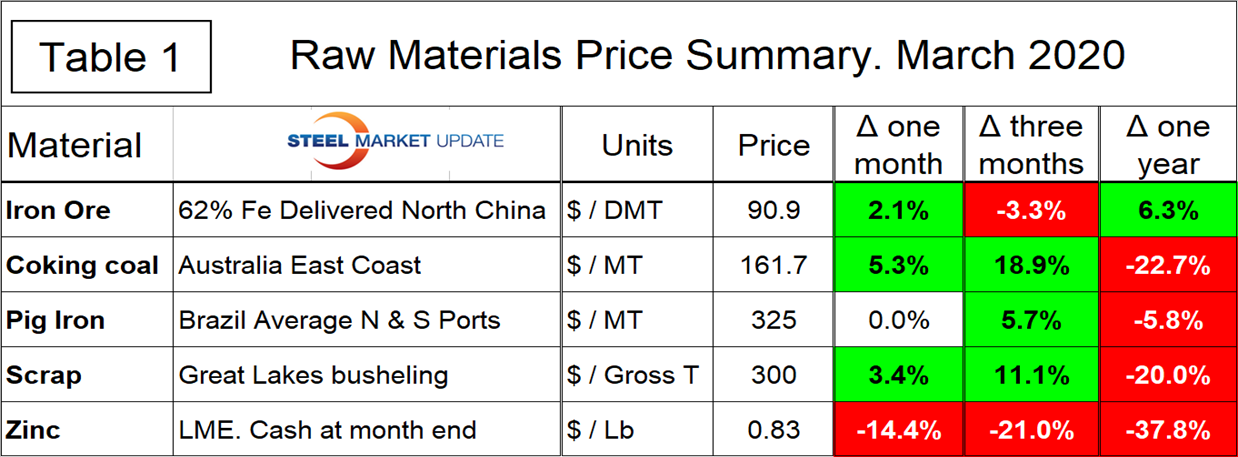
Table 1 summarizes the price changes through March 18 of the five materials considered in this analysis. It reports the month/month, 3 months/3 months and 12 months/12 months changes on a percentage basis. This is likely our last summary before an impending crash. The currencies of Brazil and Australia are in freefall, which will put downward pressure on iron unit prices. On the demand side, the big three auto companies in the U.S have announced that they will be suspending operations on March 20 and the price of West Texas Intermediate crude has breached $20 per barrel. We looked back at 2008 and 2009 to see how the recovery progressed from the Great Recession. It took about 18 months for prices to recover from that bottom, but the situation was too different to draw any conclusions. The first half of 2008 was a global commodity boom; this was not the case in 2019 and early 2020.
In the last 30 days, the prices of iron ore, coking coal and scrap increased, pig iron from Brazil was unchanged and the price of zinc declined. This was a deterioration from our January update when all five materials had a positive price movement in one month and three months for the first time since we began this analysis in October 2018.
On March 8, Mining.com reported: “Fitch Solutions sees increasing downside risk to mineral production as the Covid-19 pandemic raises the chances of persistent operational disruptions. In their latest report, Fitch analysts point out that although mining operations tend to be in more remote locations, there is an increasing scope for reduced personnel flow and supply chain disruptions due to government actions leading to a reduction or halt in mine production. Fitch notes that while relatively few firms have announced operational disruptions as of yet, the firm expects this will rise as countries implement quarantine efforts to contain the virus.”
Iron Ore
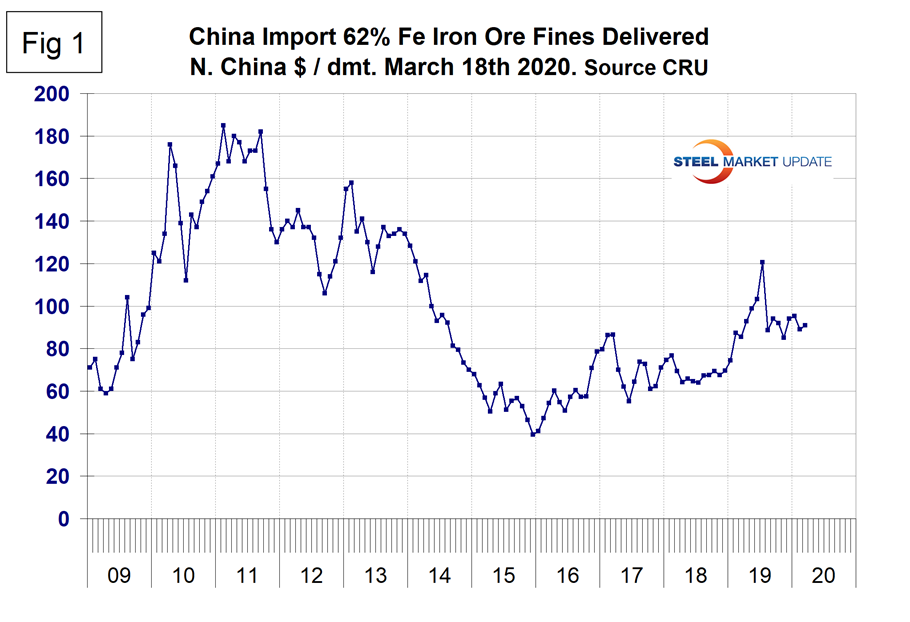
The Chinese import price of 62% Fe content ore fines rose by 90 cents to $90.90/dmt in March. Figure 1 shows the price of 62% Fe delivered North China since January 2009. The price since January 2019 has stayed above the range that pertained for the previous year and a half.
Coking Coal
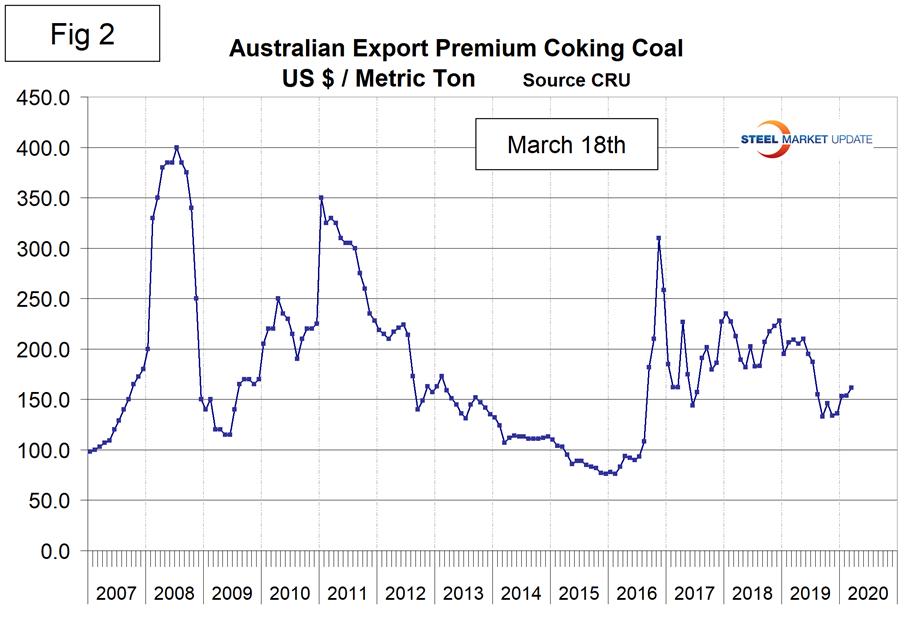
The price of premium low volatile coking coal FOB east coast of Australia increased by $8.20 to $161.70/metric ton in March, its highest level since last July (Figure 2).
Pig Iron
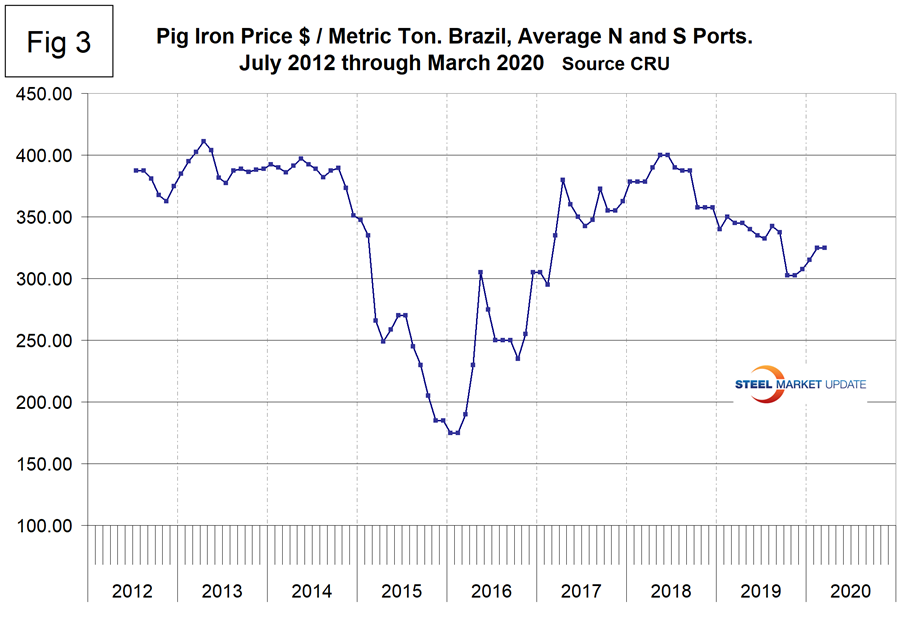
Most of the pig iron imported to the U.S. currently comes from Russia, Ukraine and Brazil with additional material from South Africa and Latvia. In this report we summarize prices out of Brazil and average the FOB value from the north and south ports. The price had a recent peak of $400 per metric ton in May and June 2018 before declining erratically through November 2019. There was a $22.50 recovery in December through February and no change in March. The average price in March was $325/metric ton, 5.8 percent lower than in March last year.
Scrap
To put this raw materials commentary into perspective, we include here Figure 4, which shows the spread between busheling in the Great Lakes region and hot rolled coil Mid West U.S. through mid-March 2019, both in dollars per net ton. The spread has fallen from a high of $563.79 in August 2018 to $314.14 in March 2020. The spread is still at the top end of the range that has been relatively normal for the last 13 years.
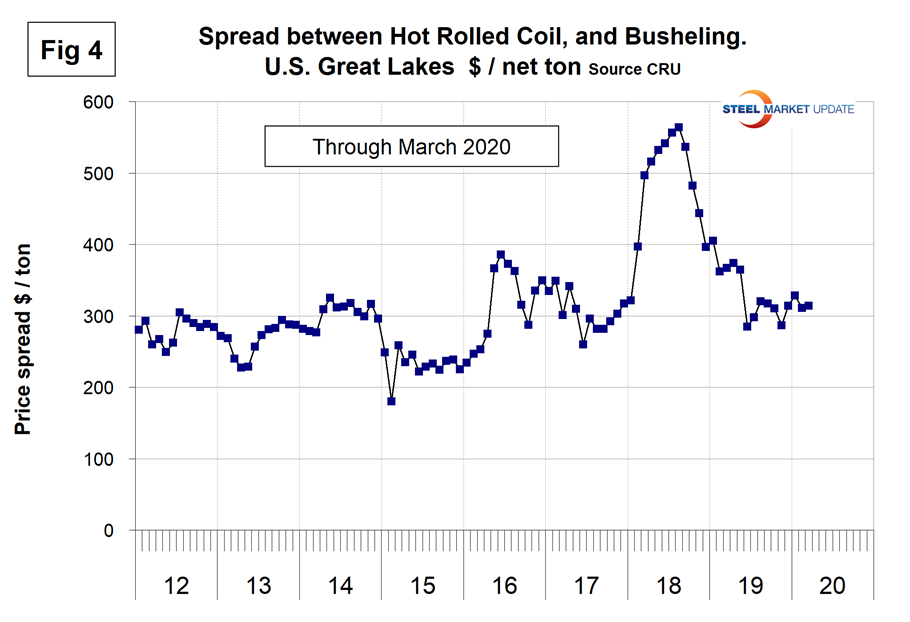
Figure 5 shows the relationship between shredded and busheling, both priced in dollars per gross ton in the Great Lakes region, and Figure 6 shows the actual prices. This spread was $30 in March, up from $5 in December and January.
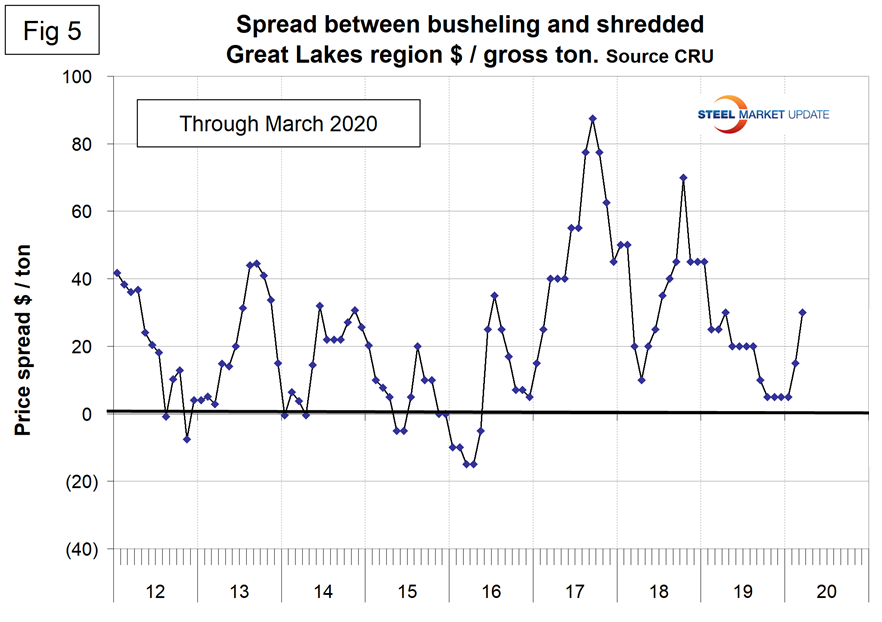
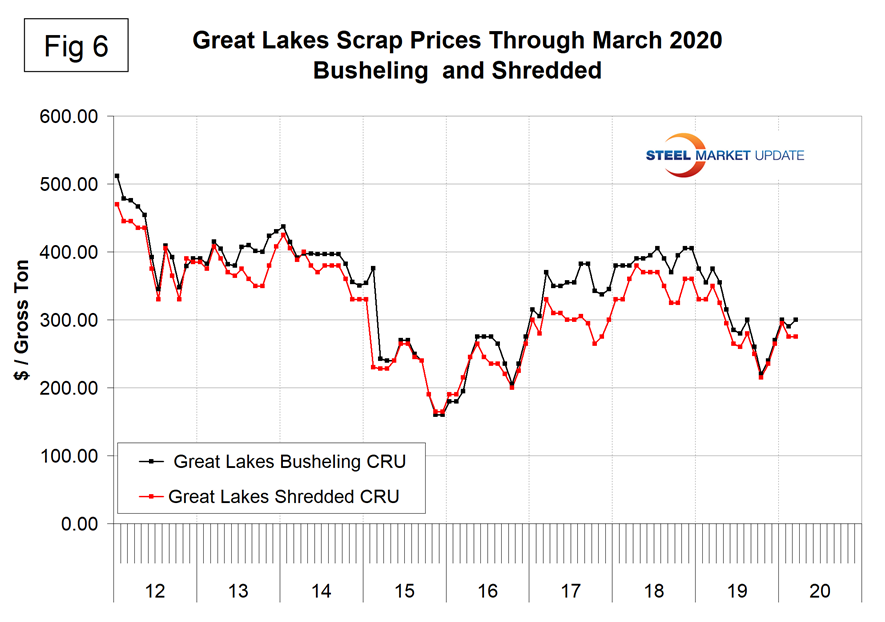
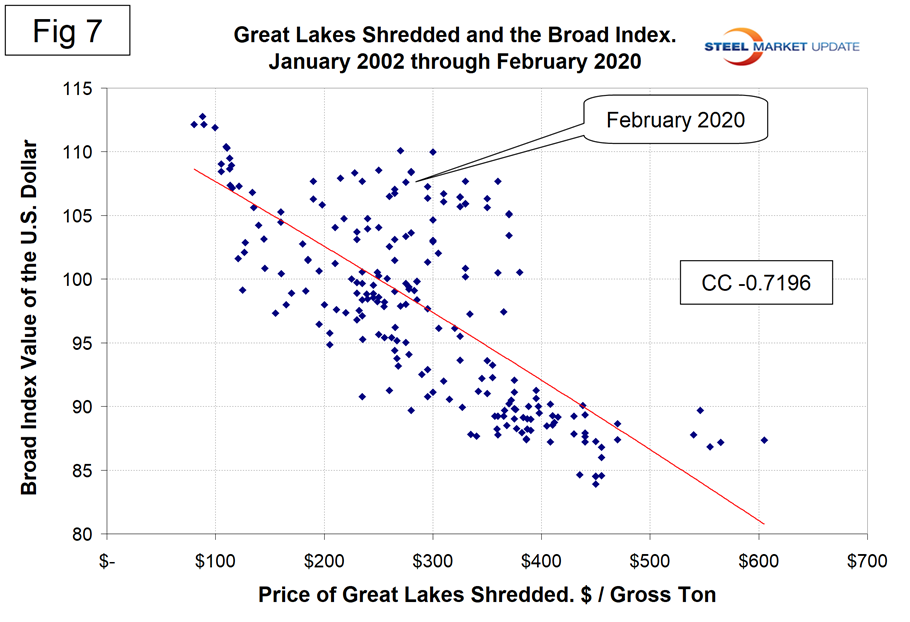
Figure 7 is a scattergram of the price of Chicago shredded and the monthly Broad Index value of the U.S. dollar as reported by the Federal Reserve. The latest data for the monthly Broad Index was February. There is a causal component to this relationship that overlays the supply demand dynamics with a negative correlation of 72 percent.
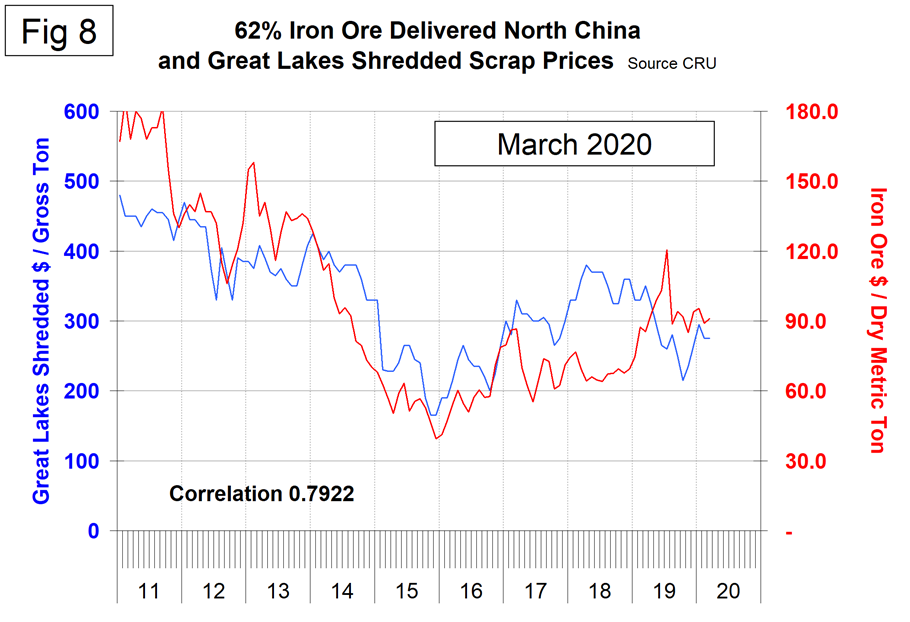
There is a long-term relationship between the prices of iron ore and scrap. Figure 8 shows the prices of 62% iron ore fines delivered North China and the price of shredded scrap in the Great Lakes region through mid-March 2020. The correlation since March 2006 has been over 79 percent. There was a very unusual divergence in these prices in 2018 that benefited the integrated producers, but that situation has now corrected leaving the EAF producers with a small advantage on a historical basis.
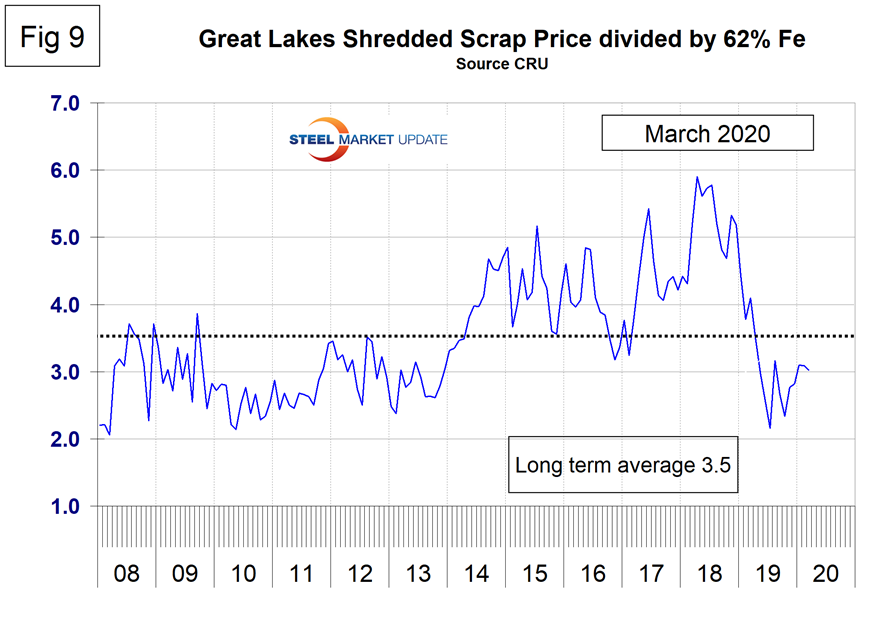
In the last 11 years, scrap in dollars per gross ton has been on average 3.4 times as expensive as iron ore in dollars per dry metric ton. A high ratio benefits the domestic integrated producers and a low ratio benefits the EAF producers. The ratio has been erratic since mid-2014, but at 3.0 in March is advantageous to the EAF producers (Figure 9).
Zinc
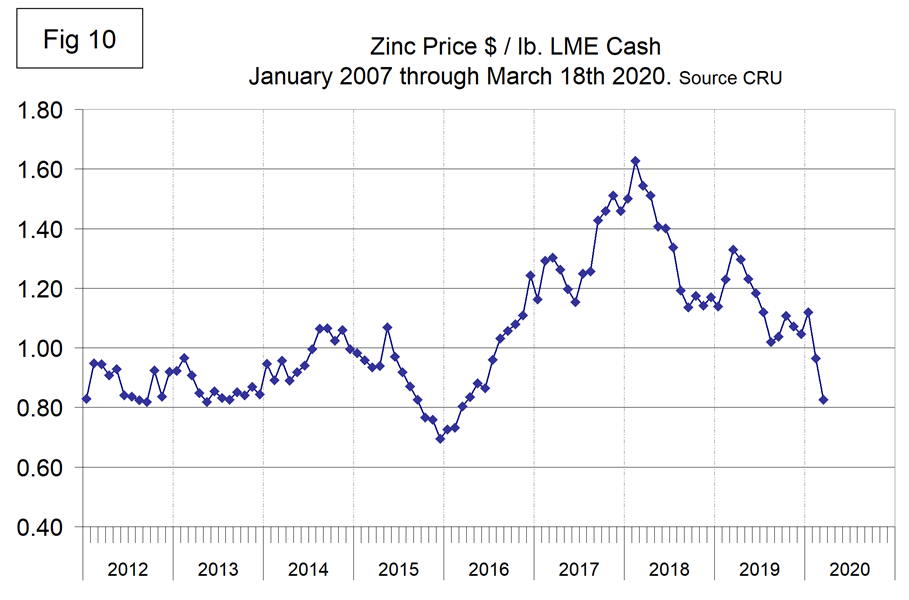
The LME cash price for zinc mid-month is shown in Figure 10. The latest data is for March 19 when the price was 83 U.S. cents per pound. The price declined from $1.12 in January, which was a return to the trend that began in March 2018.
CRU is factoring a demand shock in Q2 to their 2020 forecast followed by a slower contraction in Q3 and a rebound in Q4. On the supply side the impact is expected to be less severe, but news of a two-week closure of two Peruvian mines was released last week.
Zinc is the fourth most widely used metal in the world after iron, aluminum and copper. Its primary uses are 60 percent for galvanizing steel, 15 percent for zinc-based die castings and about 14 percent in the production of brass and bronze alloys.

