

Market Data

April 5, 2020
SMU Market Trends: Buyers Say Production Cuts Not Enough to Save Prices
Written by Tim Triplett
Steel buyers surveyed by Steel Market Update this week report that demand is plunging and they expect steel prices to continue declining right along with it for at least the next 30 days. The majority believe that efforts by the mills to cut production and match supply with demand will not be enough to establish a floor on steel prices.
SMU data shows that the benchmark price of hot rolled steel has already declined to an average of $540 per ton, down from $580 at the beginning of March.
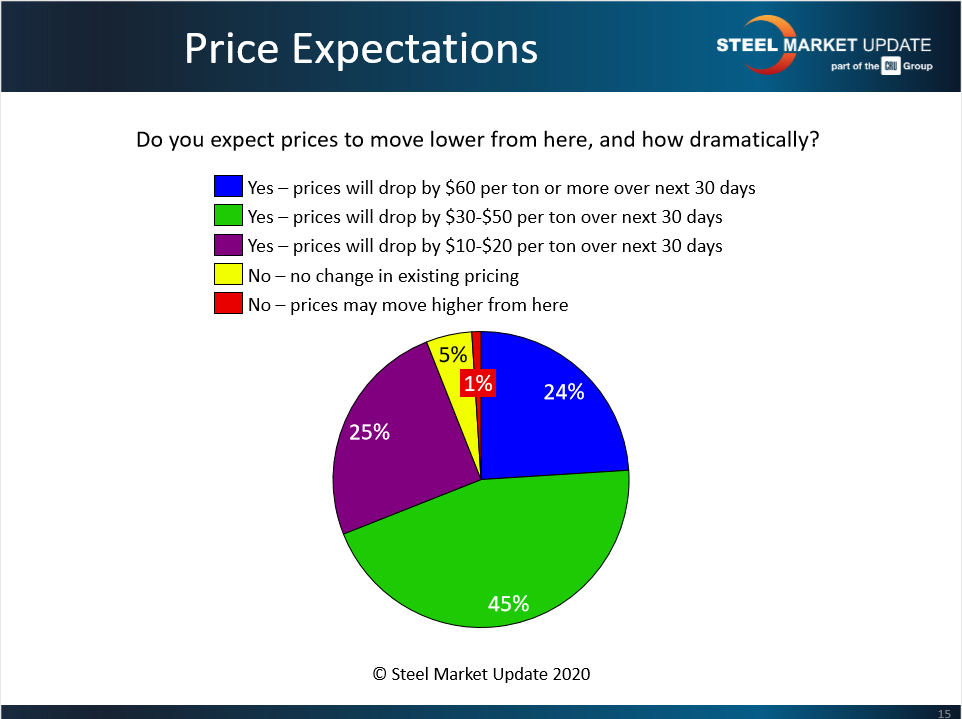
All but 6 percent of those responding to SMU’s questionnaire this week anticipate further price erosion, it’s just a question of how much. Twenty-four percent expect a decline of $60 per ton or more; 45 percent a decline of $30-50; and 25 percent a dip of $10-20.
Comments from respondents show widespread pessimism on prices:
“If the over/under is $500, I’ll take the under.”
“It will be down $100 per ton by the Fourth of July.”
“Considering the steel demand removed from the market for energy products and automotive alone, this could get real ugly in a hurry. I think scrap will be a good indicator of how much prices will move, and it looks like that might be another bloodbath.”
Will the Steel Production Cuts Help?
Several mills have announced furnace idlings and production cuts in the past two weeks in response to the waning steel demand. CRU estimates the cuts will take a total of around 8 million metric tons of production out of the market—but not enough to offset 16 million tons of lost demand. SMU asked buyers: Are the moves by the mills to take raw steel production out of the market going to be enough to keep a floor on pricing? The vast majority, nearly 70 percent, said no.
Following are some of their comments:
“It’s a good sign that mills are scaling back raw steel production. If this continues, we could see a supply/demand balance that would help stabilize pricing.”
“This will help keep the floor higher than it would have been otherwise. I still think galvanized base prices will fall to the $33-34 range.”
“The planned outages plus the new ones added could be around 10 percent of normal demand. So, the question turns more to how much demand will fall. If auto and energy continue to be down, then a 10 percent reduction will not be enough to cause a floor, but it should at least slow the velocity of the fall.”
“We could soon be in an environment where the EAFs will have to operate at reduced rates, possibly as low as 60-70 percent.”
“I would still expect prices to decrease over the next 30-60 days. Beyond that, it depends on what happens with demand.”
“Prices will go down, but won’t crash.”
“We need to have the electric furnace producers and re-rollers also reduce capacity, otherwise they will shift a price collapse onto the steel distribution industry, similar to the third and fourth quarter 2019.”
“Demand will be down 10-15 percent, capacity cuts are about 6 percent, not nearly enough to prevent pricing erosion.”
“In the short term it depends on how long the Big Three stay out and if other industries or large OEMs are impacted. Demand is dropping for sure. Whether the balance of the drop in demand is equal to the drop in supply and is aligned with the right type of steel remains a mystery.”
“Regardless of what the mills are doing to manipulate supply, they may be living in and clinging to yesterday’s market. The world is moving on to living in the here and now while preparing for tomorrow. Attempting to place a floor under a market with limited demand is a noble objective but will also prove to be just as futile.”
“The question is, when things turn around, will there be a shortfall of available flat rolled?”


