

Market Data

April 6, 2020
SMU Analysis: Key Market Indicators through March
Written by Peter Wright
Steel Market Update’s monthly analysis of Key Market Indicators has done a good job of anticipating the ups and downs of the steel market in the past, but the economic data currently available seriously lags the impact of the coronavirus on the economy. Only 3 of 36 indicators in this month’s report have even begun to reflect the dire nature of today’s situation. Therefore, we will limit our comments to those three.
To put the situation in perspective, consider this comment from respected market analyst Frank Homes: “Is every bear market cut from the same cloth? Hardly. In a research report, Goldman Sachs analysts break bear markets down into three different types: structural, cyclical and event-driven. Structural bear markets have been triggered by structural imbalances and financial bubbles—think the global financial crisis. Cyclical bear markets have occurred at the end of business cycles—they’ve happened as a result of rising interest rates, impending recessions and/or falling corporate profits. And finally, event-driven bear markets have been triggered by one-off shocks to the economy, such as wars, oil price crashes and emerging market crises. We appear to be in an event-driven bear market, and the good news, from a financial point of view, is that of the three types, event-driven bear markets have historically been less severe than structural and cyclical downturns. Not only have declines been less painful, but they also haven’t lasted as long and recovery times have been shorter. There are a couple of caveats I’d like to point out, though. Number one, no bear market such as this has ever been triggered by a virus or other disease outbreak, according to Goldman Sachs, so we’re literally in unchartered territory. And number two, there’s always the risk that this event-driven bear market will become a cyclical bear market. We are 11 years into the economic expansion, with debt levels and leveraging at all-time highs. Meanwhile, the U.S. government is already running a $1 trillion deficit. This may limit the government’s ability to prop up the economy should it come crashing down.”
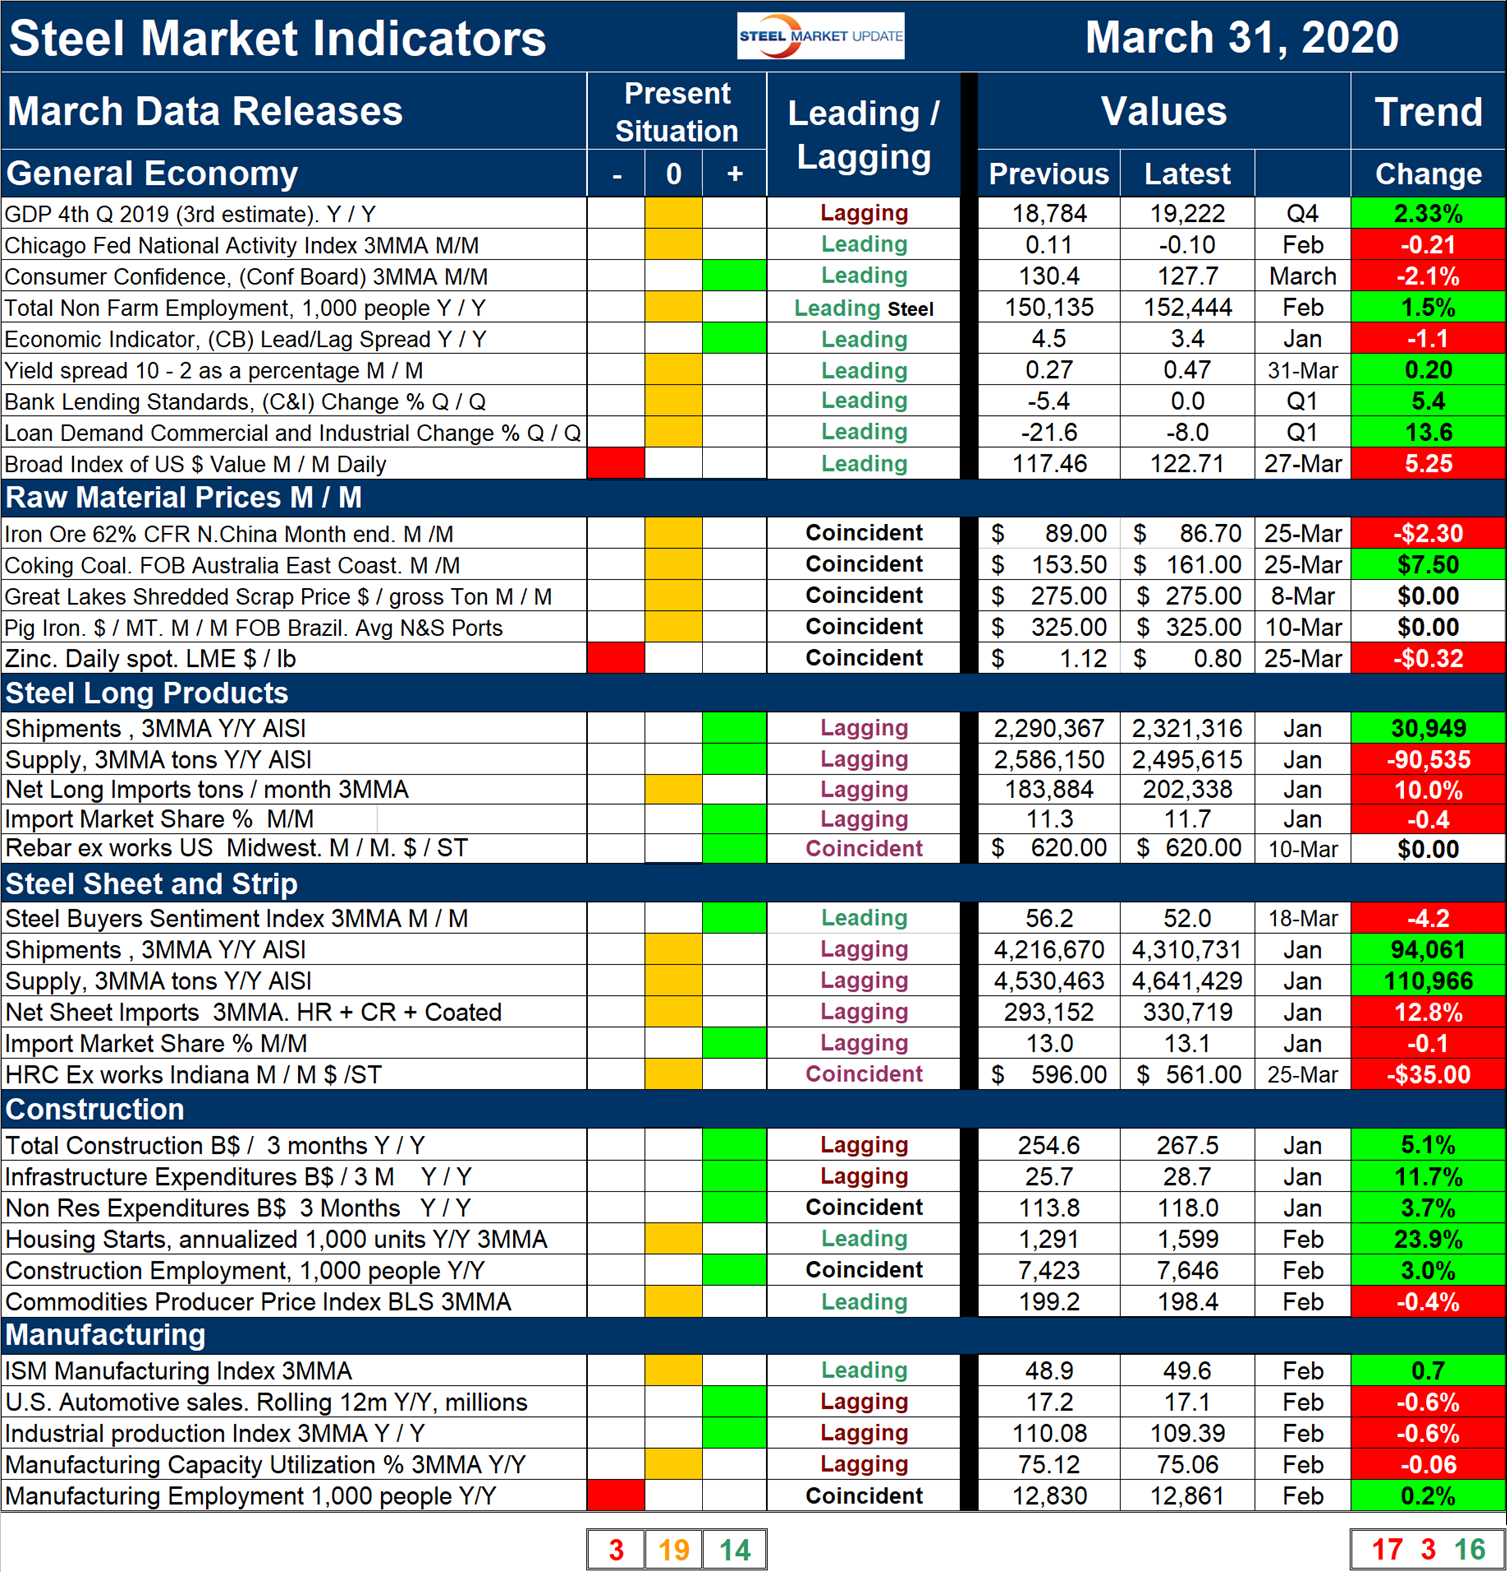
Table 1 shows our view of the present situation and the quantitative measure of trends. All results are the latest available as of March 31, 2020.
Present Situation
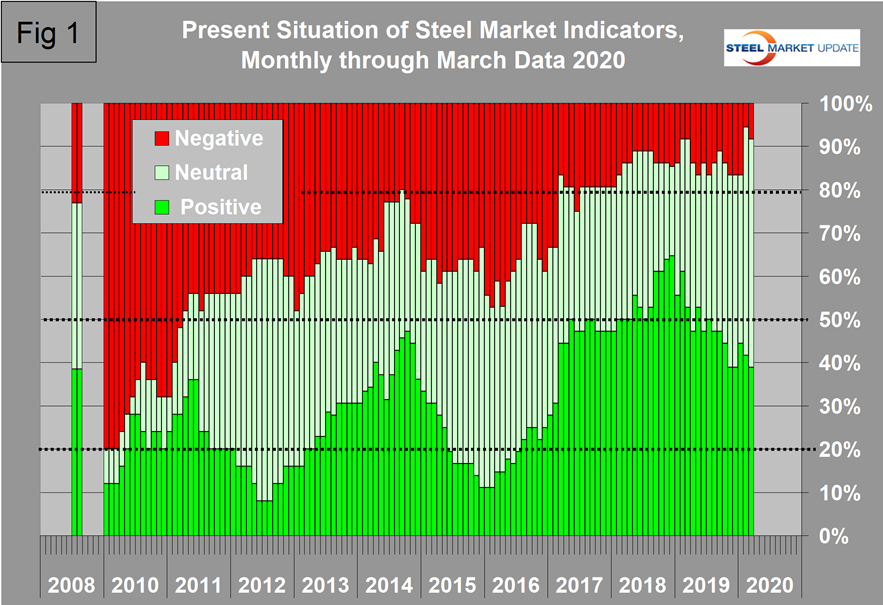
None of the indicators of the present situation have been affected by the pandemic. Figure 1 shows the history of our view of the present situation data since January 2010 on a percentage basis. On the far left of the chart is the August 2008 situation immediately before the recession struck the steel business in September that year.
Trends
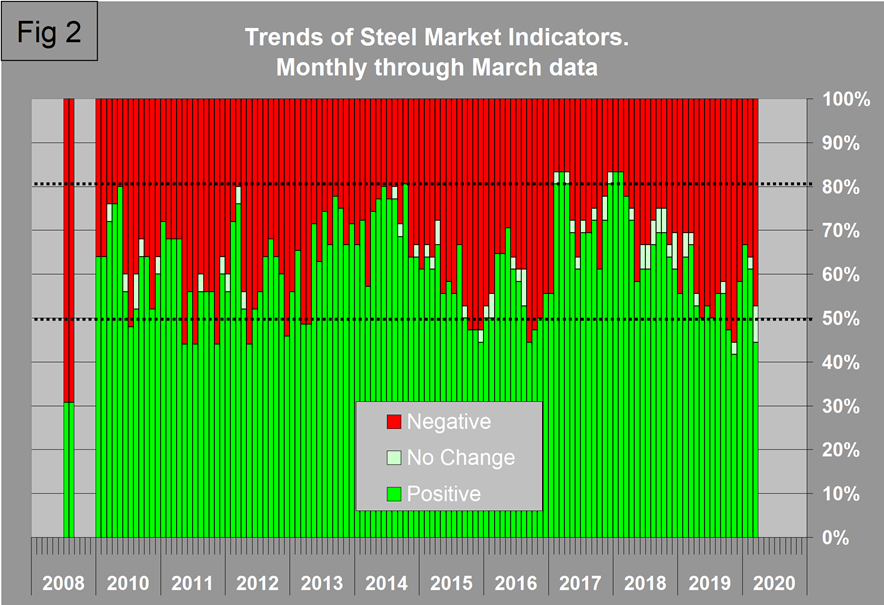
Most values in the trends columns are three-month moving averages (3MMA) to smooth out what can be erratic monthly data. This will also slow the realization of the extent of the problem as we move through the second quarter. Figure 2 shows the history of trends in this analysis. There was a downturn in March as six indicators switched from positive, four to negative and two to unchanged. This suggests a cyclical weakening before drastic measures were taken to slow the epidemic.
The three indicators that have been affected through the end of March are the yield spread, the value of the dollar and steel buyers sentiment:
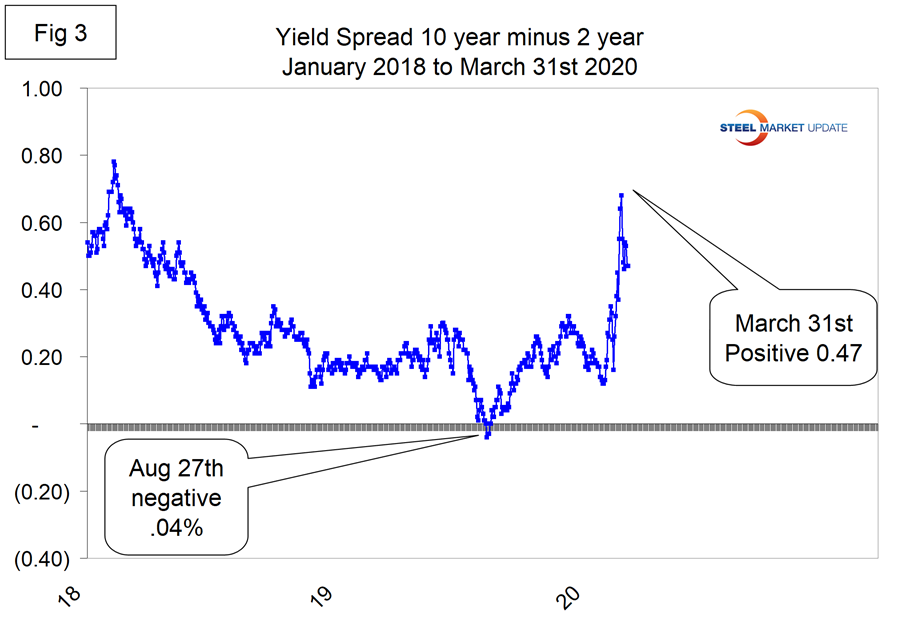
The Yield Spread: As the Fed has made an unprecedented reduction in the federal funds transfer rate, the yield spread has shot up from 0.16 on March 9 to 0.47 on March 30. This is not a 3MMA and is falsely suggesting that the chance of recession has decreased.
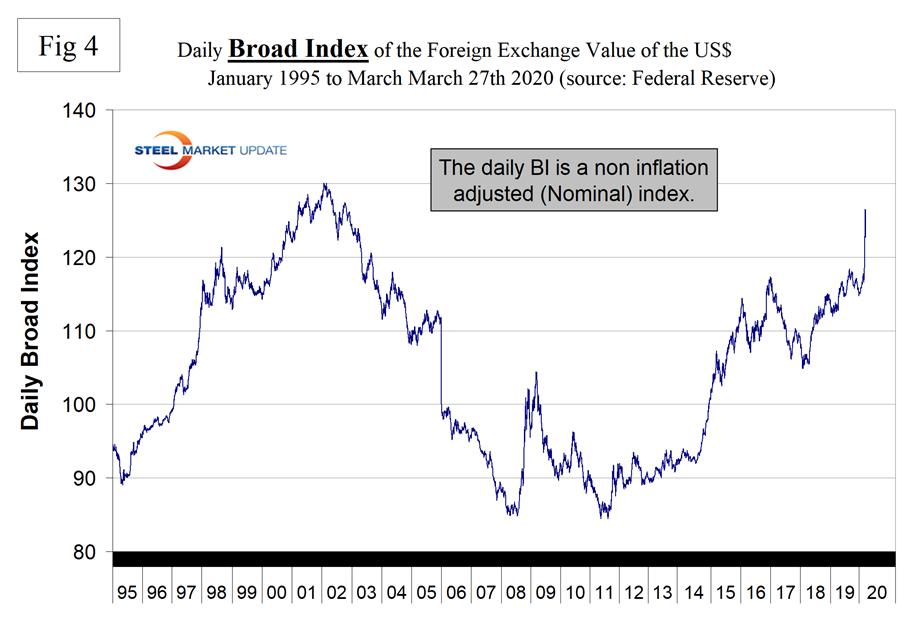
The Daily Broad Index Value of the U.S. Dollar: There has been a huge flight to the safe haven of the U.S. dollar in the month of March. The index appreciated by 8 percent between the dates of March 2 and March 23 to its highest level since 2002 (Figure 4). This will put downward pressure on commodity prices such as iron ore and will exacerbate the effect of declining demand. This also not a 3MMA.
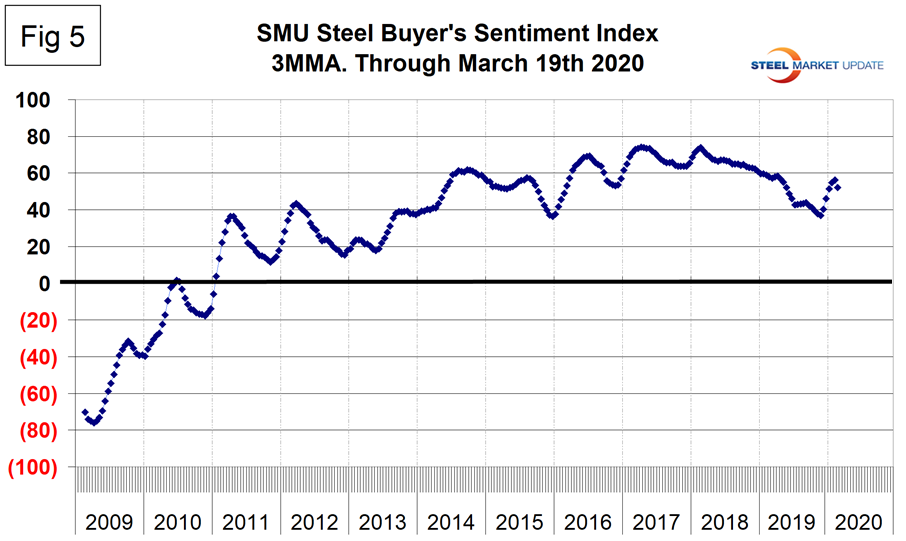
SMU’s Steel Buyers Sentiment Index: Figure 5 shows the 3MMA of the index since its inception in 2009. The single value of the index fell from +58 in mid-February to +13 in mid-March. The SMU Steel Buyers Sentiment is a measure of the current attitude of North American buyers and sellers of flat rolled products regarding their company’s opportunity for success in today’s market. A reading above the neutral point of zero indicates that a preponderance of buyers have a positive attitude. The index was still surprisingly positive in mid-March but is expected to decline in the upcoming survey. This is an instance where a 3MMA obscures the magnitude of the current change.
Explanation: The point of this analysis is to give both a quick visual appreciation of the market situation and a detailed description for those who want to dig deeper. It describes where we are now and the direction the market is headed and is designed to describe the situation on a specific date. The chart is stacked vertically to separate the primary indicators of the general economy, of raw material prices, of both sheet and long product market indicators, and of construction and manufacturing indicators. The indicators are classified as leading, coincident or lagging as shown in the third column.
Columns in the chart are designed to differentiate between where the market is today and the direction it is pointing. Our evaluation of the present situation is subjectively based on our opinion of the historical value of each indicator. There is nothing subjective about the trends section, which provides the latest facts available on the date of publication. It is quite possible for the present situation to be predominantly red and trends to be predominantly green or vice versa depending on the overall situation and direction of the market. The present situation is subdivided into: below the historical norm (-), (OK), and above the historical norm (+). The “Values” section of the chart is a quantitative definition of the market’s direction. In most cases, values are three-month moving averages to eliminate noise. In cases where seasonality is an issue, the evaluation of market direction is made on a year-over-year comparison to eliminate this effect. Where seasonality is not an issue, concurrent periods are compared. The date of the latest data is identified in the third values column. Values will always be current as of the date of publication. Finally, the far-right column quantifies the trend as a percentage or numerical change with color code classification to indicate positive or negative direction.


