

Market Data
May 4, 2020
SMU Energy Analysis for April
Written by Brett Linton
In its latest Short-Term Energy Outlook, the Energy Information Administration (EIA) noted that the COVID-19 pandemic has caused significant changes in energy supply and demand patterns. Because those changes are still evolving, the outlook is subject to heightened levels of uncertainty. What is certain is that crude oil prices have fallen significantly since the beginning of 2020, largely driven by the economic contraction caused by the coronavirus and a sudden increase in crude oil supply resulting from a dispute among the OPEC+ nations.
![]()
Steel consumption—notably oil country tubular goods and line pipe—is subject to swings in energy prices and drilling activity. Steel producers and distributors report dismal demand from the energy sector at present.
EIA forecasts U.S. crude oil production will average 11.8 million barrels per day in 2020, down 0.5 million b/d from 2019. In 2021, EIA expects U.S. crude production to decline further by 0.7 million b/d. If realized, the 2020 production decline would mark the first annual decline since 2016. Typically, price changes impact production after about a six-month lag. However, current market conditions, combined with the COVID-19 pandemic, will likely reduce this lag as many energy producers have already announced plans to reduce capital spending and drilling levels, EAI said.
EIA expects the global oil supply to remain near first-quarter 2020 levels in the coming months. OPEC output rose to a 13-month high in April as a price war between Saudi Arabia and Russia led to production increases. The two nations have since agreed to start cutting output to 9.7 million barrels a day in May and June. Upstream supply projects from countries outside OPEC require years of development and, once brought online, continue producing even in low oil price environments as operating costs per barrel are generally low. However, EIA forecasts that low oil prices will immediately reduce U.S. lower 48 crude oil production in the second quarter of 2020 as drilling activity slows significantly.
Spot Prices
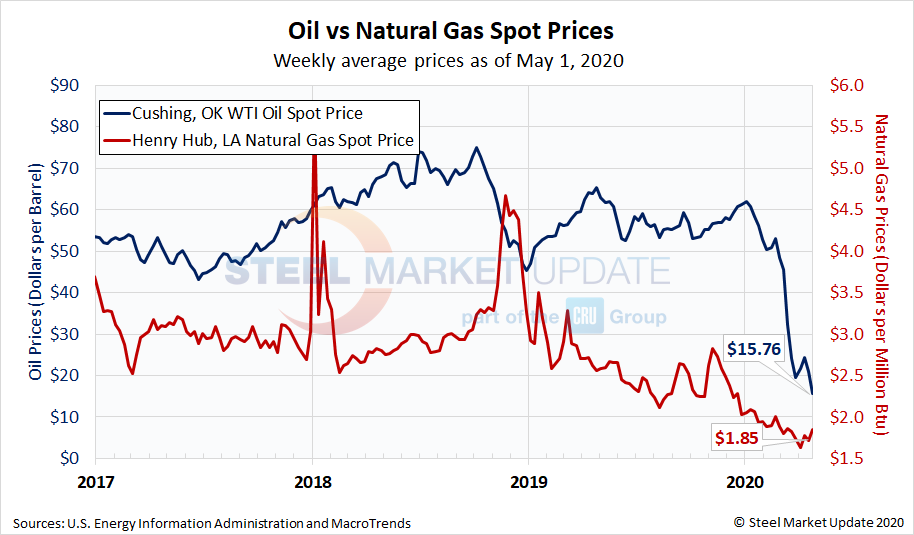
The spot market price for West Texas Intermediate (WTI) was $15.76 per barrel as of May 1, less than half of the $46.75 level at the beginning of March prior to the coronavirus shutdowns (Figure 1), above. Natural gas at the Henry Hub in Oklahoma was priced at $1.85 per MMBTU (million British Thermal Units) as of April 24, down from around $2.00 at the beginning of the year. Natural gas continues to make inroads against coal as an electric power generator, which is the primary consumer of natural gas in the United States. The benchmark price for U.S. oil made headlines on April 20 when the May WTI crude contract settled in negative territory for the first time ever. Analysts say the supply overhang is likely to keep a lid on crude prices in the coming weeks and months, although some see possible recovery later in the year as producers cut output and reduce investment in response to the collapse in prices.
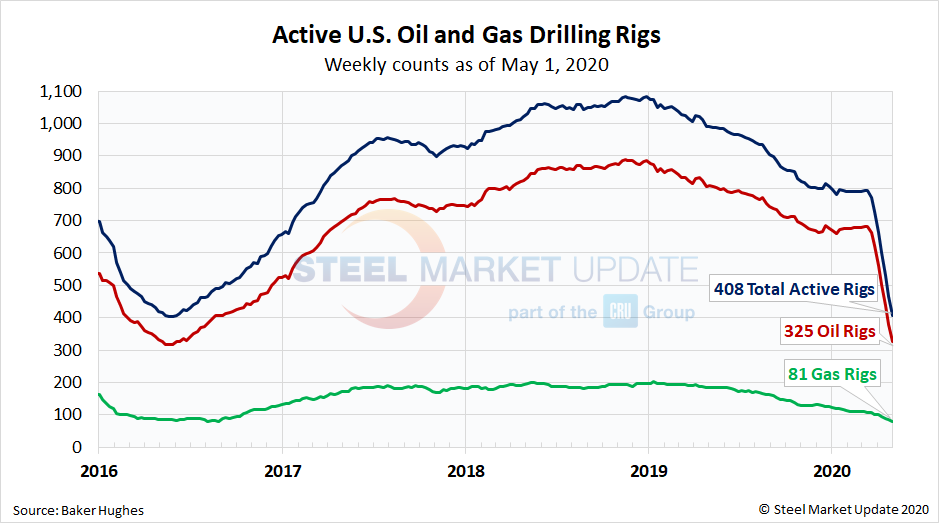
Rig Counts
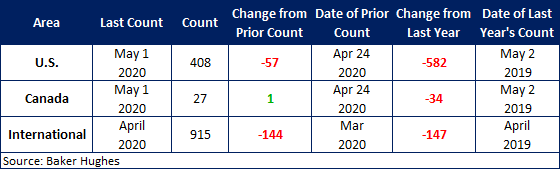
The number of active U.S. rigs drilling for oil fell for a seventh week in a row last week to 325 rigs, according to the latest data from Baker Hughes (Figure 2), below. In mid-March, there were 683 rigs actively drilling for oil in the U.S. By May 1, that number had declined by half. During the boom times for U.S. energy production at the outset of 2019, there were 1,075 total U.S. oil and gas rigs in production. The table below compares the current U.S., Canada and International rig counts to this time last year.
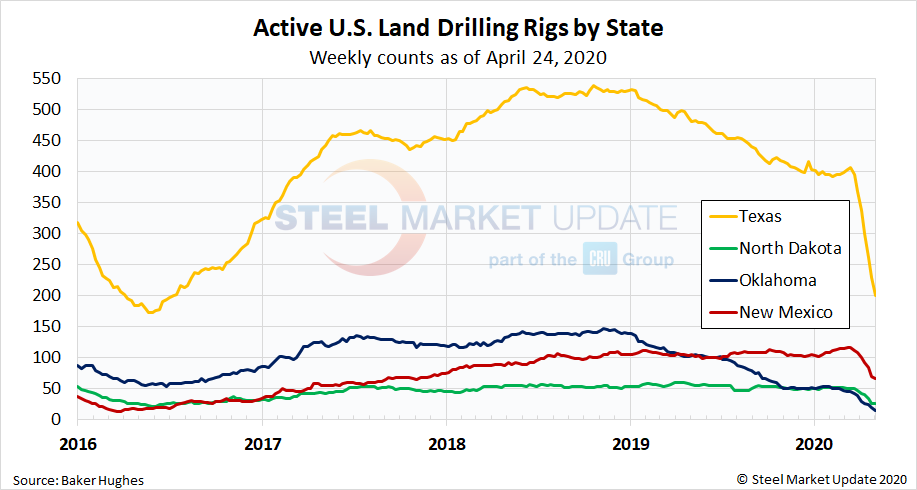
U.S. oil and gas production are heavily concentrated in Texas, Oklahoma, North Dakota and New Mexico, which have all seen declines of 50 percent or more in active drilling since March. The rig count in Texas plummeted from 396 on March 20 to 201 on May 1 (Figure 3), below.
Stock Levels
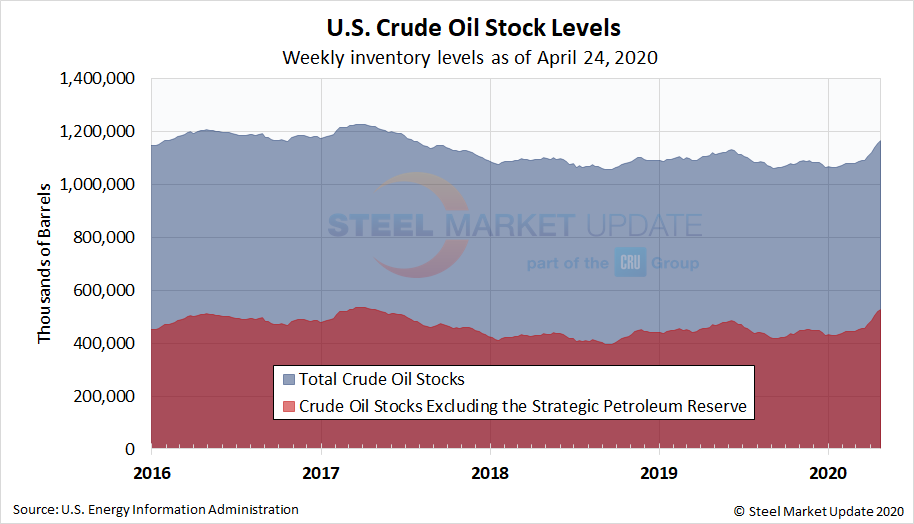
As of April 24, U.S. crude oil stocks had increased to 1.164 billion barrels, including 528 million barrels in the U.S. Strategic Petroleum Reserve (Figure 4), above. Because of the sharp decline in demand when the government shut down nonessential businesses in March, oil stocks accumulated dramatically, overwhelming the market’s ability to store them. The EIA reports an increase in unconventional forms of storage, such as floating storage on ships at sea, being used increasingly as on-land storage quickly fills.
These supply and demand developments are contributing to significant increases in liquid fuels inventories. EIA estimates that second-quarter 2020 global petroleum inventories will increase at an average rate of 11.4 million b/d, which would be the largest rate of inventory increases since EIA began keeping records. Within the Organization for Economic Cooperation and Development (OECD), total commercial petroleum inventories ended the month at 3.1 billion barrels in July 2016, the highest stock levels recorded since 2003. EIA forecasts inventories will surpass this level, but it remains uncertain how much commercially available storage capacity exists globally, particularly in non-OECD countries. EIA expects these large stock builds to keep downward price pressure on crude oil prices for several months. As a result, EIA forecasts Brent crude oil to average $23/b in the second quarter of 2020. As non-OPEC crude oil production begins declining in the fourth quarter of 2020, and global liquid fuels demand increases, prices will increase gradually. EIA forecasts Brent crude oil will increase from the lows of the second quarter of 2020 to average $46/b in 2021.


