

Market Data

May 22, 2020
Currency Update for Steel Trading Nations
Written by Peter Wright
The U.S. dollar weakened against 11 of the 16 steel trading nation currencies in the last 30 days, through May 18. The biggest change was that the Brazilian real headed in the other direction and declined by 9.2 percent. The effect of the coronavirus pandemic was not evident at the three-month level when the dollar strengthened against 12 of the 16. In the last three months, the currencies of Brazil, Mexico, Russia, South Africa and Turkey were down by double digits.
In this report, we examine the change in currency values of the 16 pre-eminent global steel and iron ore trading nations. The currencies of these 16 don’t necessarily follow the Broad Index value of the U.S. dollar, and that was the case in the last month. The latest value of the Broad Index as published by the Federal Reserve was May 15 on which date the dollar was up by 1.1 percent in 30 days. Our country data from Oanda was current as of May 18.
![]()
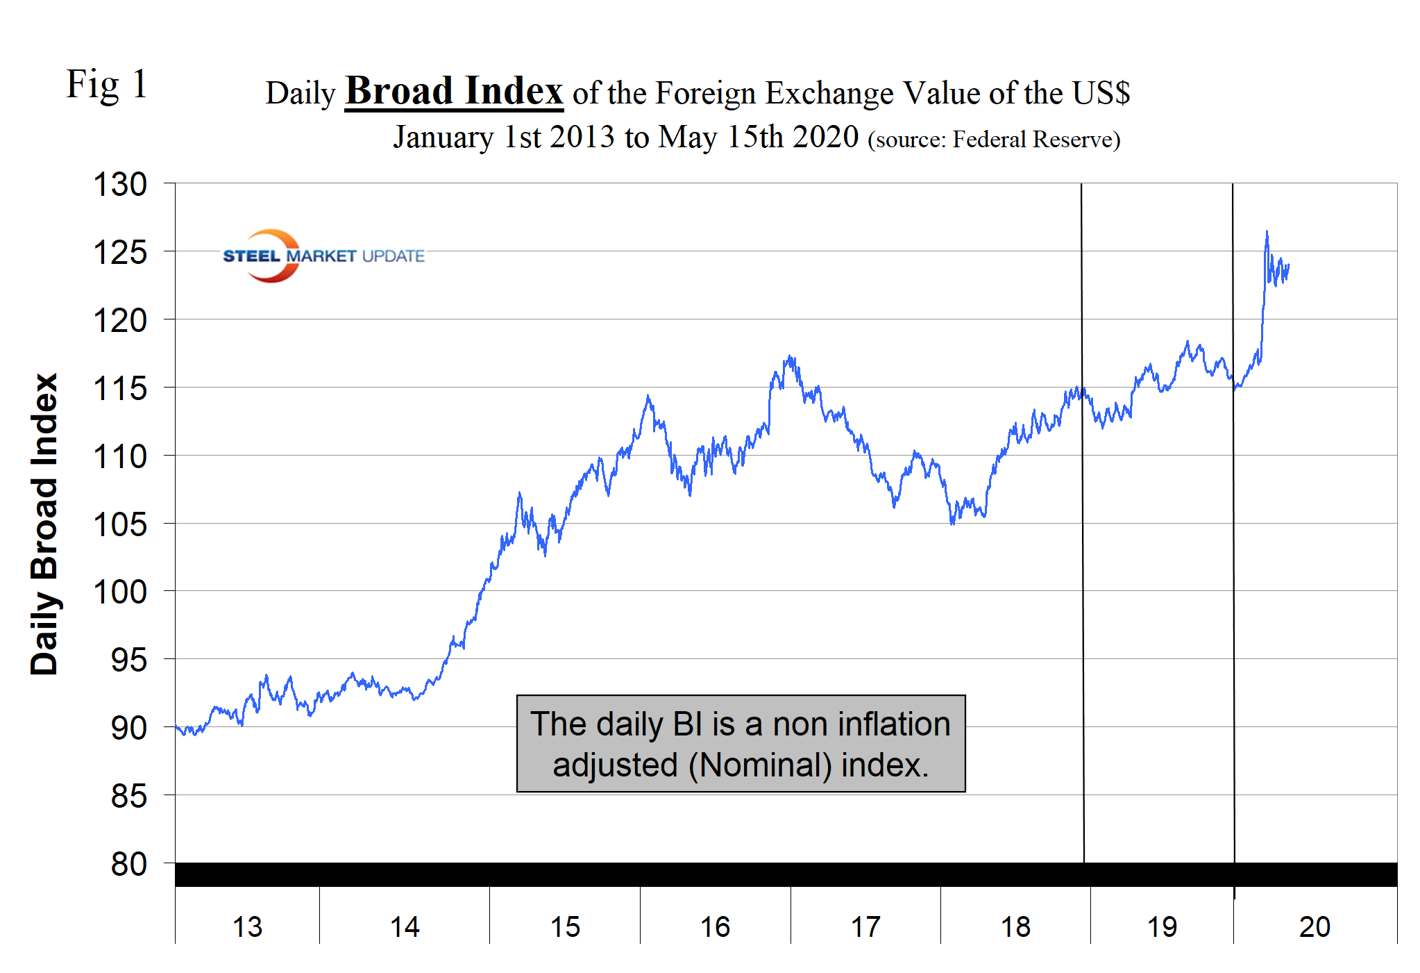
Figure 1 plots the daily Broad Index (BI) value of the U.S. dollar since 2013. This index weakened by 0.4 percent in three months and strengthened by 1.1 percent in one month, meaning that the trends are the opposite from the 16 nations under consideration here. We are inclined to believe that the Oanda data for the 16 nations gives a more accurate picture of the state of the dollar than does the official index.
The story of the currencies of the steel and raw materials trading nations was dramatic in the 30 days through May 18, which is likely to be a precursor of the next few months. Steel Market Update tracks the currencies of these 16 nations on a daily basis and reports monthly. Table 1 shows the number of currency units that it takes to buy one U.S. dollar and the percentage change in the last year, three months, one month and seven days. The overall picture for the steel trading nations is that in the last year and in the last three months the picture hasn’t changed much from our April 13 report, but in the last 30 days the dollar weakened against 11 of the 16 currencies. In our April report, the dollar strengthened against 14 of the 16 at the one month level—a huge turnaround. Table 1 is color coded to indicate weakening of the dollar in green and strengthening in red. We regard strengthening of the U.S. dollar as negative and weakening as positive because of the effect on net imports. Figures 2 and 3 show the extreme gyrations that have occurred at the three-month and one-month levels in the last four years.
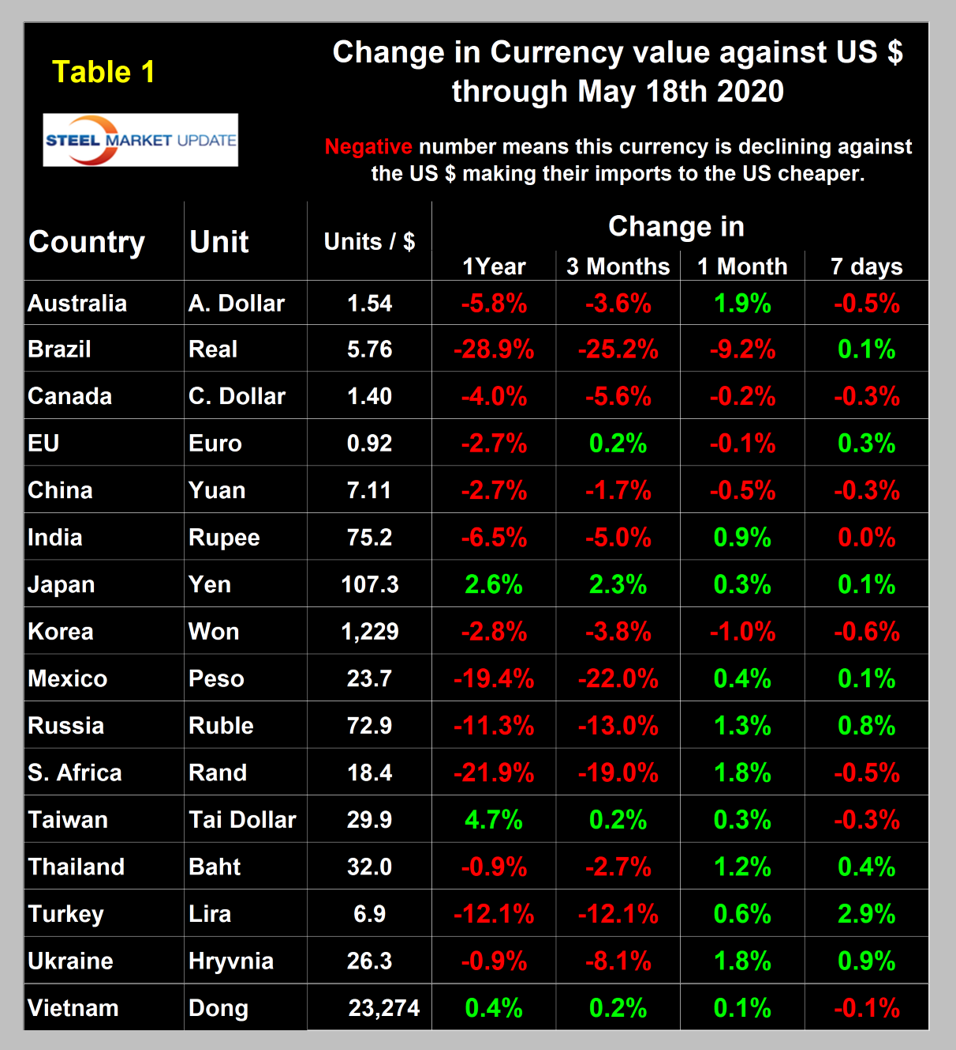
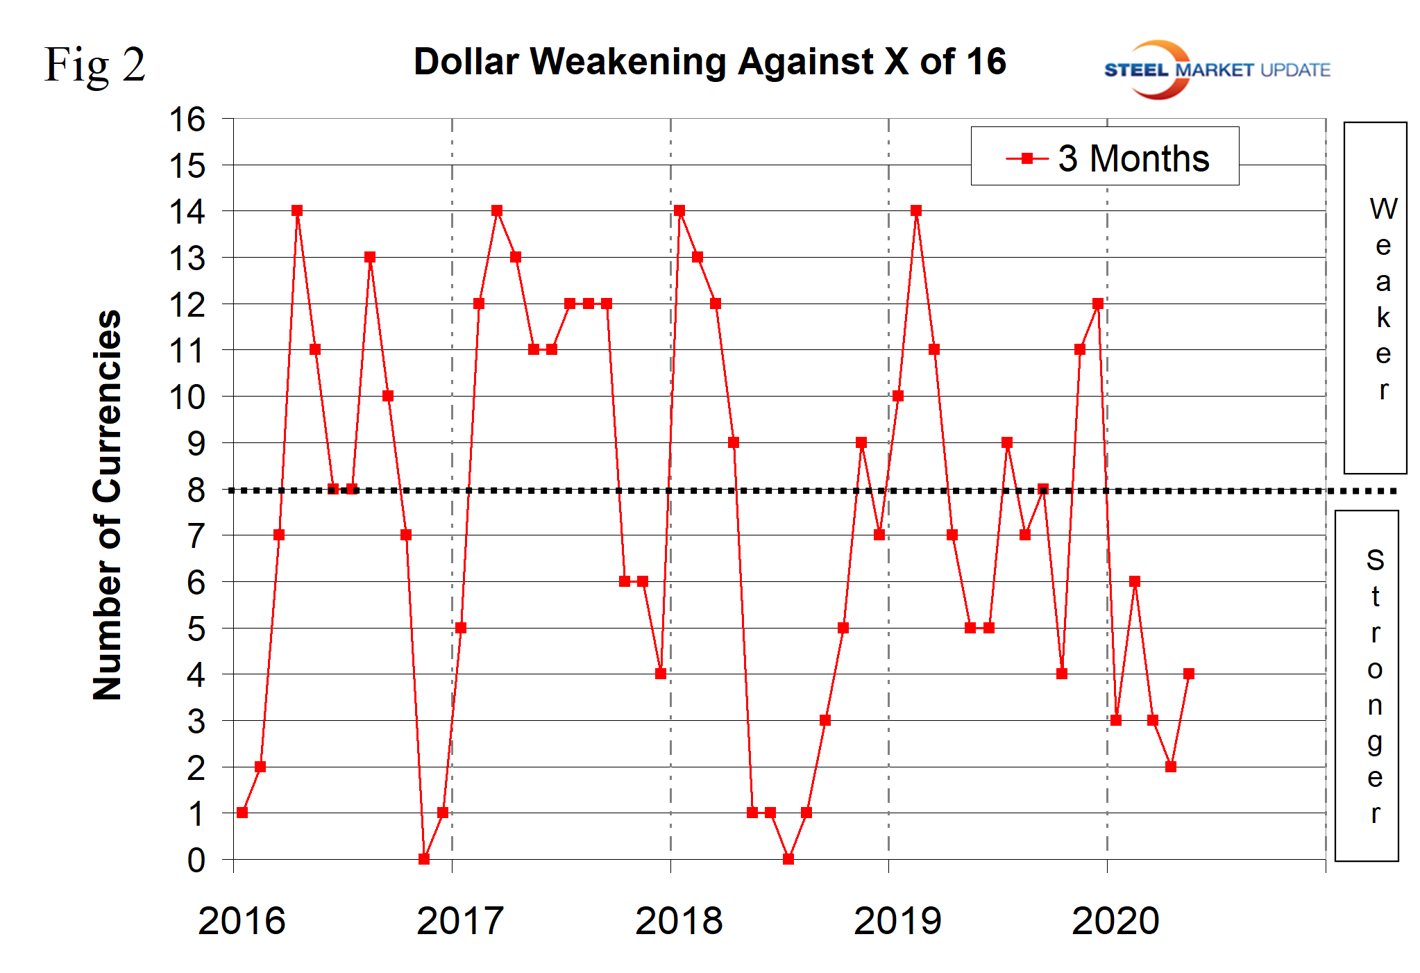
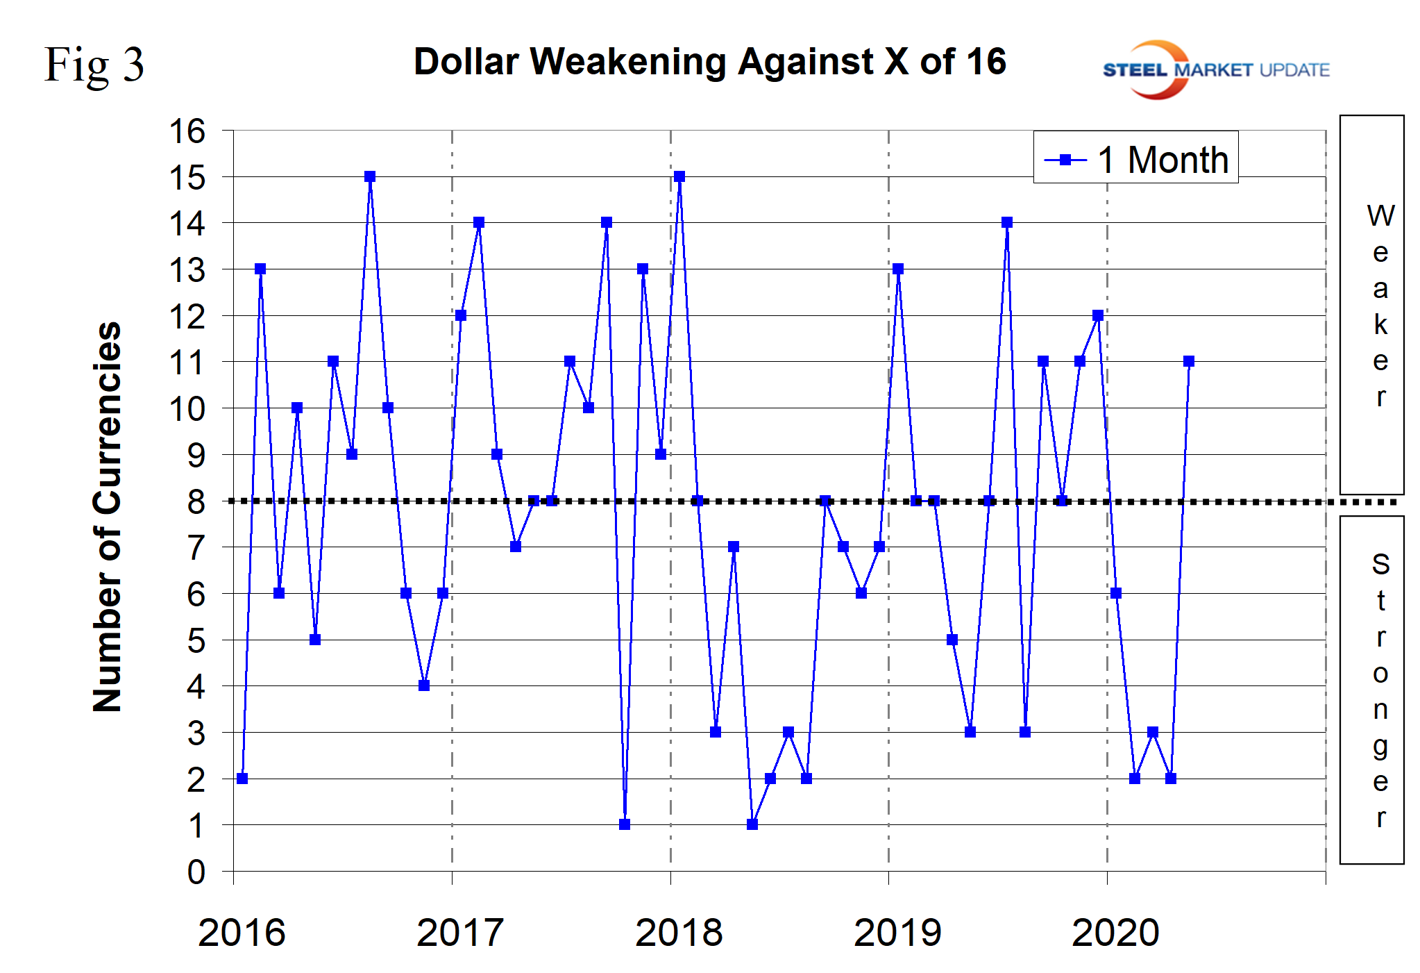
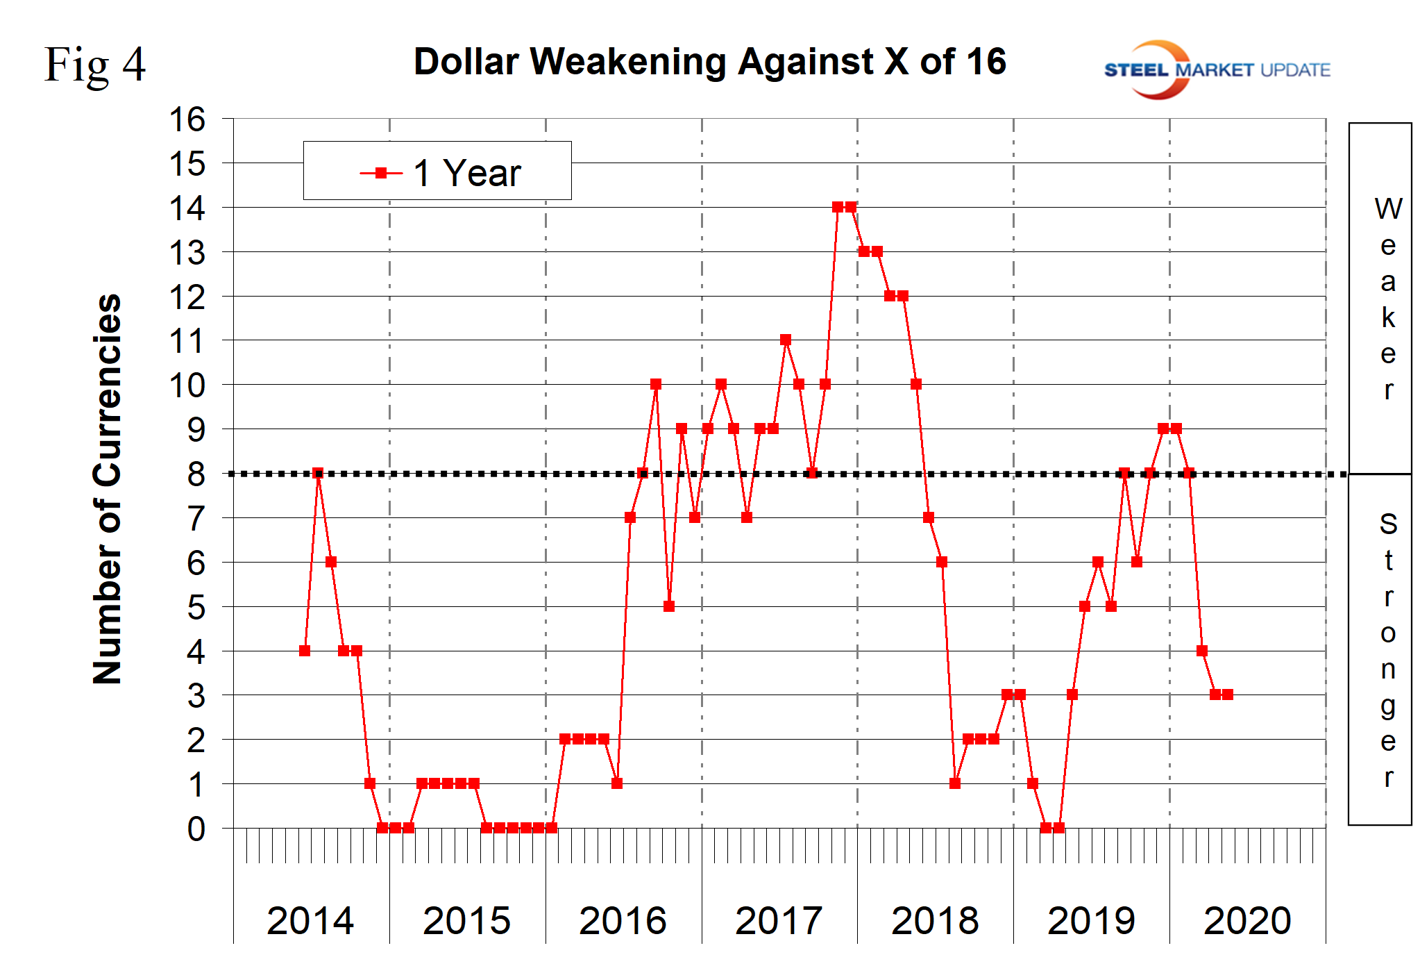
Figure 4 shows the 12-month picture, which removes some of the volatility by showing the number of currencies against which the dollar was weakening on a year-over-year basis. In March and April 2019, the dollar strengthened against all 16 at the 12-month level. There was a progressive weakening until December 2019 and January 2020 when the dollar weakened against nine of the 16. By mid-May 2020 there was another reversal as the dollar was weakening against only three. A strengthening dollar puts downward pressure on globally traded raw materials prices.
The biggest changes in the last three months were the Brazilian real, down by 25.2 percent; the Mexican peso, down by 22.0 percent; the Russian ruble, down by 13.0 percent; the South African rand, down by 19.0 percent; and the Turkish lira, down by 12.1 percent. (See the end of this report for details of data sources.)
Our files contain charts of the history of the value of all 16 steel trading nation graphs and are available on request.
Explanation of data sources: The Broad Index is published by the Federal Reserve on both a daily and monthly basis. It is a weighted average of the foreign exchange values of the U.S. dollar against the currencies of a large group of major U.S. trading partners. The index weights, which change over time, are derived from U.S. export shares and from U.S. and foreign import shares. The data are noon buying rates in New York for cable transfers payable in the listed currencies. At SMU we use the historical exchange rates published in the Oanda Forex trading platform to track the currency value of the U.S. dollar against that of 16 steel trading nations. Oanda operates within the guidelines of six major regulatory authorities around the world and provides access to over 70 currency pairs. Approximately $4 trillion U.S. dollars are traded every day on foreign exchange markets.


