

Market Data
June 1, 2020
SMU Energy Analysis for May
Written by Brett Linton
The U.S. Energy Information Administration (EIA) reports that exploration and development expenditures are likely to drop significantly this year. Global expenditures related to oil and gas E&D increased $42 billion (13 percent) in 2019, totaling $361 billion, according to the aggregate financial reports for 102 publicly traded oil companies. Additions to these companies’ collective proved reserves totaled 18 billion barrels of oil equivalent (BOE), consistent with the 2010-18 annual average additions. As a result of the price declines since the beginning of 2020, however, global proved reserves will likely be revised significantly downward this year. Therefore, E&D expenditures also will likely see big declines–as will demand for oil country tubular goods and line pipe.
Collective E&D expenditures for the 102 companies polled by EIA averaged $20/BOE in 2010-19, an average ratio of 26 percent to Brent crude oil spot prices during that period. In its May Short-Term Energy Outlook, EIA forecasts Brent crude oil prices will average $34 per barrel in 2020. If realized, these price levels imply E&D expenditures per BOE could fall by half, to about $10/BOE in 2020, depending on how much spending is actually reduced. Many companies have already announced budget cuts.
Spot Prices
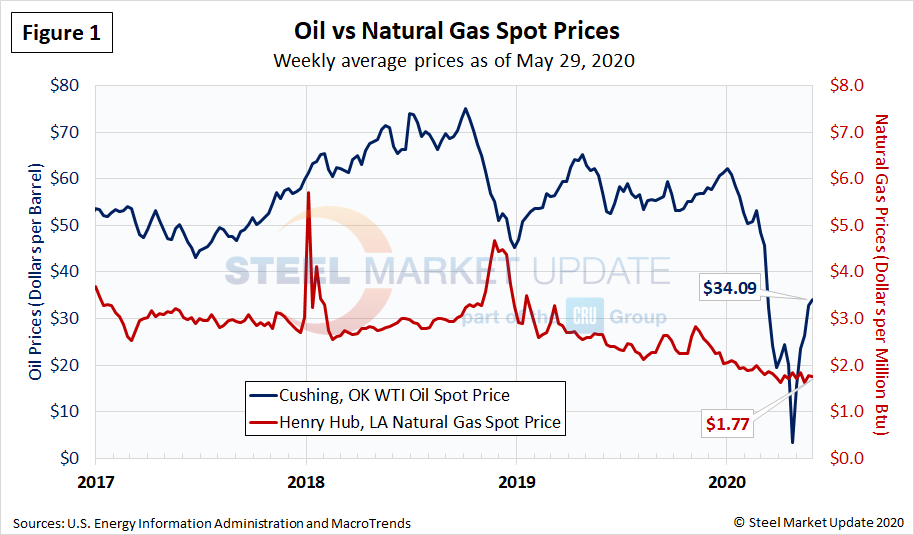
The spot market price for West Texas Intermediate (WTI) was $35.49 per barrel as of May 29, quite a recovery from the late-April low of $11.26 but still down from the $46.75 level at the beginning of March prior to the coronavirus shutdowns. Natural gas at the Henry Hub in Oklahoma was priced at $1.78 per MMBTU (million British Thermal Units) as of May 28, down from around $2.00 at the beginning of the year. Figure 1 shows the average price of oil at $34.09 and gas at $1.77 for the week ended May 29. The benchmark price for U.S. oil raised eyebrows on April 20 when the May WTI crude contract settled in negative territory for the first time ever. Analysts say the supply overhang is likely to keep downward pressure on crude prices for some time.
Rig Counts
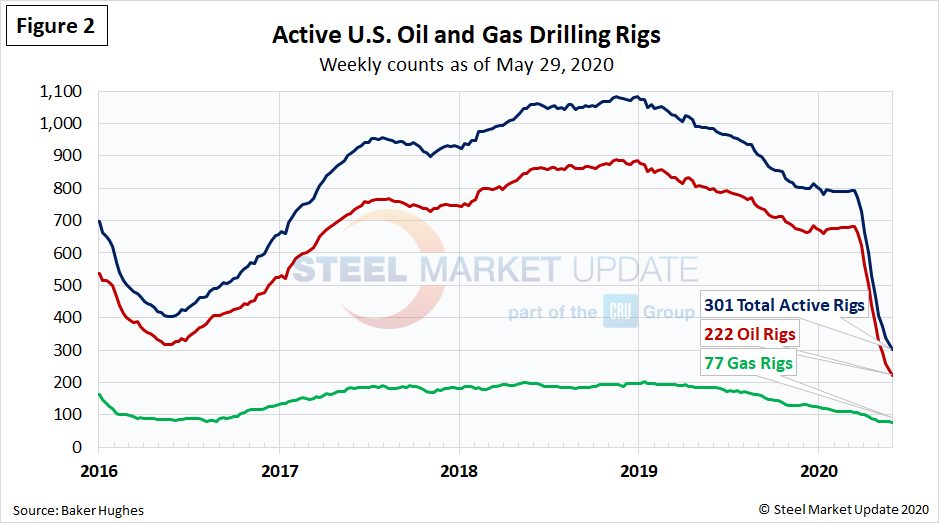
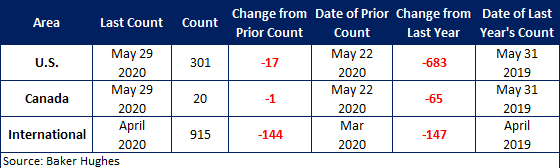
The number of active U.S. rigs drilling for oil fell for the 12th week in a row last week to 301 rigs, according to the latest data from Baker Hughes (Figure 2). In mid-March, there were 683 rigs actively drilling for oil in the U.S. By the end of May, that number had declined by two-thirds. During the boom times for U.S. energy production at the outset of 2019, there were 1,075 total U.S. oil and gas rigs in production. The table below compares the current U.S., Canada and International rig counts to this time last year.
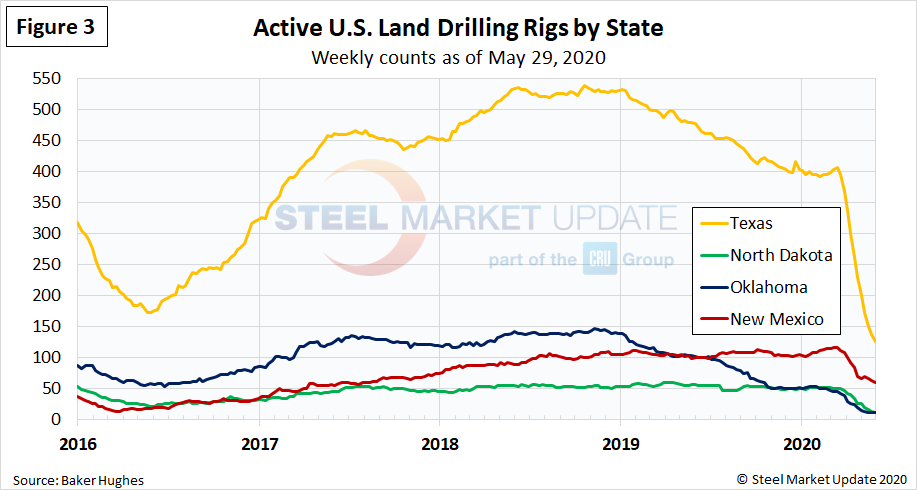
U.S. oil and gas production are heavily concentrated in Texas, Oklahoma, North Dakota and New Mexico, which have all seen declines of 50-75 percent in active drilling since mid-March. The rig count in Texas plummeted from 407 on March 13 to 127 on May 29 (Figure 3).
Stock Levels
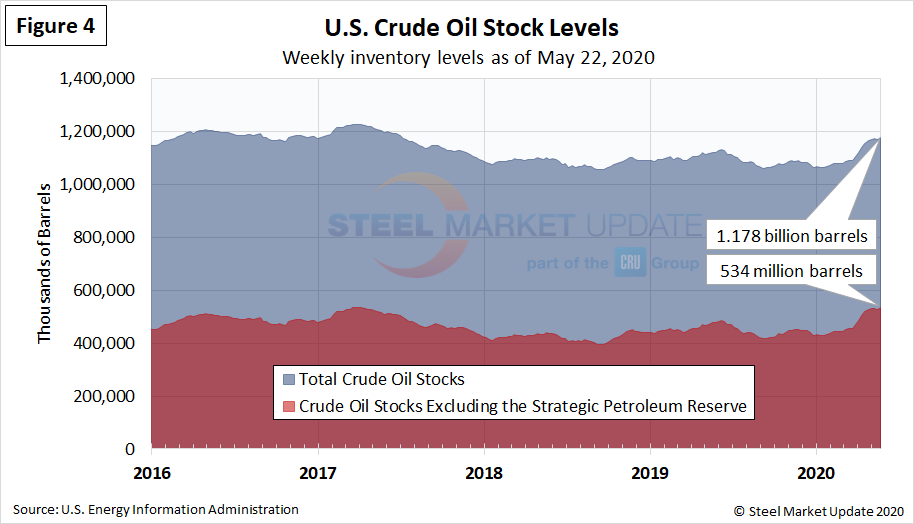
As mitigation efforts to contain the coronavirus pandemic continue to lead to rapid declines in petroleum consumption around the world, the production of liquid fuels globally has changed more slowly, leading to record increases in the amount of crude oil and other petroleum liquids placed into storage in recent months. The EIA expects global inventory builds will be largest in the first half of 2020. EIA estimates that inventory builds rose at a rate of 6.6 million barrels per day in the first quarter and will increase by 11.5 million barrels per day in the second quarter because of widespread travel limitations and sharp reductions in economic activity. After the first half of 2020, EIA expects global liquid fuels consumption to increase, leading to inventory draws for at least six consecutive quarters and ultimately putting upward pressure on crude oil prices that are currently at their lowest levels in 20 years.


