

Market Data

June 16, 2020
Currency Update for Steel Trading Nations
Written by Peter Wright
The U.S. dollar weakened against 13 of the 16 steel and raw materials trading nation currencies in the last 30 days, which follows a decline against 11 in our previous report. The biggest change was in the value of the Brazilian real, which led the pack of strengthening currencies. Experts suggest that the coronavirus pandemic and demonstrations in the U.S. are putting downward pressure on the dollar in international exchange markets..
![]()
On June 2, currency specialist Andrew Hecht wrote: “Fiat currencies are all losing purchasing power. The global foreign exchange market is a mirage as it measures the value of currencies against other foreign exchange instruments. The dollar index is a barometer of the value of the U.S. currency against the euro and other foreign exchange reserve instruments. Central banks hold dollars, euros, pounds, and many other currencies as part of their foreign exchange reserves. They also hold gold in the same category. The price action in the yellow metal continues to tell us that gold has gained value against all foreign exchange instruments over the past year. It has risen to an all-time high compared to euros, pounds, the Australian and Canadian dollars, the Chinese yuan, Russian ruble, and a host of other convertible and nonconvertible currencies. The latest shoe to drop was in the Swiss franc, which fell to a new record low against gold in May. In dollar terms, gold at the $1,740 level is only around $180 below its record high from 2011. Gold has been moving higher against all foreign exchange instruments, which tells us that fiat currencies that depend on the faith and credit of the countries that print the legal tender are falling. The dollar and all other foreign exchange instruments are losing purchasing power.”
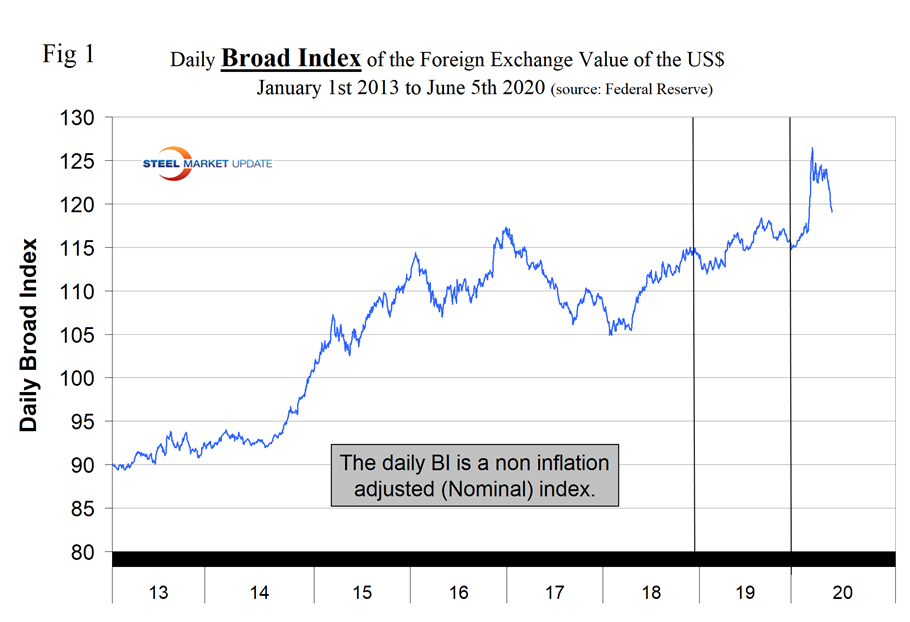
In this report we examine the change in currency values of the 16 preeminent global steel and iron ore trading nations. The currencies of these 16 don’t necessarily follow the Broad Index value of the U.S, dollar, but in the last three months have done so. The latest value of the Broad Index as published by the Federal Reserve was June 5, on which date the dollar was down by 3.5 percent in three months and by 2.8 percent in 30 days. Our country data from Oanda was current as of June 14.
Figure 1 plots the daily Broad Index (BI) value of the U.S. dollar since 2013.
The currencies of the steel and raw materials trading nations were much more volatile in the 30 days prior to June 14 than they were in the same period leading up to our May 18 report. At Steel Market Update, we track the currencies of these 16 nations on a daily basis and report monthly. Table 1 shows the number of currency units that it takes to buy one U.S. dollar and the percentage change in the last year, three months, one month and seven days. The overall picture for the steel trading nations is that in the last year the picture hasn’t changed much, but in three months and 30 days the dollar has become increasingly weaker. Table 1 is color coded to indicate weakening of the dollar in green and strengthening in red. We regard strengthening of the U.S. dollar as negative and weakening as positive because of the effect on net imports. Figures 2 and 3 show the extreme gyrations that have occurred at the three-month and one-month levels in the last four years.
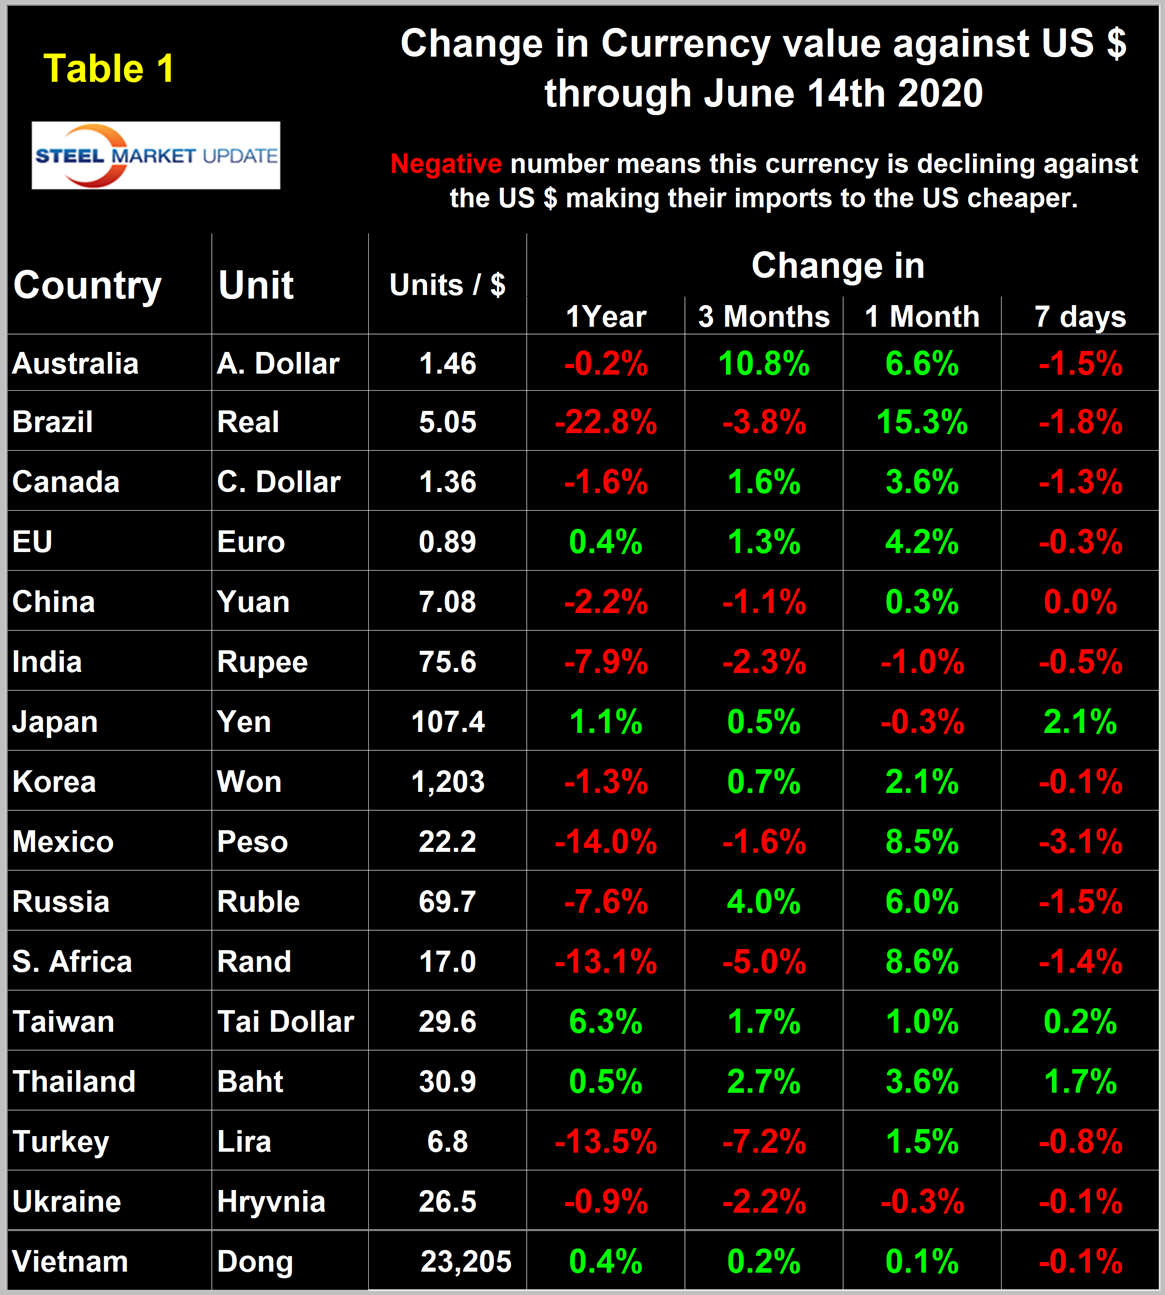
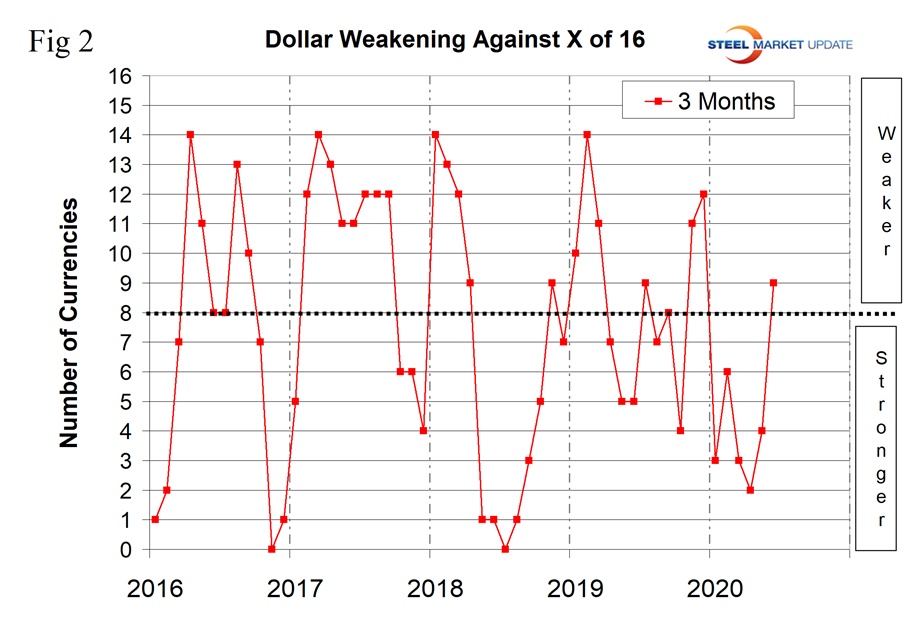
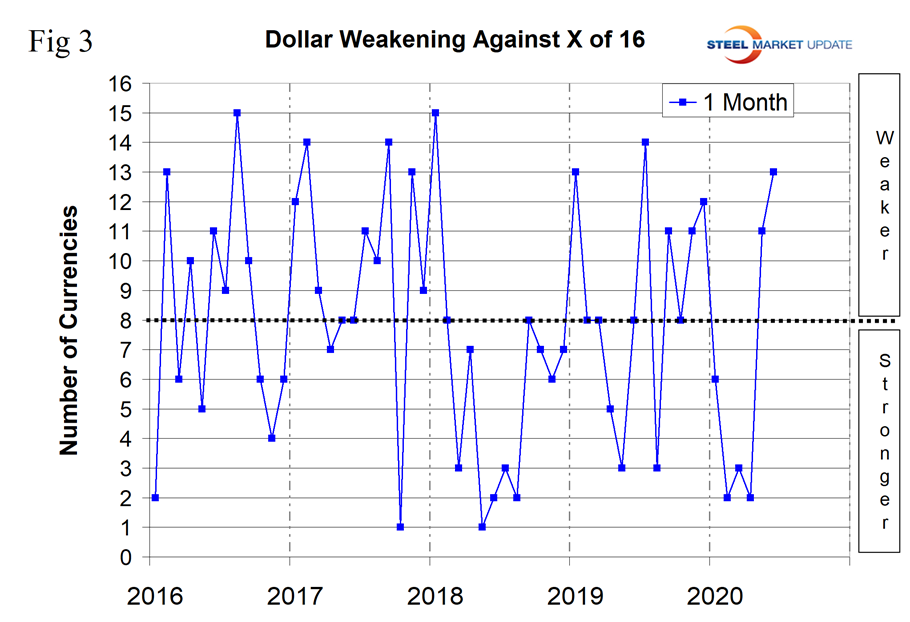
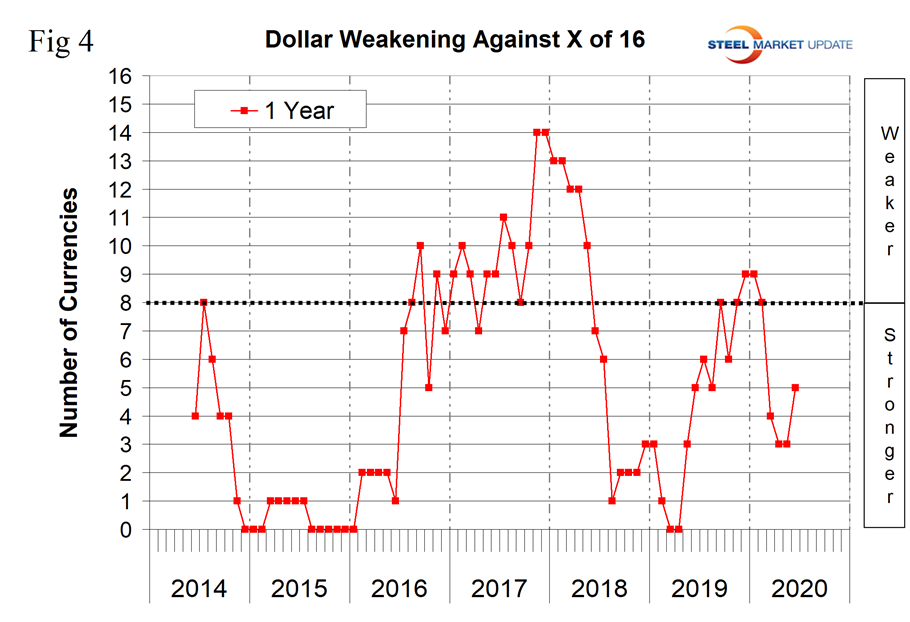
Figure 4 shows the 12-month picture, which removes some of the volatility by showing the number of currencies against which the dollar was weakening on a year-over-year basis. In March and April 2019, the dollar strengthened against all 16 at the 12-month level. There was a progressive weakening until December 2019 and January 2020 when the dollar weakened against nine of the 16. In the 12 months leading up to mid-June 2020, another reversal had occurred by which time the dollar was weakening against five. A strengthening dollar puts downward pressure on globally traded raw materials prices.
The biggest changes in the last month were the Brazilian real, up by 15.3 percent; the Mexican peso, up by 8.5 percent; and the South African rand, up by 8.6 percent. (See the end of this report for details of data sources.)
SMU’s files contain charts of the history of the value of all 16 steel trading nation graphs and are available on request.
Explanation of data sources: The Broad Index is published by the Federal Reserve on both a daily and monthly basis. It is a weighted average of the foreign exchange values of the U.S. dollar against the currencies of a large group of major U.S. trading partners. The index weights, which change over time, are derived from U.S. export shares and from U.S. and foreign import shares. The data are noon buying rates in New York for cable transfers payable in the listed currencies. At SMU we use the historical exchange rates published in the Oanda Forex trading platform to track the currency value of the U.S. dollar against that of 16 steel trading nations. Oanda operates within the guidelines of six major regulatory authorities around the world and provides access to over 70 currency pairs. Approximately $4 trillion U.S. dollars are traded every day on foreign exchange markets.


