Market Data

June 16, 2020
Service Center Shipments and Inventories Report for June
Written by Estelle Tran
Flat Rolled = 62.5 Shipping Days of Supply
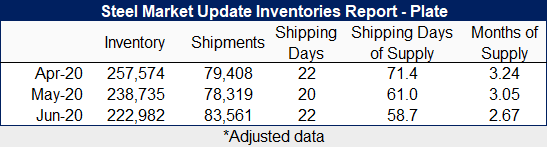
Plate = 58.7 Shipping Days of Supply
Flat Rolled
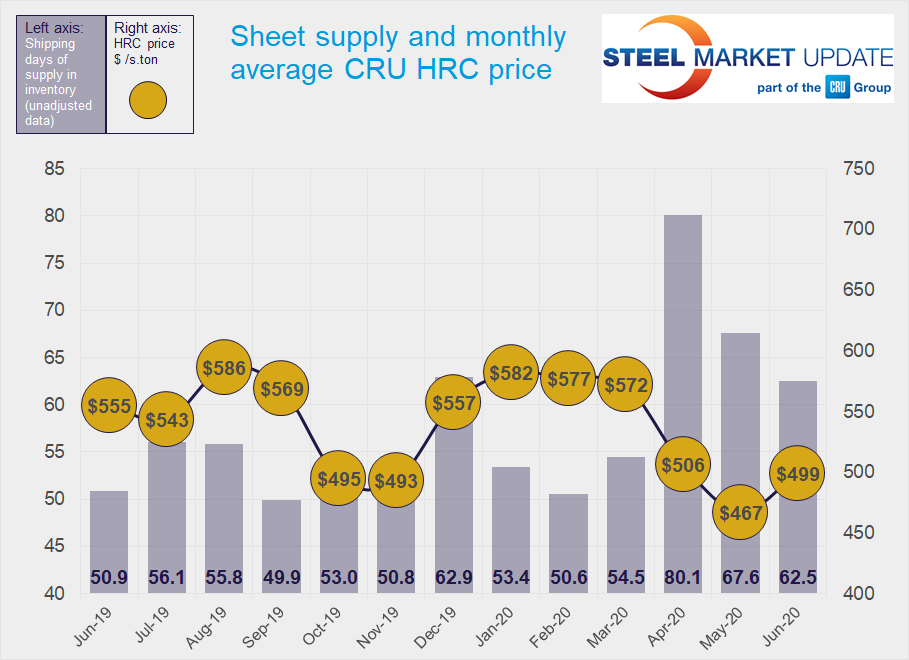
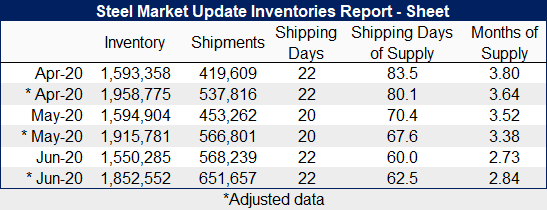
Service centers reduced their flat rolled supply to 62.5 shipping days of supply at the end of June, from 67.6, according to adjusted data. In terms of months on hand, June inventories represented 2.84 months of supply, down from 3.38 in May. Overall, flat rolled inventories decreased 3.3 percent month on month.
Shipments increased 15 percent month on month with the help of two extra shipping days. June had 22 shipping days, while May had 20. The daily shipping rate also increased 4.5 percent month on month.
On-order volumes, however, decreased month on month, as service centers have been trying to scale back their inventories to align with demand. Service centers remain reluctant to place new orders, as prices continue to erode and demand growth has been slow. Market contacts have reported that shipments have been 60-70 percent of what they were a year ago, and they are mainly keeping to their contract minimums. Negativity regarding sheet prices continues as steel production capacity comes back online and Covid-19 infections trigger lockdown measures around the country. Given these factors and mill HRC lead times keeping under four weeks, we expect service centers to continue to purchase steel only as needed.
Less inventory was tied to contracts in June at 50.7 percent, down from 52 percent in May.
Plate
At the end of June, service centers scaled back their plate supply to 58.7 shipping days of supply, down from 61 days in May. Plate supply represented 2.67 months of supply in June, down from 3.05 in May. Service center plate inventories decreased 6.6 percent month on month.
Shipments increased 6.7 percent in June. However, when accounting for the two extra shipping days, the daily shipping rate decreased 3 percent. Service center contacts have been pessimistic about plate demand, as there have been few large jobs to bid and much of the work has been maintenance related. The lower shipment levels coincided with the price increases announced in May and June, as end-users resisted the price increases.
The mill price increases spurred service center purchases in June, and on-order plate volumes jumped month on month.
With plate prices stable, service centers seem content to maintain their inventories and are hopeful that end-users who were sitting on the sidelines as prices were rising will return to the market. Mill lead times have been keeping to about 4-4.5 weeks, according to SMU survey data.
The percentage of plate inventories committed to contracts was 39 percent in June, up from 29.5 percent in May.