

Market Data

July 16, 2020
Currency Update for Steel Trading Nations
Written by Peter Wright
The U.S. dollar weakened against 14 of the 16 steel and raw materials trading nation currencies in the last 90 days, which follows a decline against nine in our June 14 report. The biggest change was in the value of the Australian dollar, which was up by 9.3 percent in three months. The only currencies to decline against the dollar in the last three months were the Brazilian real and the Turkish lira. Experts suggest that the pandemic and demonstrations in the U.S. are putting downward pressure on the dollar on international exchange markets.
![]()
On July 13, WWS Swiss Financial Consulting wrote: “The U.S. dollar continues to be the most important global reserve currency as well as the most widely used currency in international commercial transactions. This makes it possible for the U.S. to have a huge trade deficit without the U.S. dollar depreciating. The position of the U.S. dollar may change because of profligate spending on the part of the administration and weaponization of the currency. The greatest threat to U.S. dollar dominance comes from China, which has now found new allies in Iran and Russia. Investors should protect their wealth by diversification of their portfolios by investing in countries other than the U.S. Dollar depreciation is more than likely in the near future, and it may come more swiftly than one might expect. The Scout motto, “Be Prepared,” is appropriate in this case as is the motto of the United States Coast Guard, ‘Semper paratus’ (Always ready).”
Steel Market Update tracks the currencies of the 16 pre-eminent global steel and iron ore trading nations on a daily basis and reports monthly. The currencies of these 16 don’t necessarily follow the Broad Index value of the U.S. dollar, but in the last three months have done so. The latest value of the Broad Index as published by the Federal Reserve was July 10 on which date the dollar was down by 3.5 percent in three months and by 0.5 percent in 30 days. Our country data from Oanda was current as of July 14.
Figure 1 plots the daily Broad Index (BI) value of the U.S. dollar since 2013.
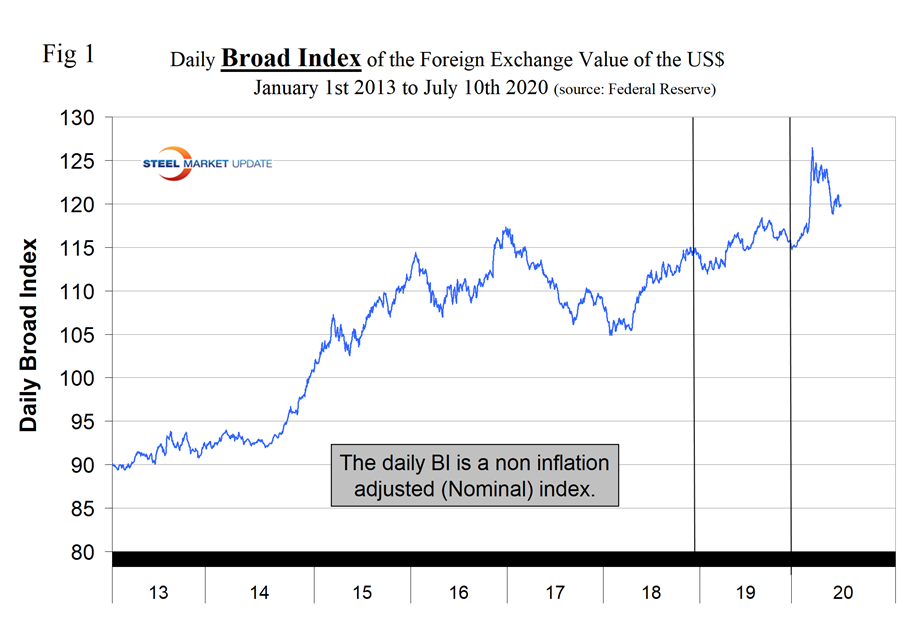
Table 1 shows the number of currency units that it takes to buy one U.S. dollar and the percentage change in the last year, three months, one month and seven days. The overall picture for the steel trading nations is that in three months prior to April 13, the dollar strengthened against 14 of the 16; in this current report of July 14 it weakened against 14 of the 16. Table 1 is color coded to indicate weakening of the dollar in green and strengthening in red. We regard strengthening of the U.S. dollar as negative and weakening as positive because the effect on net imports. Figures 2 and 3 show the extreme gyrations that have occurred at the three-month and one-month levels in the last four years.

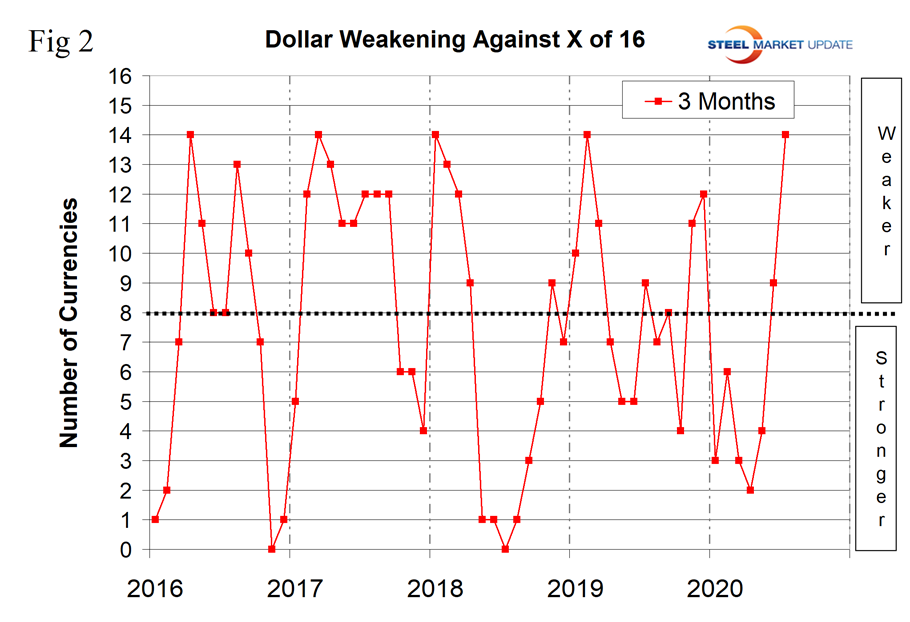
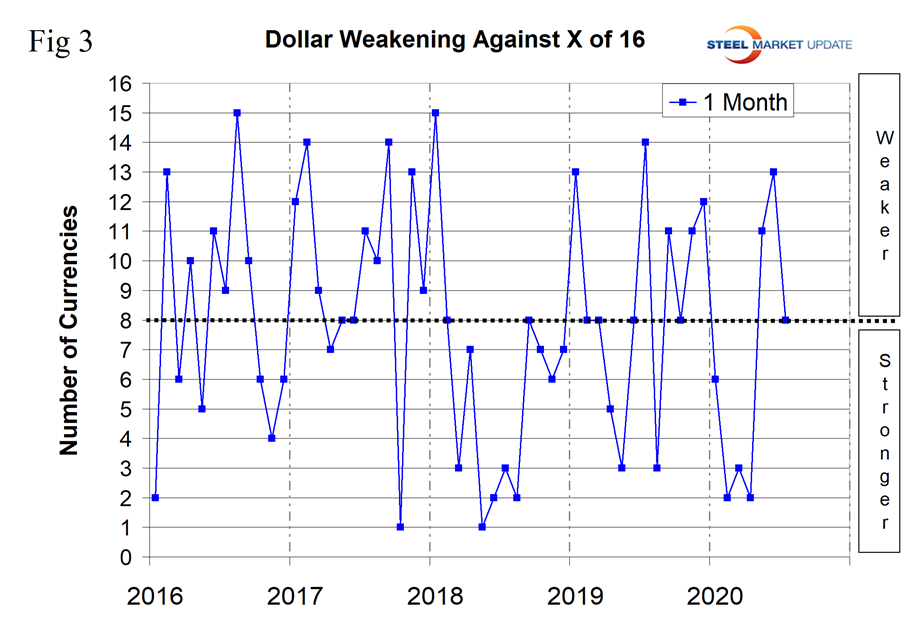
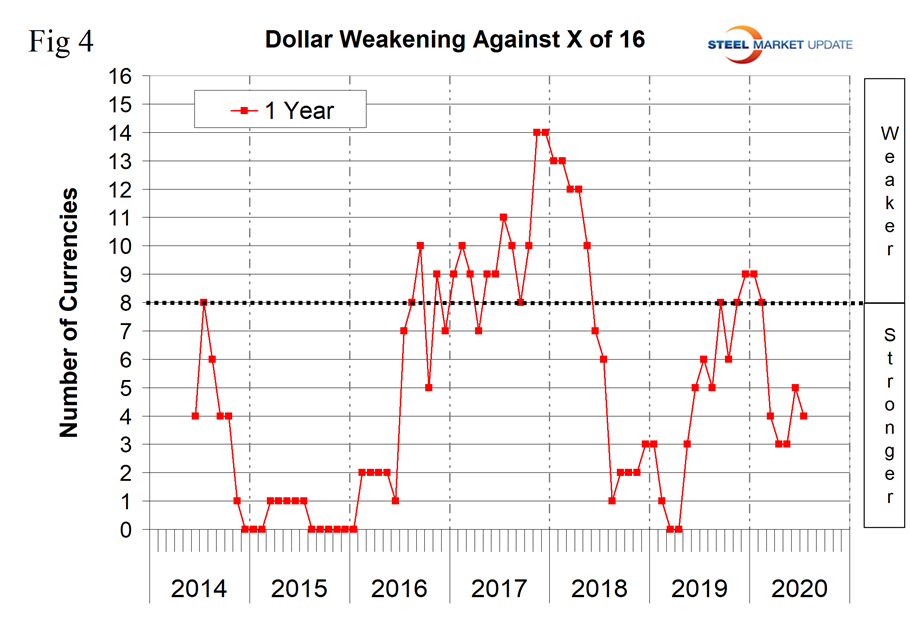
Figure 4 shows the 12-month picture, which removes some of the volatility by showing the number of currencies against which the dollar was weakening on a year-over-year basis. In March and April 2019, the dollar strengthened against all 16 at the 12-month level. There was a progressive weakening until December 2019 and January 2020 when the dollar weakened against nine of the 16. In the 12 months leading up to mid-July 2020, another reversal had occurred by which time the dollar was weakening against four. A strengthening dollar puts downward pressure on globally traded raw materials prices.
The biggest changes in the last month were the Australian dollar, up by 9.3 percent, the South African rand, up by 8.4 percent, and the euro and the Mexican peso, both up by 4.1 percent. The only losers were the Brazilian real, down by 3.8 percent and the Turkish lira, down by 1 percent. (See below for details of data sources.)
Our files contain charts of the history of the value of all 16 steel trading nation graphs and are available on request.
Explanation of Data Sources: The Broad Index is published by the Federal Reserve on both a daily and monthly basis. It is a weighted average of the foreign exchange values of the U.S. dollar against the currencies of a large group of major U.S. trading partners. The index weights, which change over time, are derived from U.S. export shares and from U.S. and foreign import shares. The data are noon buying rates in New York for cable transfers payable in the listed currencies. At SMU, we use the historical exchange rates published in the Oanda Forex trading platform to track the currency value of the U.S. dollar against that of 16 steel trading nations. Oanda operates within the guidelines of six major regulatory authorities around the world and provides access to over 70 currency pairs. Approximately $4 trillion U.S. dollars are traded every day on foreign exchange markets.


