

Market Data

July 16, 2020
Currency Update for Steel Trading Nations
Written by Peter Wright
The U.S. dollar weakened against 14 of the 16 steel and raw materials trading nation currencies in the last 90 days, which follows the same decline that we reported July 14. The biggest changes were in the value of the Australian dollar, which was up by 11.4 percent, following a 9.3 percent appreciation in our last report. The euro was up by 9.5 percent and the Mexican peso by 9.0 percent. The only currencies to decline against the dollar in the last three months were the Turkish lira and the Ukrainian hryvnia.
![]()
Andrew Hecht of the Hecht Commodity Report wrote Aug. 16: “The potential for a substantial shift in the political landscape in the world’s wealthiest nation creates uncertainty that could continue to weigh on the value of the U.S. currency. At the same time, the U.S. central bank has addressed the global pandemic with unprecedented liquidity and stimulus. Quantitative easing and other monetary policy tools have caused interest rates to decline further along the yield curve. The vast interest rate gap between the dollar and the euro of past years has evaporated to only 50 basis points. The vast yield difference had supported the value of the dollar. The decline has made the euro a lot more attractive as a reserve currency compared to the U.S. dollar. A combination of interest rate trends and the U.S. election creates an almost perfect bearish storm for the dollar for the coming months. Currency markets tend to trend for long periods. The dollar is the benchmark pricing mechanism for most commodities. A falling dollar tends to cause raw material prices to rise. The descent of the dollar has significant ramifications for commodities and markets across all asset classes. The break below a critical resistance level could mean that the U.S. currency will continue to decline for the foreseeable future.”
Steel Market Update tracks the currencies of the 16 pre-eminent global steel and iron ore trading nations on a daily basis and reports monthly. The currencies of these 16 don’t necessarily follow the Broad Index value of the U.S dollar, but in the last three months have done so in direction, although the percentage change of the 16 has been much greater. The latest value of the Broad Index as published by the Federal Reserve was Aug. 7 on which date the dollar was down by 1.3 percent in three months and by 0.4 percent in 30 days. Our country data from Oanda was current as of Aug 15.
Figure 1 plots the daily Broad Index (BI) value of the U.S. dollar since 2013. The BI has declined by 6.7 percent since March 23, 2020.
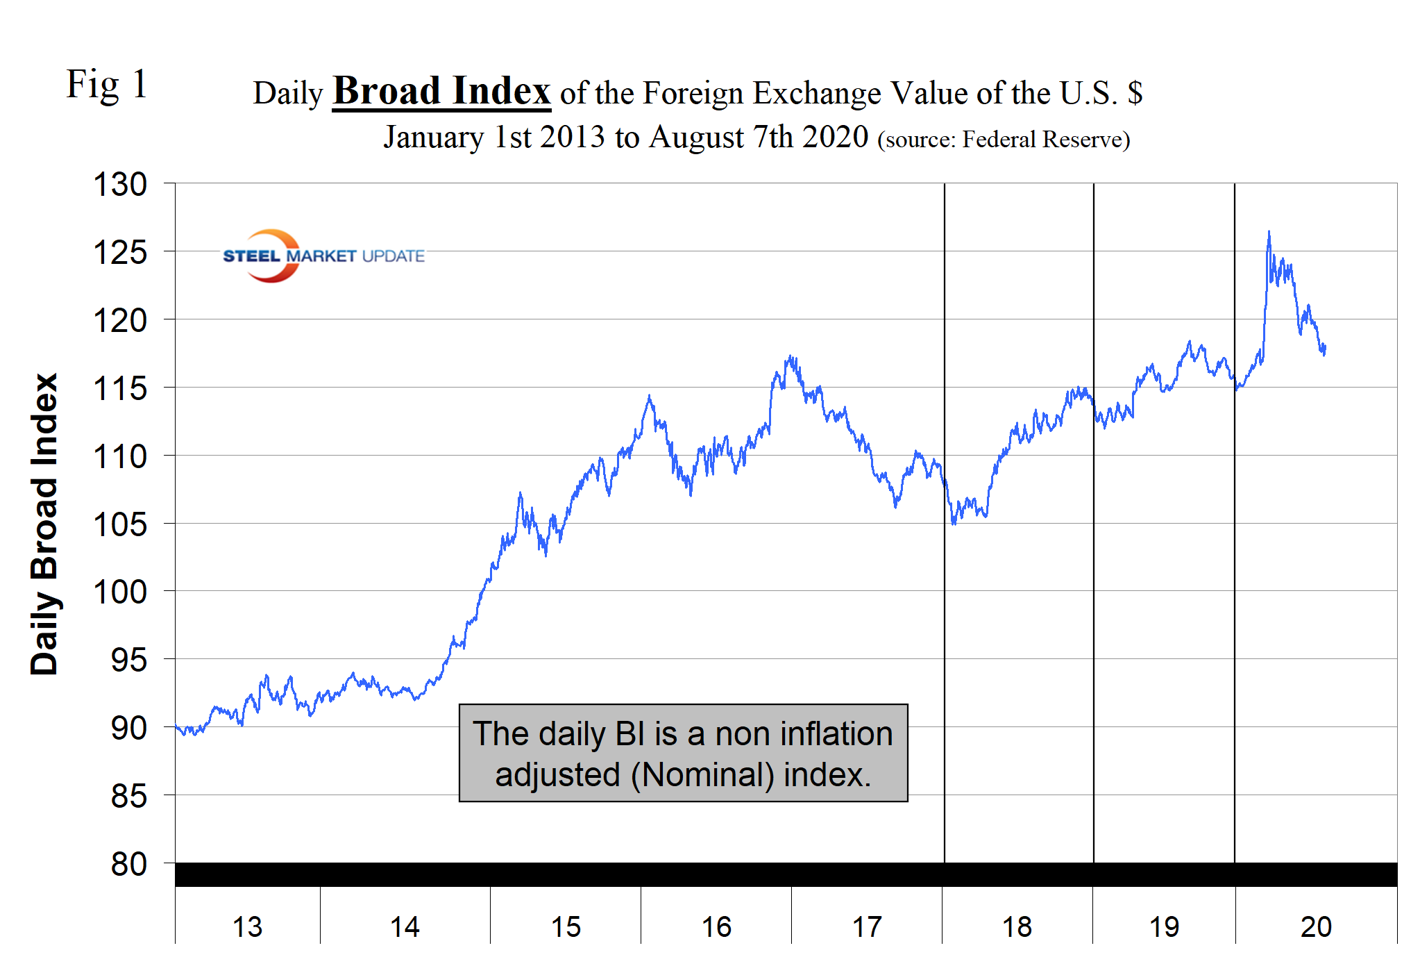
Table 1 shows the number of currency units that it takes to buy one U.S. dollar and the percentage change in the last year, three months, one month and seven days. The overall picture for the steel trading nations is that in three months prior to April 13, the dollar strengthened against 14 of the 16; in this current report of Aug. 15 it weakened against 14 of the 16. Table 1 is color coded to indicate weakening of the dollar in green and strengthening in red. We regard strengthening of the U.S. dollar as negative and weakening as positive because of the effect on net imports. Figures 2 show the extreme gyrations that have occurred at the three-month and one-month levels in the last four and a half years.
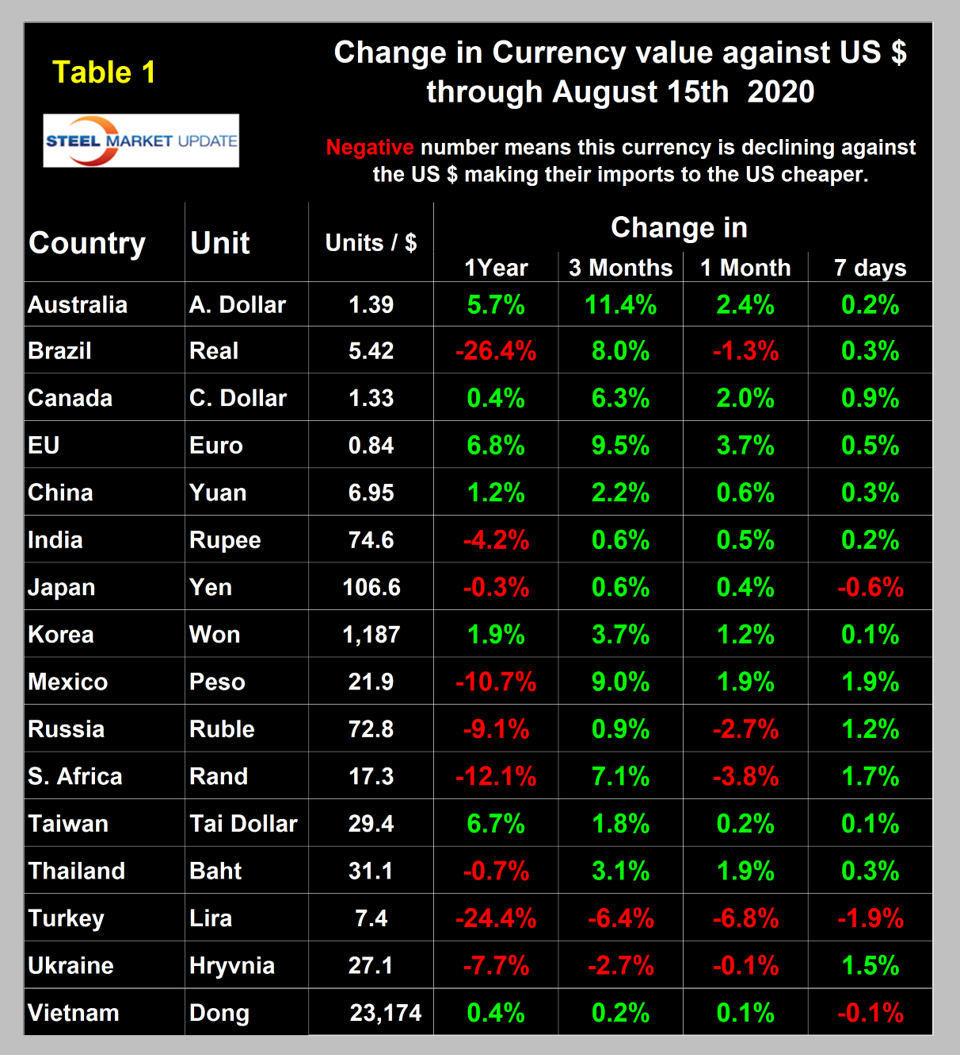
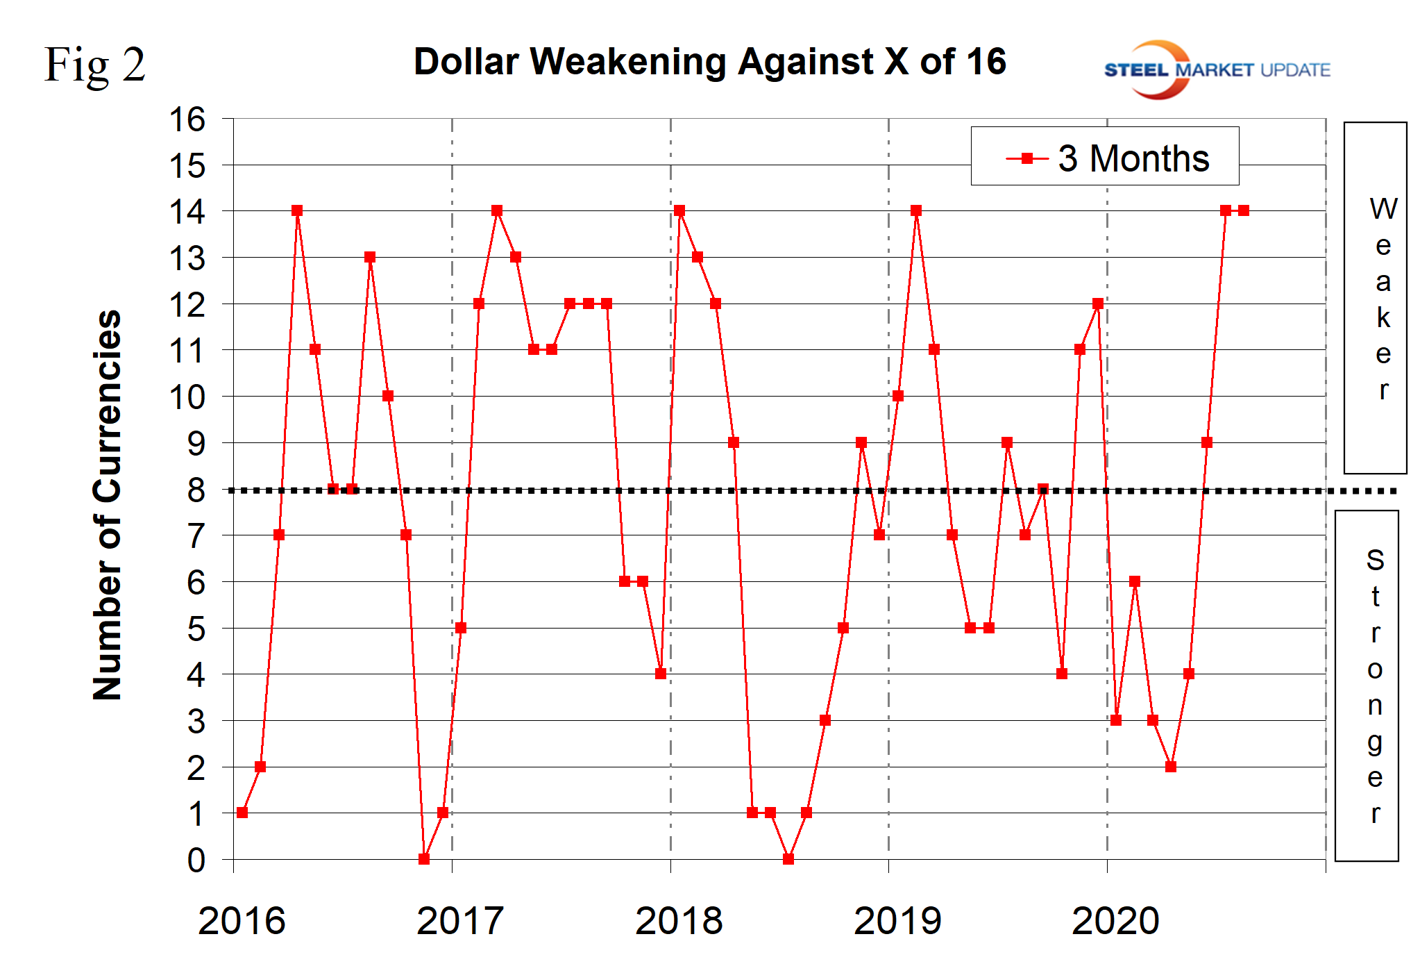
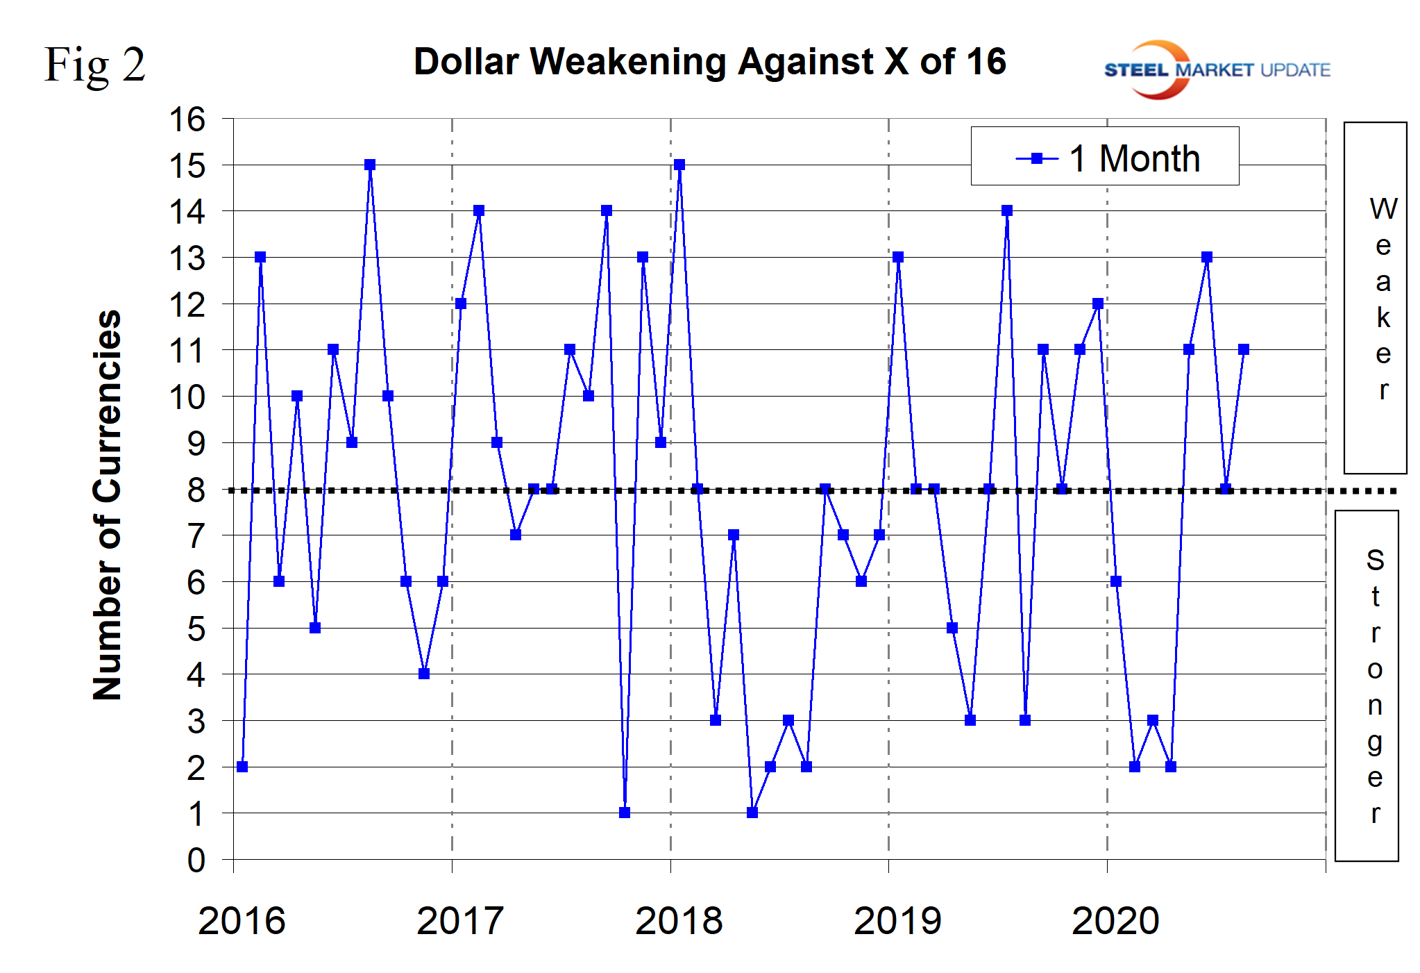
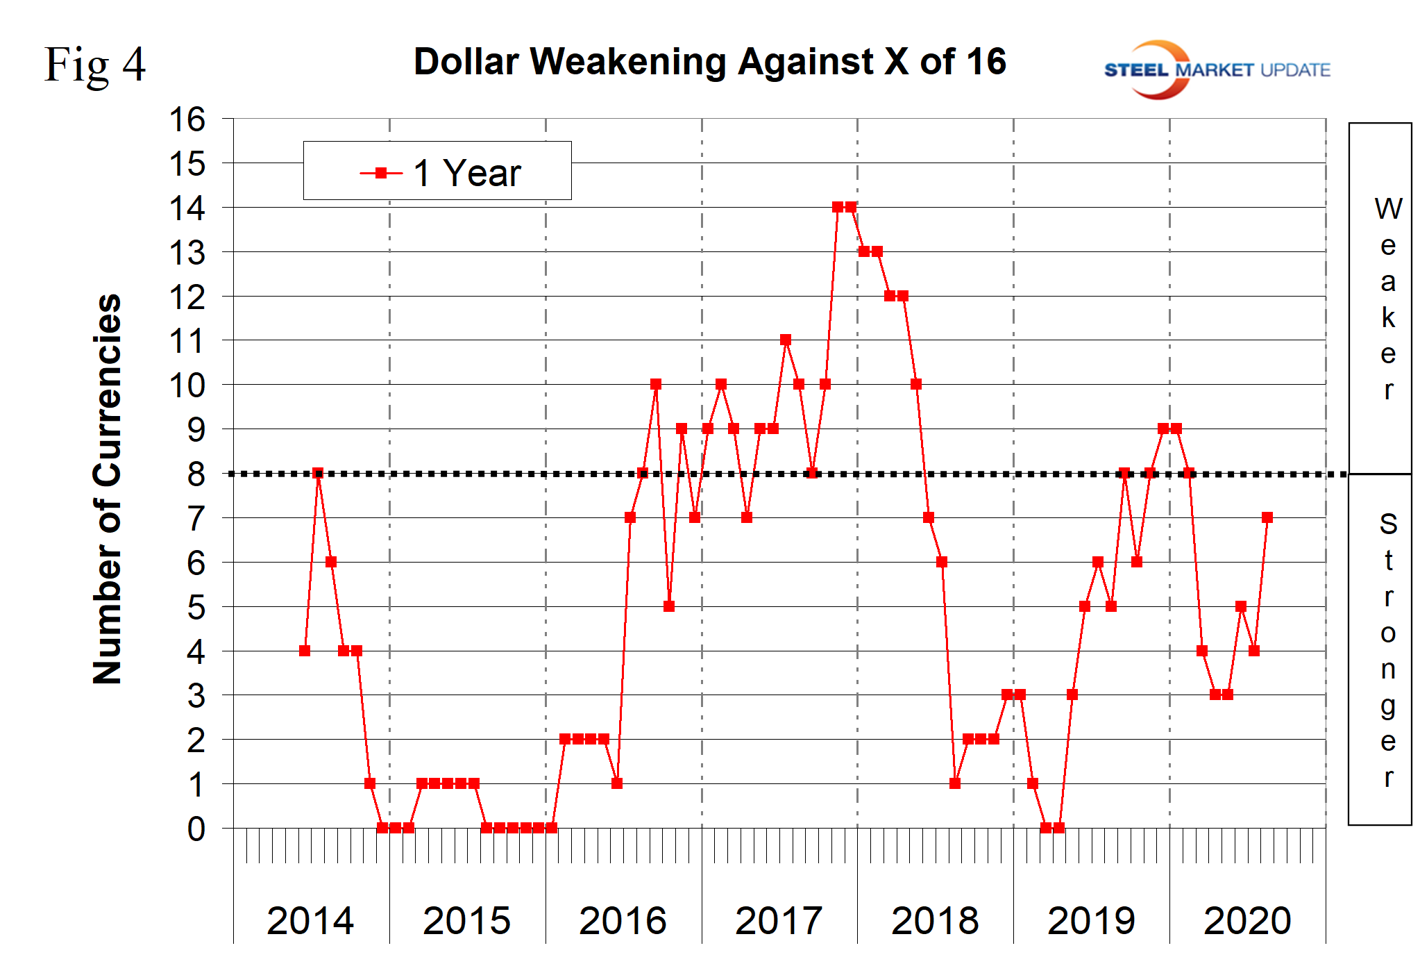
Figure 4 shows the 12-month picture, which removes some of the volatility by showing the number of currencies against which the dollar was weakening on a year-over-year basis. In March and April 2019, the dollar strengthened against all 16 at the 12-month level. There was a progressive weakening until December 2019 and January 2020 when the dollar weakened against nine of the 16. In the 12 months leading up to mid-August 2020 the dollar weakened against seven of the 16. A weakening dollar puts upward pressure on globally traded commodity prices including most steelmaking raw materials.
Our files contain charts of the history of the value of all 16 steel trading nation graphs and are available on request.
Explanation of data sources: The Broad Index is published by the Federal Reserve on both a daily and monthly basis. It is a weighted average of the foreign exchange values of the U.S. dollar against the currencies of a large group of major U.S. trading partners. The index weights, which change over time, are derived from U.S. export shares and from U.S. and foreign import shares. The data are noon buying rates in New York for cable transfers payable in the listed currencies. At SMU we use the historical exchange rates published in the Oanda Forex trading platform to track the currency value of the U.S. dollar against that of 16 steel trading nations. Oanda operates within the guidelines of six major regulatory authorities around the world and provides access to over 70 currency pairs. Approximately $4 trillion U.S. dollars are traded every day on foreign exchange markets.


