

Market Data

August 11, 2020
Shipments and Supply of Steel Products Through June
Written by Peter Wright
Mill shipments and supply of sheet products began to turn around in June.
This analysis based on steel mill shipment data from the American Iron and Steel Institute (AISI) and import-export data from the U.S. Department of Commerce. The analysis summarizes total steel supply by product from 2008 through June 2020 and year-on-year changes. The supply data is a proxy for market demand, which does not take into consideration inventory changes in the supply chain. Our analysis compares domestic mill shipments with total supply to the market. It quantifies market direction by product and enables a side-by-side comparison of the degree to which imports have absorbed demand.
![]()
First, though, we will include here the summary of IMF United States Article IV Consultation-Press Release because it is probably the starkest analysis of the current economic situation that we’ve seen with implications for future steel demand: “The U.S. is in the midst of an unprecedented social and economic shock. The longest expansion in U.S. history has been derailed by the unanticipated advent of COVID-19. To preserve lives and support public health, it was necessary to put in place a broad-based shutdown of the U.S. economy in March. Despite the gradual easing of state lockdown restrictions and lifting of stay-at-home orders starting in late April, the collateral economic damage has been enormous. First, and foremost, as of Aug. 10, more than 160,000 Americans have tragically lost their lives and many more have become seriously ill. Almost 13 million Americans have lost their jobs, many small and large businesses are under financial stress, and future prospects are highly uncertain. Reopening decisions will have to be handled carefully to mitigate the economic costs while containing the ongoing rise in COVID-19 infection rates. It will likely take a prolonged period to repair the economy and to return activity to pre-pandemic levels. All in all, globally there will be difficult months and years ahead and it is of particular concern that the number of COVID-19 cases in the U.S. is still rising.”
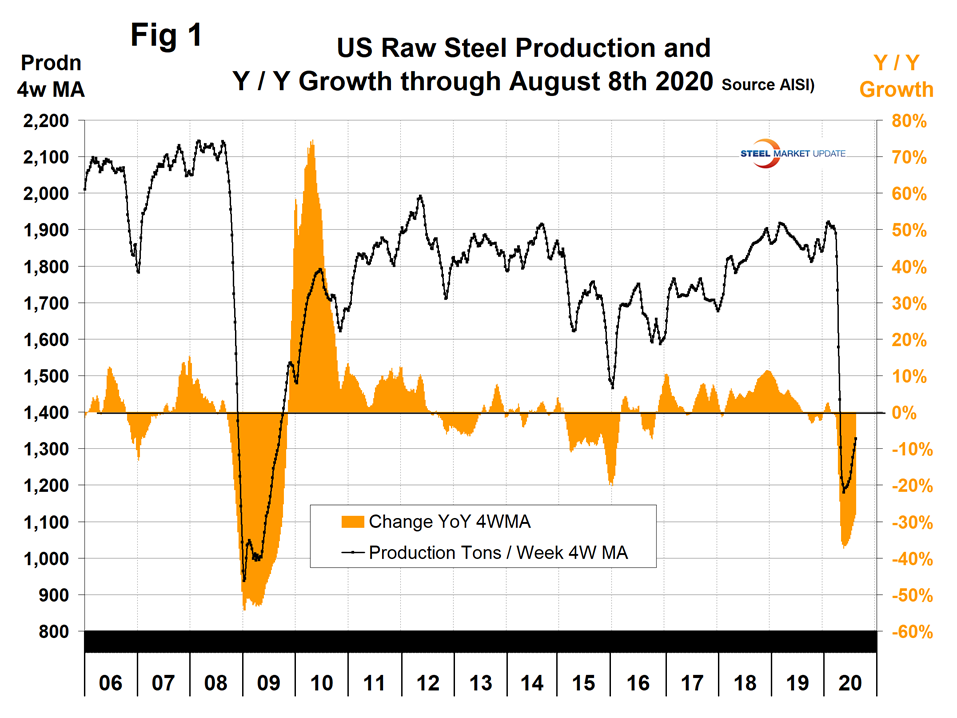
Figure 1 shows the abrupt decline in raw steel production that began in February and mirrors the rate of decline experienced in late 2008, though the total decline this time has not been as severe. The year-over-year decline in 2020 maxed out at 37.3 percent in the week ending May 16 and has since improved to negative 28.1 percent in the week ending Aug. 8. Back in 2009 the maximum rate of decline year over year was 54.3 percent in the week ending Jan. 17, 2009. These are four-week moving averages and are based on weekly data from the AISI.
The shipments and supply report that you are reading now is based on monthly shipments by product as reported by the AISI plus import and export data from the DoC. Figure 2 shows the monthly shipment data for all rolled steel products. In the long run the trajectories of growth in Figures 1 and 2 are comparable, but through the June three-month moving average of the monthly data, the improvement had not begun.
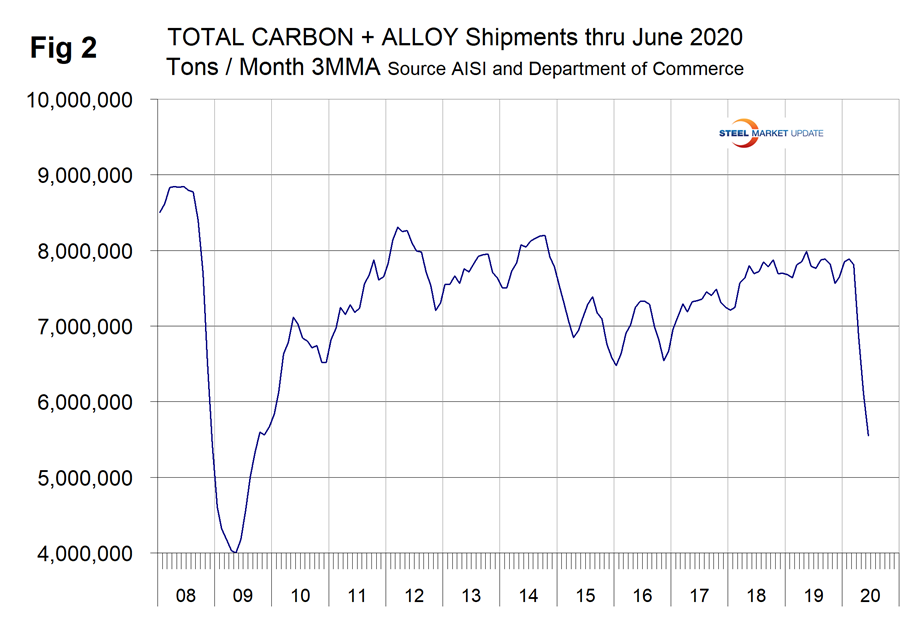
Table 1 is the shipment and supply situation for all product groups. Total supply (proxy for market demand) as a three-month moving average (3MMA) was down by 28.2 percent year over year. Apparent supply is defined as domestic mill shipments to domestic locations plus imports. Mill shipments were down by 28.8 percent meaning that imports took a slightly higher market share in the three months through June year over year. There is a big difference between products. Tubular products performed the worst, while sheet and plate products had the least severe decline. The supply of sheet products was down by 23.4 percent in three months through June year over year and domestic mill shipments were down by 25.8 percent. The total of coiled and discrete plate supply was down by 27.1 percent and shipments were down by 22.9 percent.
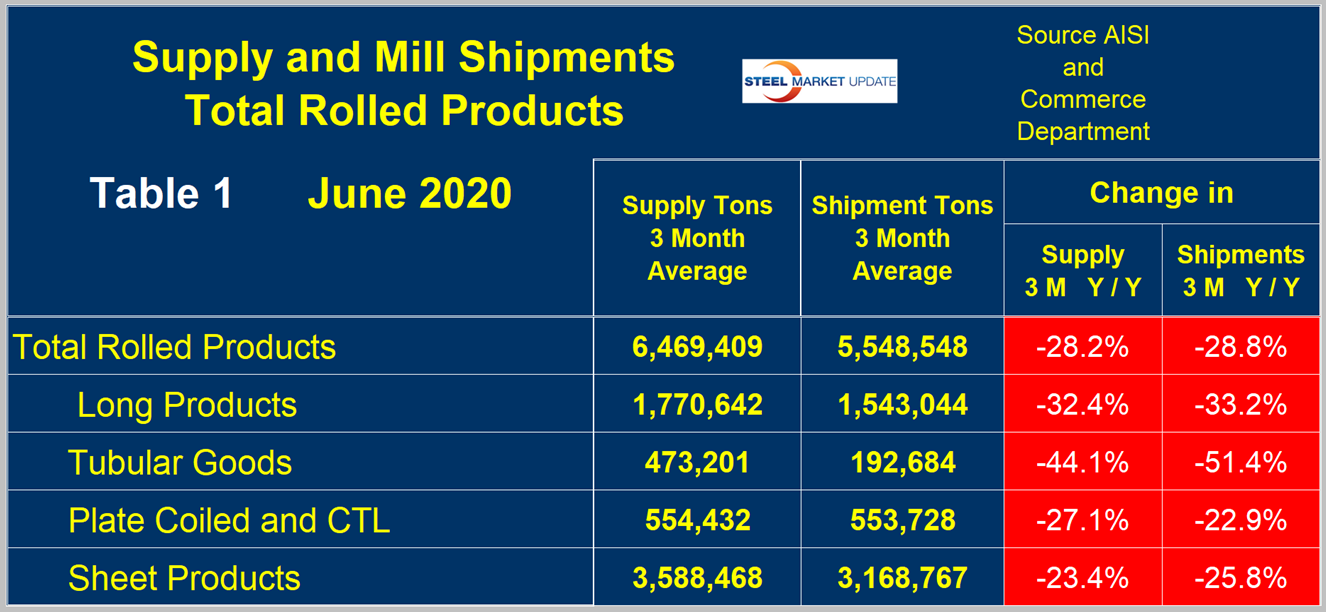
Table 2 describes both apparent supply and mill shipments of individual sheet products (shipments includes exports) side by side as three-month averages through June with year-over-year growth rates for each. Other metallic coated was down by far the least for both supply and shipments. Of the three major product groups, hot-dipped galvanized was down the most and hot rolled down the least. This was the case for both shipments and supply. In the three months through June 2020, the average monthly supply of sheet and strip was 3.588 million tons. There is no seasonal manipulation of any of these numbers. By definition, year over year comparisons have seasonality removed.
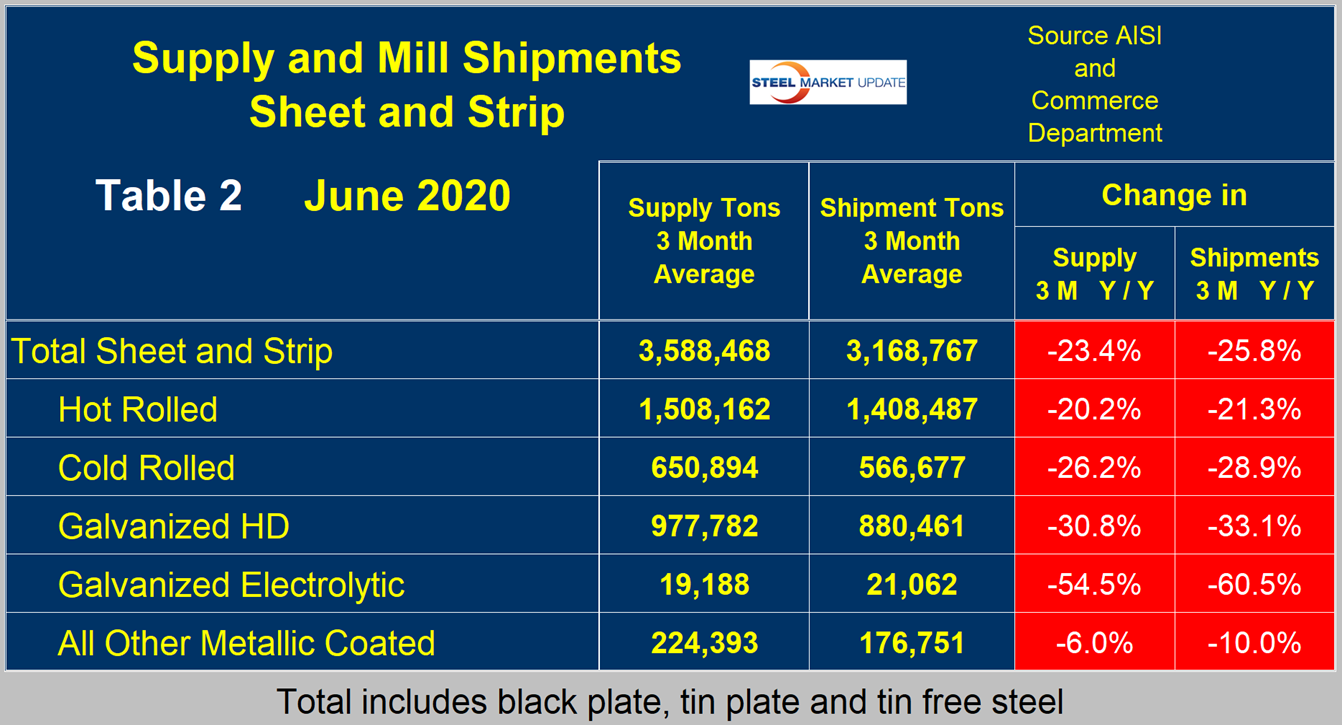
Table 3 shows that total sheet and strip products were down by 9.1 percent year to date compared to 2019. This number fails to recognize the severity of the second quarter of 2020. The two far right columns compare the second quarter with the first and the second quarter with Q2 2019, respectively.
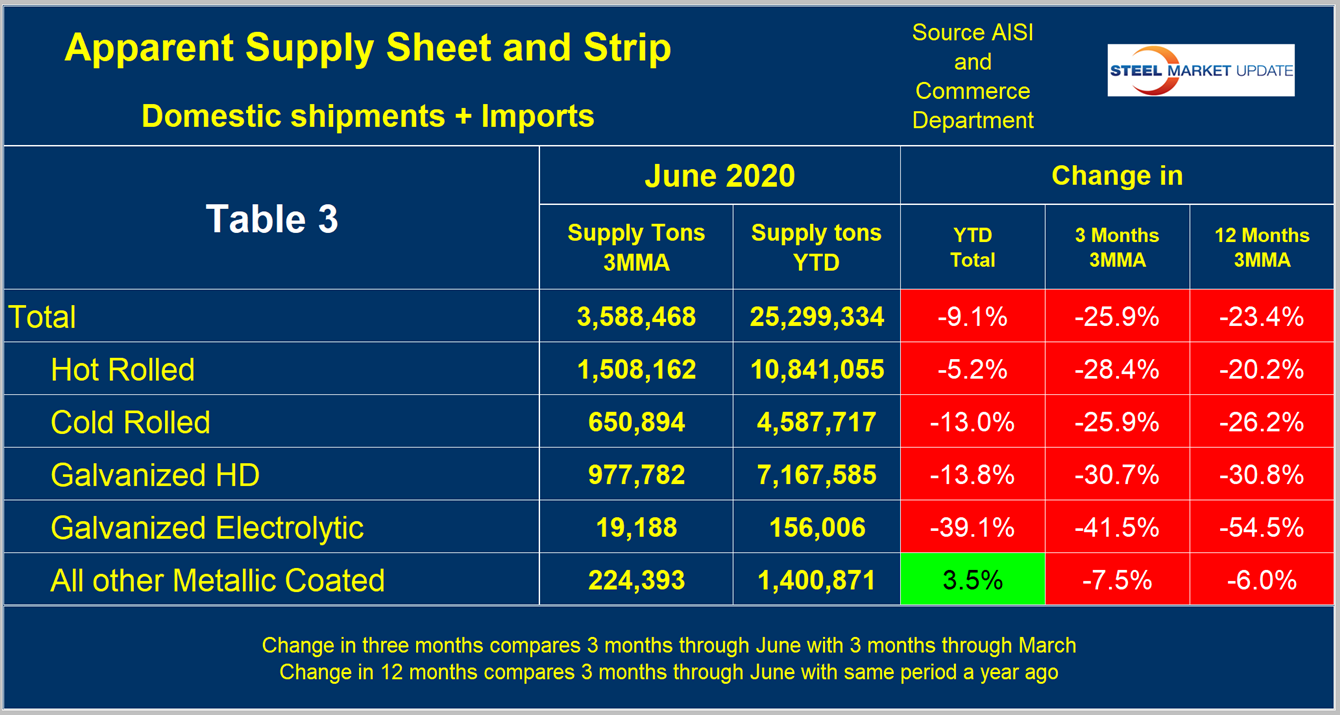
Figure 3 shows the long-term supply picture for the three major sheet and strip products—HRC, CRC and HDG—since June 2008 as three-month moving averages.
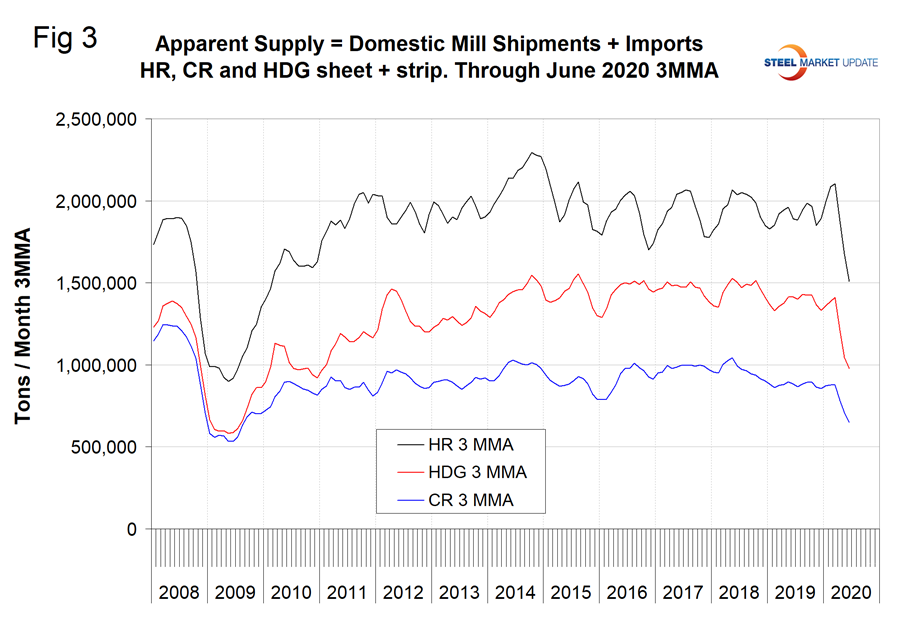
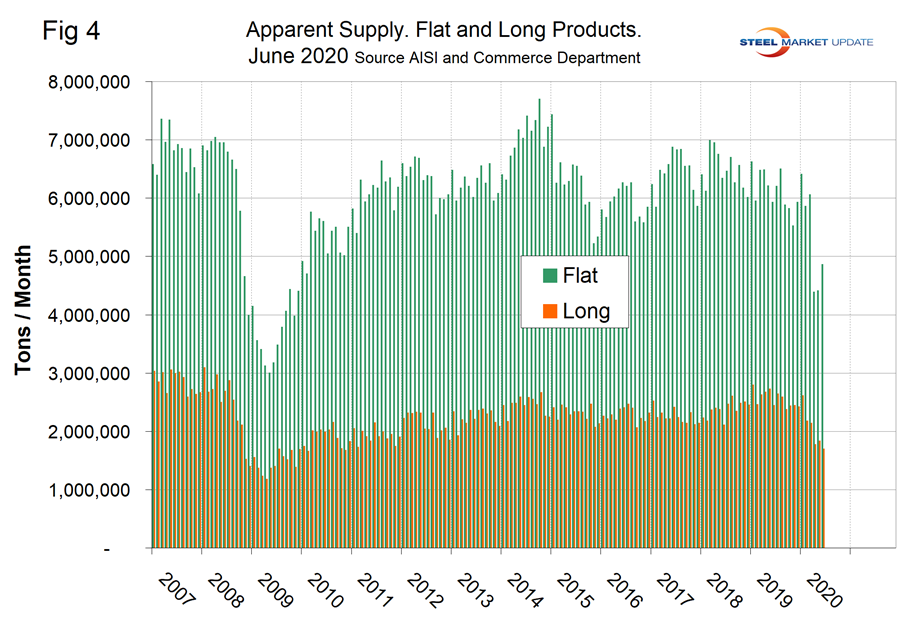
Figure 4 shows the long-term comparison between flat and long products. These are monthly numbers (not 3MMA), and clearly show the trend difference between longs and flat products including plate.
SMU Comment: The weekly numbers through Aug. 8 for crude steel production began to turn around in June. This analysis of monthly AISI data showed an uptick in the month of June that was obscured by the three-month average calculations used in this report. Comparing June to May, the supply of sheet products was up by 14.5 percent. Plate was up by 4.8 percent, longs were down by 7.2 percent, and tubular goods were down by 13.4 percent.


