

Market Data
August 31, 2020
Consumer Confidence Declines in August
Written by Peter Wright
The U.S. consumer’s confidence in the present situation has deteriorated drastically in response to the pandemic. The composite value of consumer confidence in August, reported by The Conference Board, was 84.8 with a three-month moving average (3MMA) of 91.6. The 3MMA has decreased from 130.4 in February. This indicator is quite volatile, therefore the moving average is used to reduce monthly variability.
“Consumer Confidence declined in August for the second consecutive month,” said Lynn Franco, Senior Director of Economic Indicators for The Conference Board. “The Present Situation Index decreased sharply, with consumers stating that both business and employment conditions had deteriorated over the past month. Consumers’ optimism about the short-term outlook, and their financial prospects, also declined and continues on a downward path. Consumer spending has rebounded in recent months, but increasing concerns amongst consumers about the economic outlook and their financial well-being will likely cause spending to cool in the months ahead.”
The composite index is made up of two sub-indexes: the consumer’s view of the present situation and his or her expectations for the future. The 3MMA of the consumer’s view of the present situation dropped from 171.2 in February to 76.0 in June and recovered to 93.2 in August. Expectations were less dramatically affected by the pandemic and declined from 103.2 in February to 93.4 in August, also on a 3MMA basis. Figure 1 shows the trend lines of both subcomponents. The view of the present situation has collapsed below trend, but expectations not so much. Expectations have been declining since November 2018 (Figure 1).
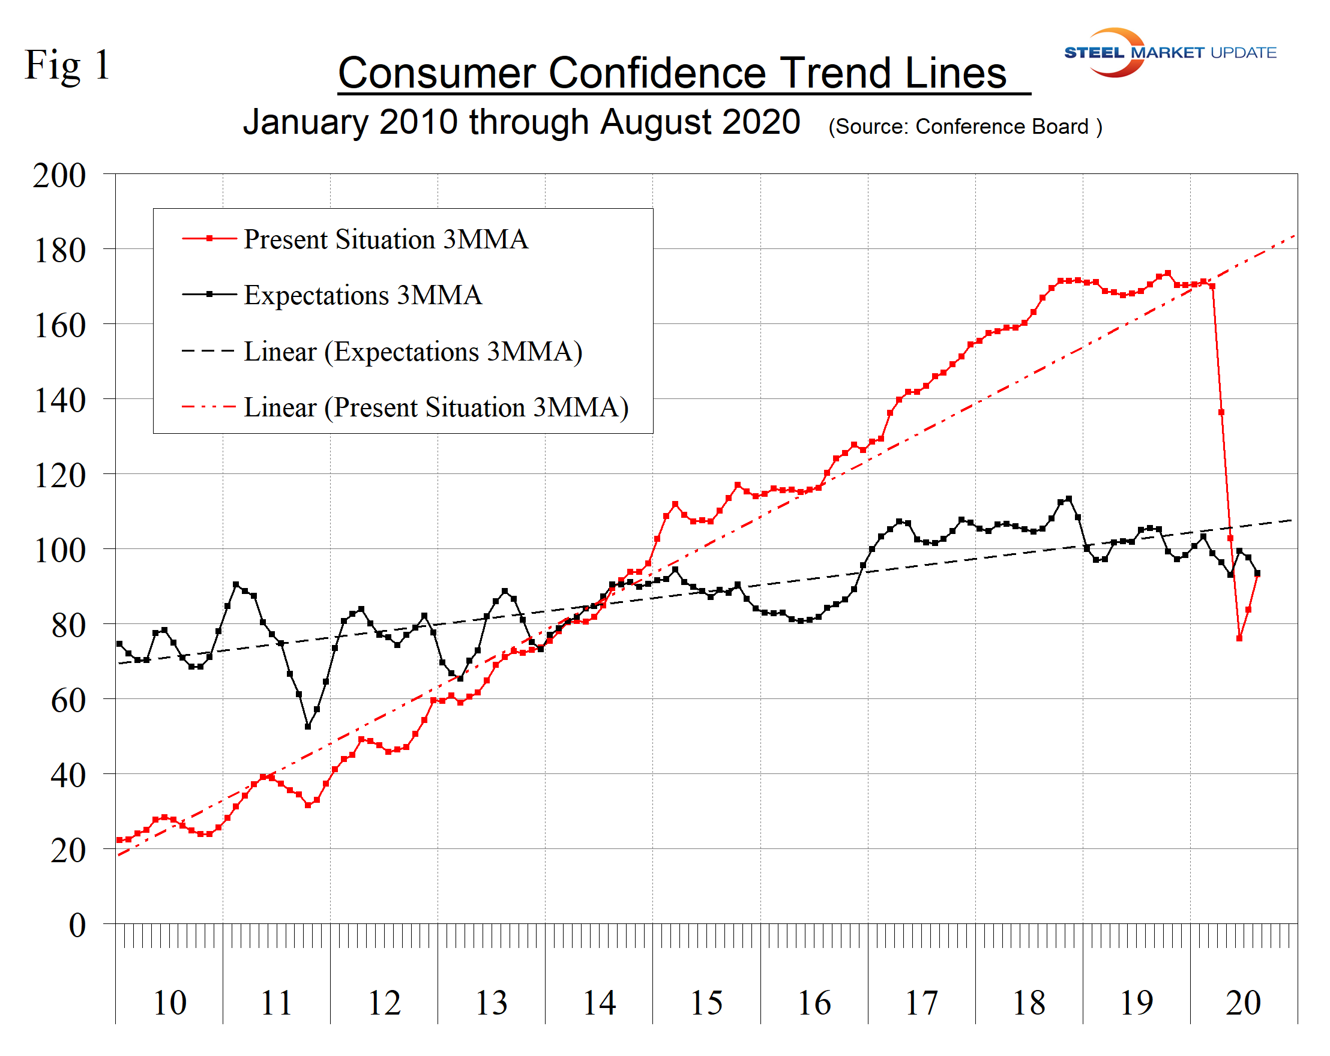
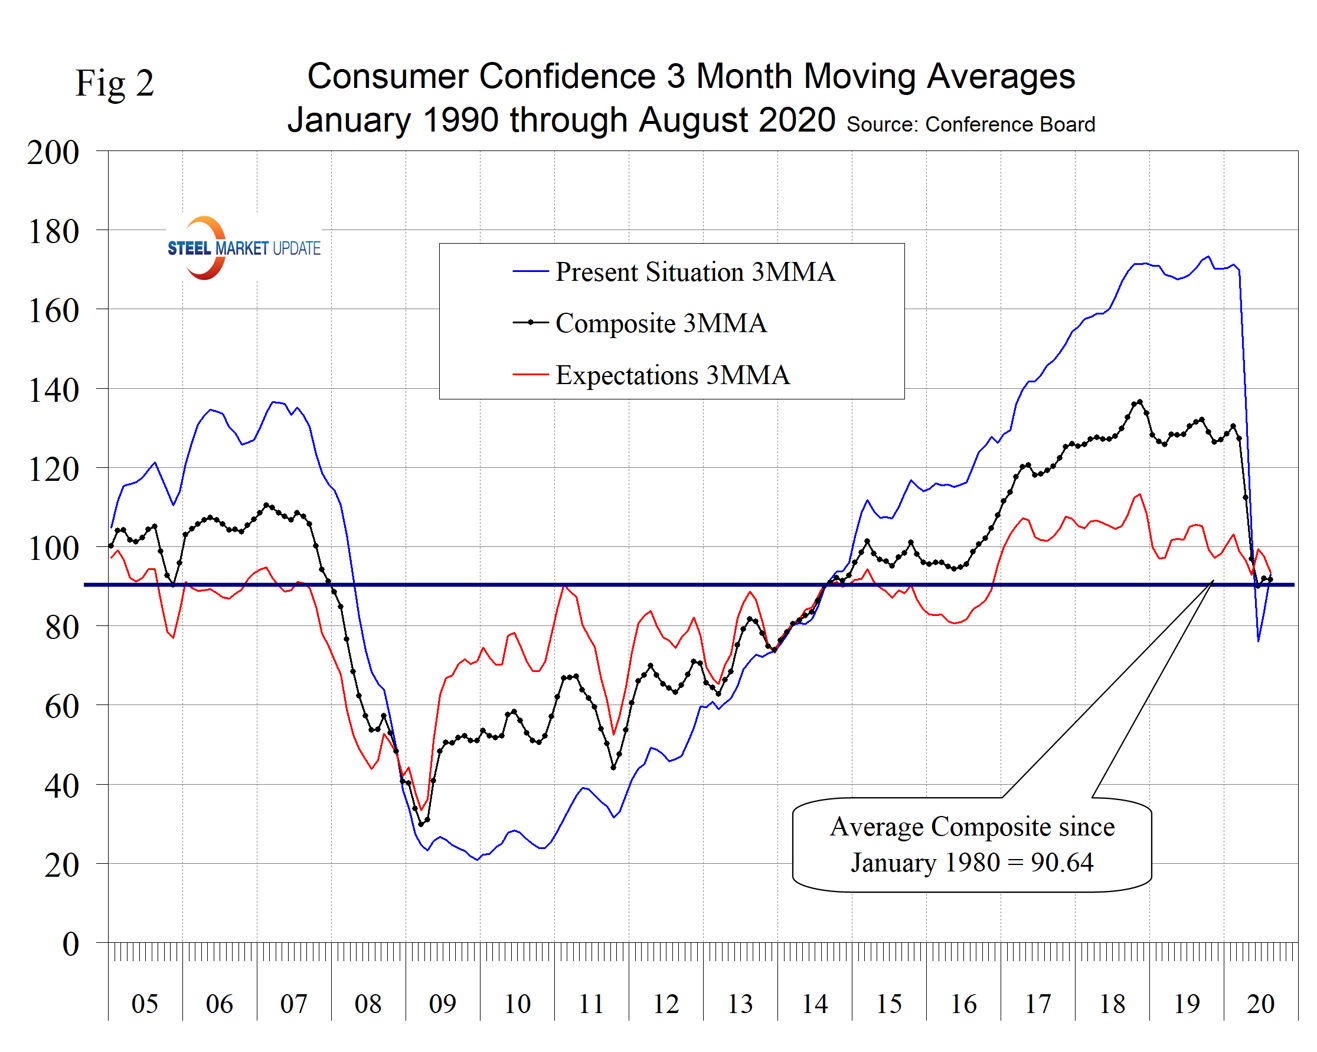
Figure 2 shows the 3MMA of the composite, the view of the present situation and expectations.
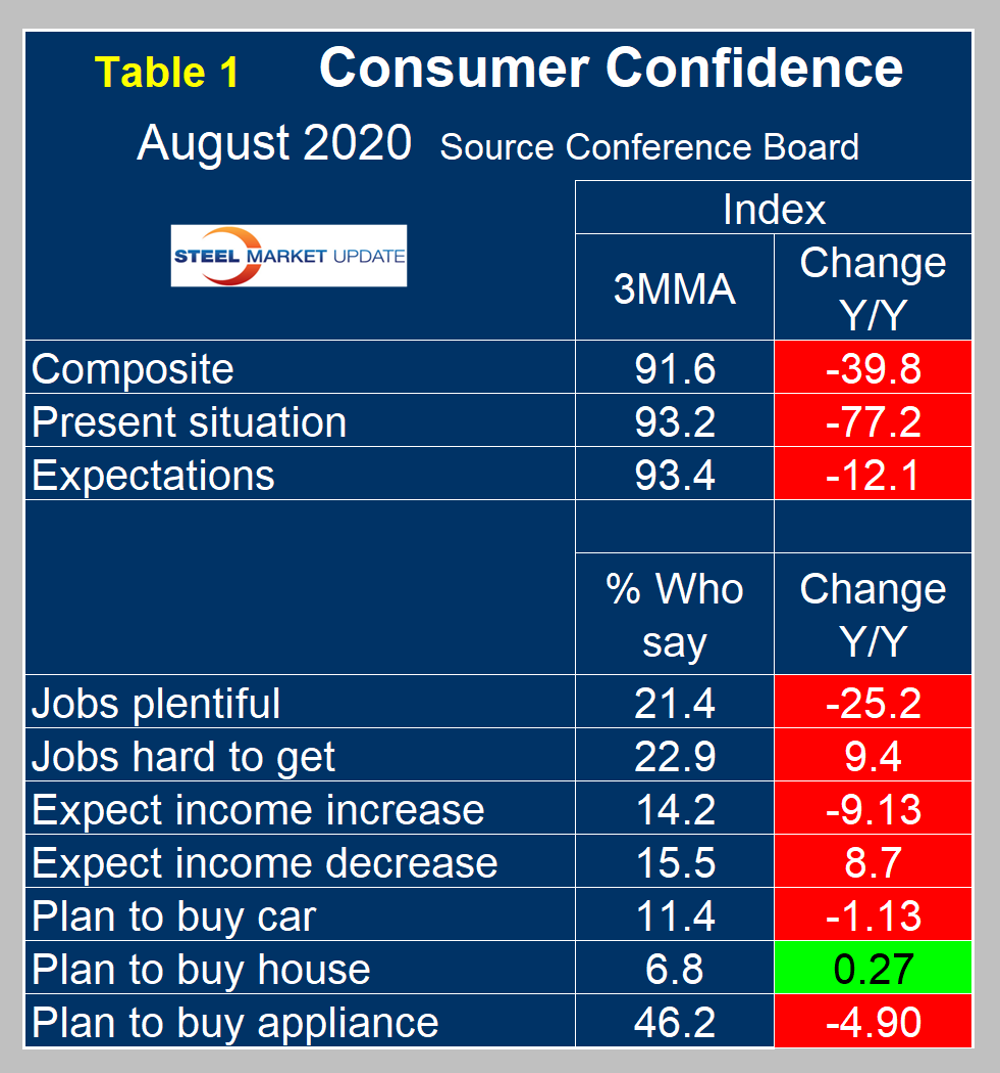
On a 3MMA basis comparing August 2020 with August 2019, the present situation was down by 77.2 points and expectations were down 12.1 points (Table 1). The consumer confidence report also includes both employment data and some purchase plans and these are summarized in Table 1. The color codes show improvement or deterioration of the individual components.
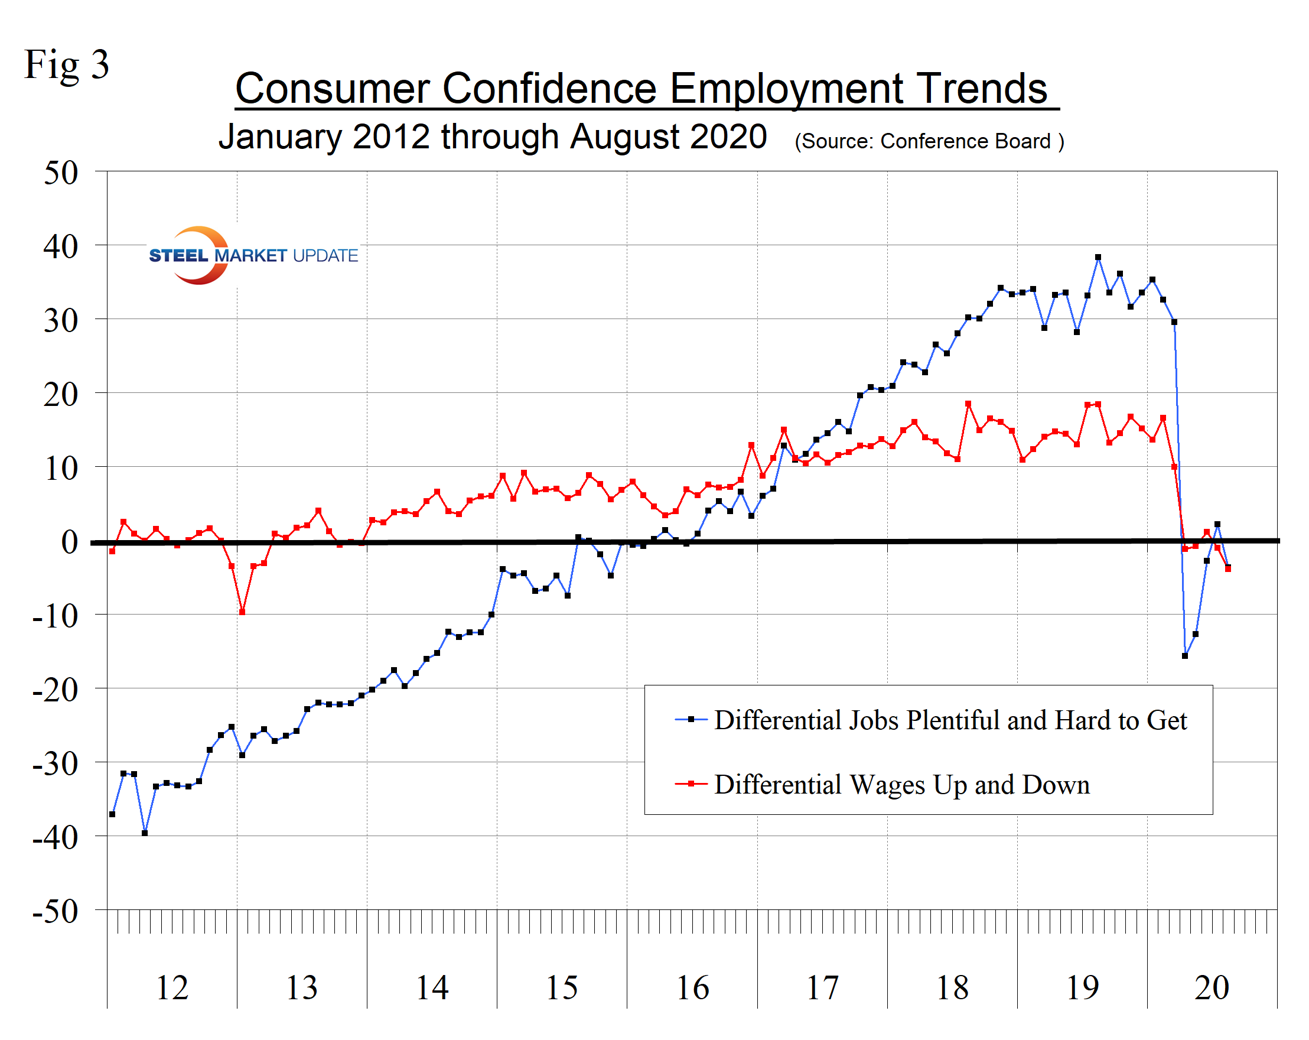
In October last year, the differential between those finding jobs plentiful and those having difficulty was positive 36.1, but that fell to negative 15.7 in April and improved to negative 3.7 in August. Expectations for future wage change were similarly affected. In August last year, the differential was positive 18.4 and in August this year was negative 3.9.
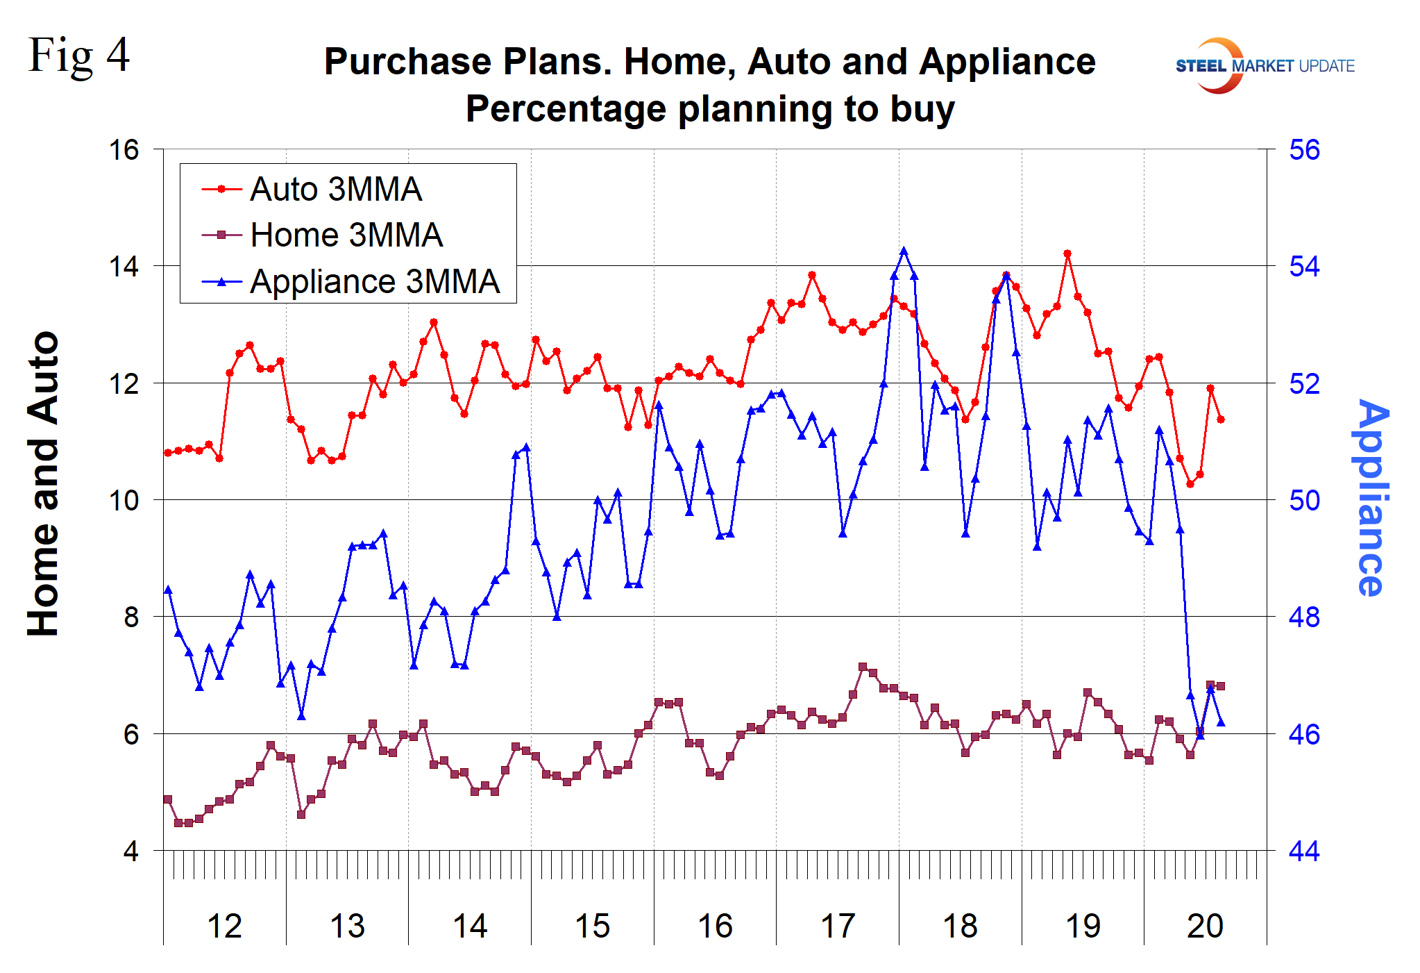
Spending plans for consumer goods as measured by automobiles and appliances have deteriorated this year, but housing is still buoyant (Figure 4).
SMU Comment: It seems that consumers have dug in for the long haul in terms of the pandemic and their immediate prospects. This will negatively affect the recovery in steel demand, which is dependent on the growth of GDP and consumers’ willingness to spend. Consumer confidence should be treated as a leading indicator in steel industry corporate planning.
About The Conference Board: The Conference Board is a global, independent business membership and research association working in the public interest. The monthly Consumer Confidence Survey®, based on a probability-design random sample, is conducted for The Conference Board by Nielsen. The index is based on 1985 = 100. The composite value of consumer confidence combines the view of the present situation and of expectations for the next six months.


