Premium

September 11, 2020
SIMA: Steel Import License Data for September
Written by Peter Wright
Steel Market Update is pleased to share this Premium content with Executive members. The information below is excerpted from the full article, which is available to Premium subscribers on SMU’s website. For information on upgrading to a Premium-level subscription, email Info@SteelMarketUpdate.com.
Total rolled product imports in September were down by 28.7 percent on a three-month moving average (3MMA) basis year over year. This was the 11th consecutive month in which imports were down by more than 20 percent compared to the same month last year.
This early look at September’s import volume is based on data from the Steel Import Monitoring and Analysis (SIMA) system of the Department of Commerce. This excerpt covers steel sheet and plate (see the full article for additional data on long and tubular products). All volumes in this analysis are reported in short tons. Three-month moving averages are used rather than single-month results to smooth out monthly variability.
Imports of total carbon and low alloy rolled products in September totaled 1.091 million tons on a single-month basis, down from 1.562 million tons in January, which was the high month for the year. Year over year on a 3MMA basis, sheet products were down by 12.3 percent and plate products were down by 43.4 percent.
Figure 1 shows the total tonnage of rolled steel and semifinished imports through September on a 3MMA basis. Due to quota opening and closing times there is a wide cyclicality within each quarter in the monthly volume of semifinished, which is masked by the 3MMA calculation. October will be the next surge month. Recent imports of semifinished have ranged from a high of 1.5 million tons in January 2020 to a low of 69,000 tons in June 2020. The licensed volume of semis in September was 314,000 tons. Total rolled product volume has been on an erratically downward trend since July 2017.
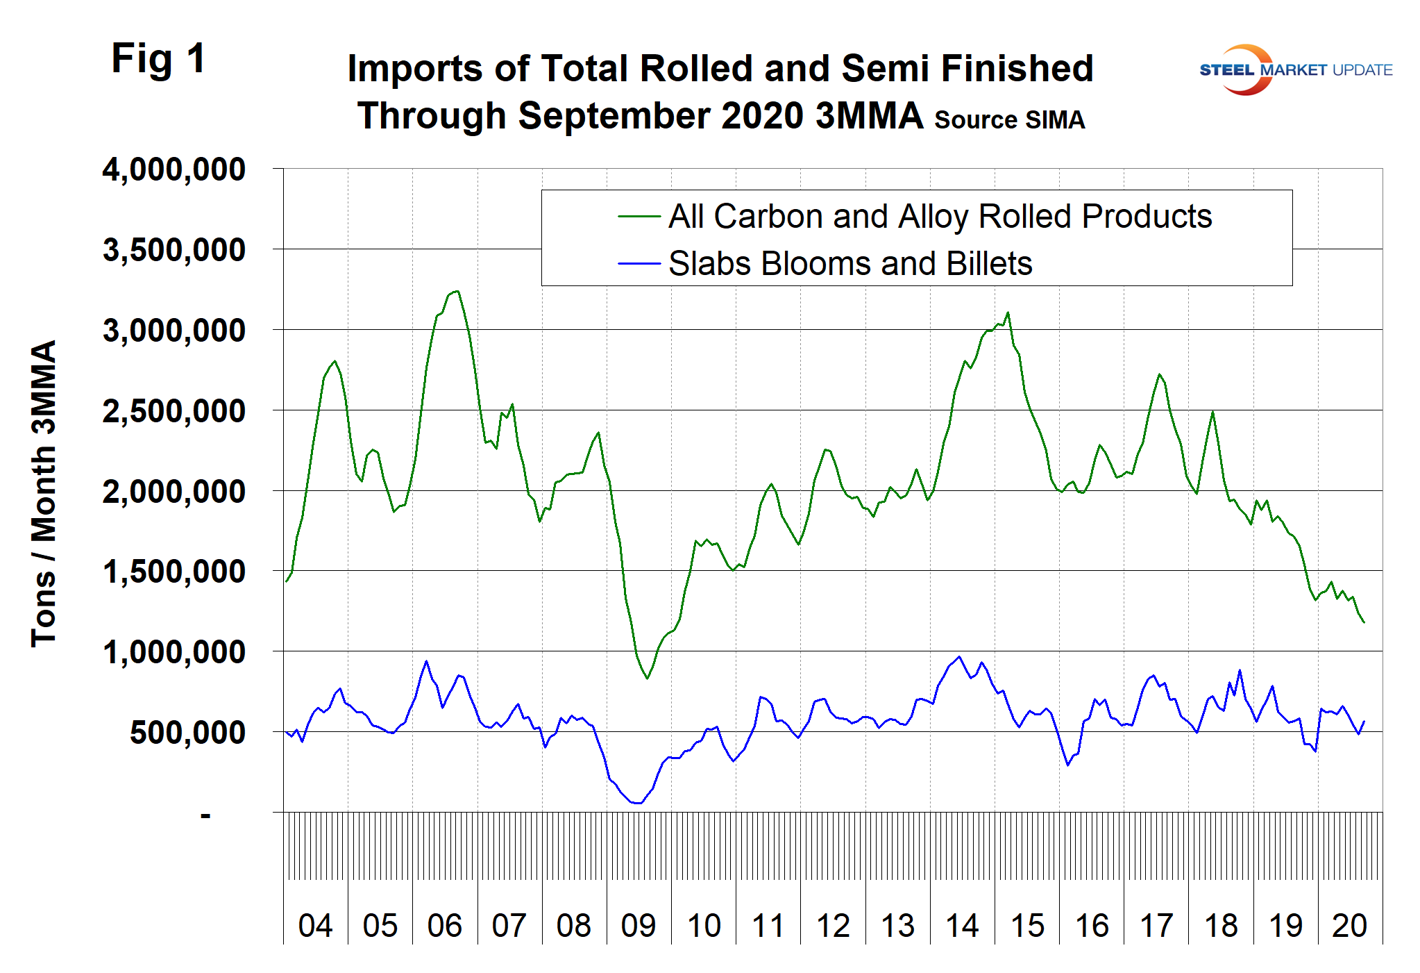
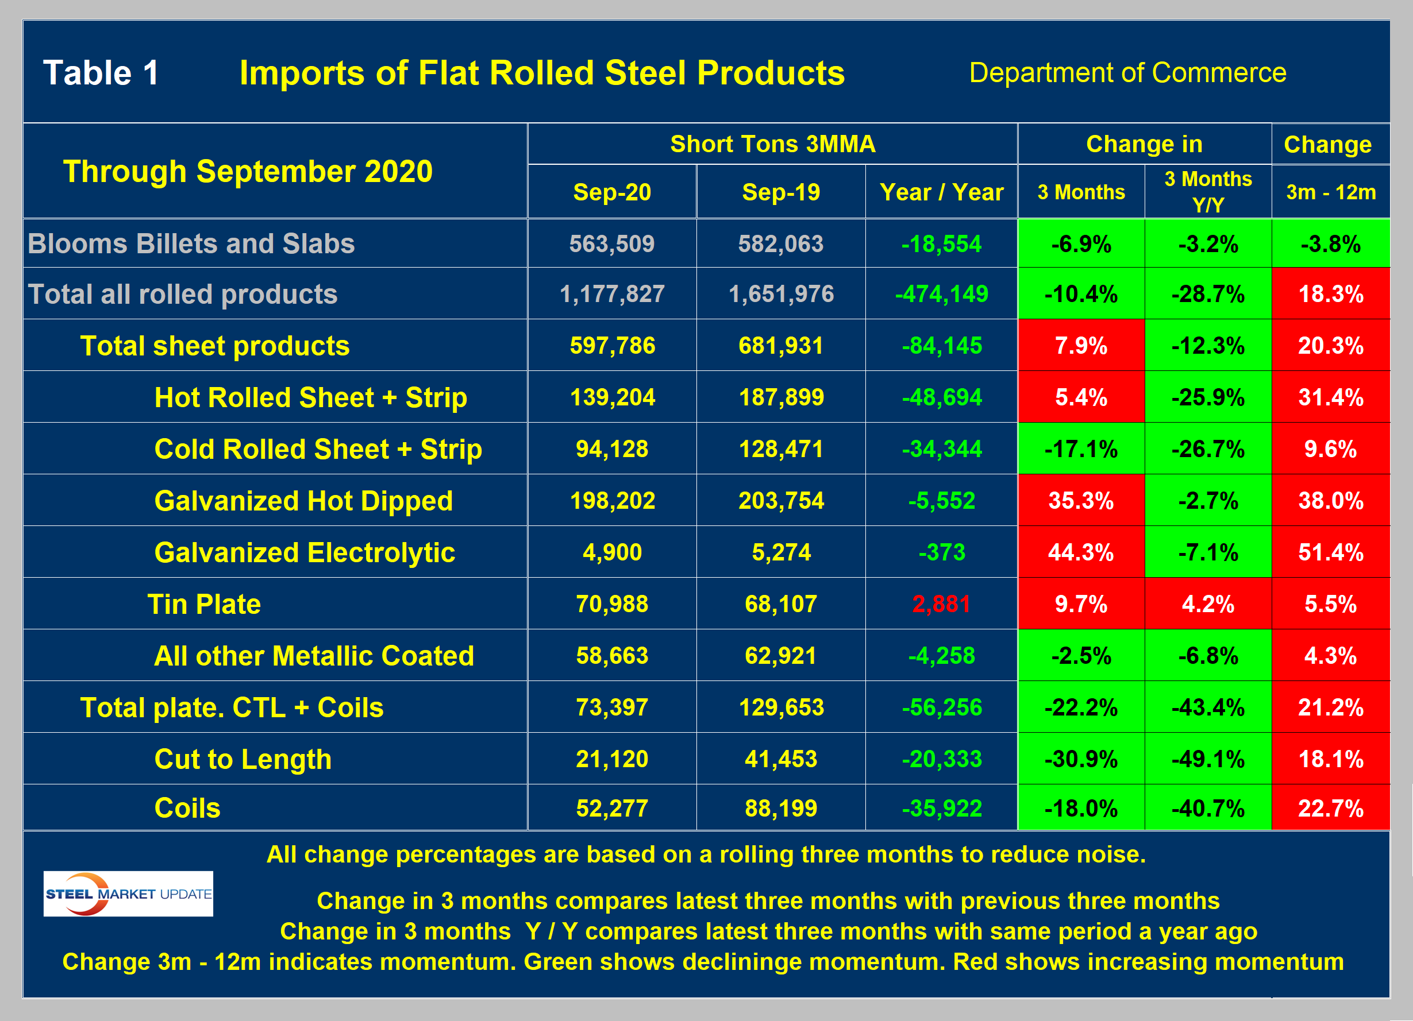
Table 1 below shows the 3MMA of the tonnage in September 2020 and September 2019 with the year-over-year change. We then calculate the percentage change in volume in the most recent three months with the previous three months. This month we are comparing July through September with April through June (3M/3M). The next column to the right shows the year-over-year change as a percentage. Declines are color coded green and increases are coded red. Finally, in the far-right column, we subtract the 12-month change from the three-month change. This is a way of describing the recent momentum as a percentage. It is not unusual for the color code of the momentum to be the opposite of the year-over-year time frame analyses as it was in September.
Table 1 describes the imports of all major sectors of the sheet and plate markets. In the flat rolled sectors shown in Table 1, total sheet products were down by 12.3 percent and total plate products were down by 43.4 percent, both year over year. All individual products except tin plate in the sheet and plate groups were down year over year. The uncoated sheet products, HR and CR, were down 25.9 and 26.7 percent, respectively. The coated products were all down by single digits. In the plate sector, cut to length was down by 49.1 percent and coiled was down by 40.7 percent.
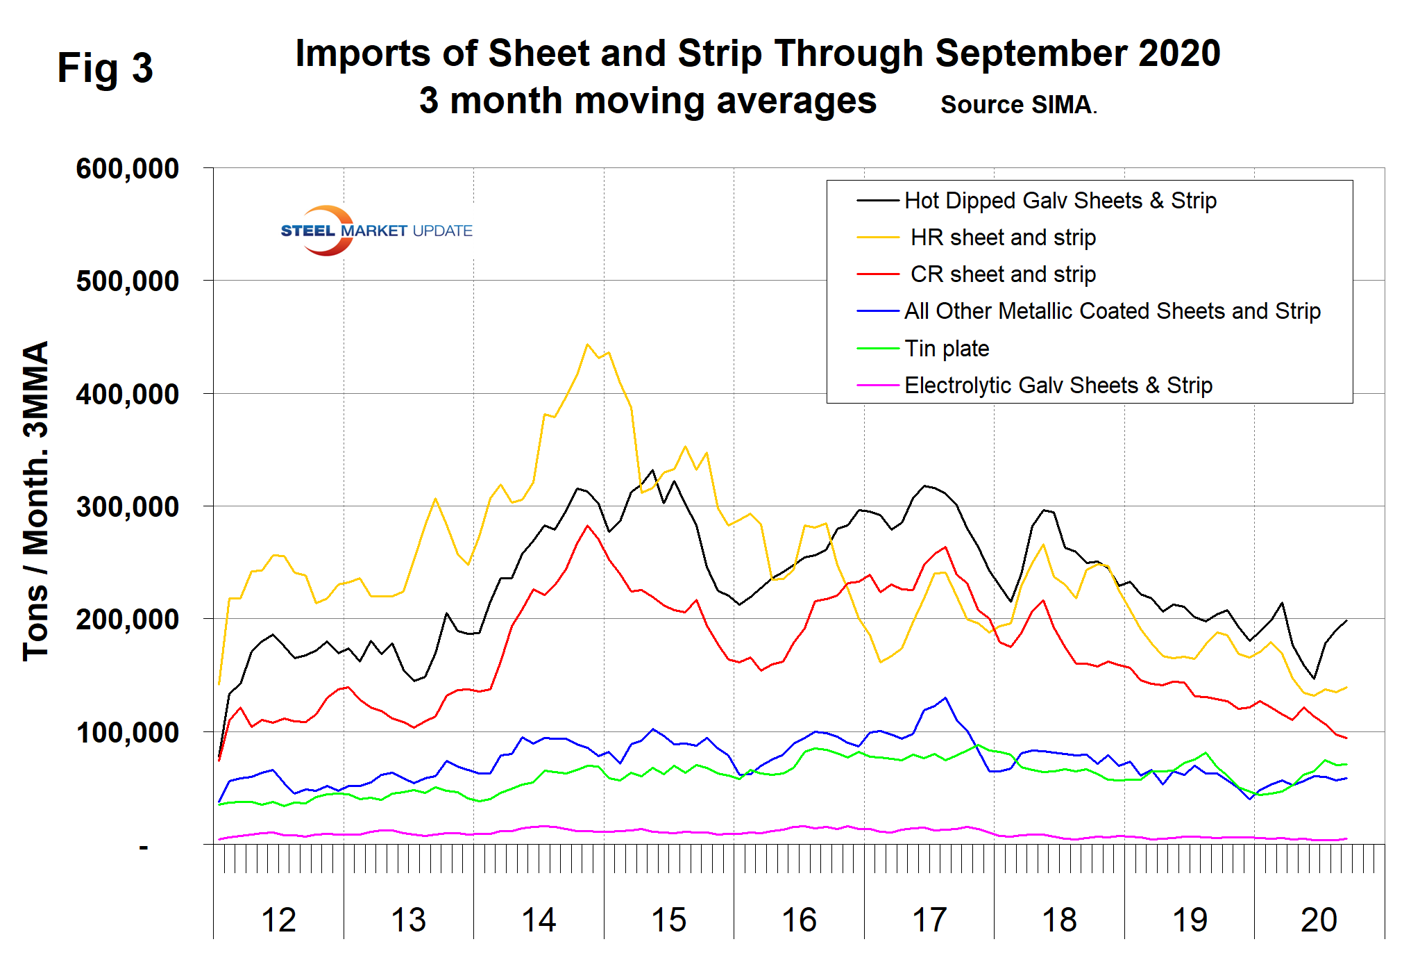
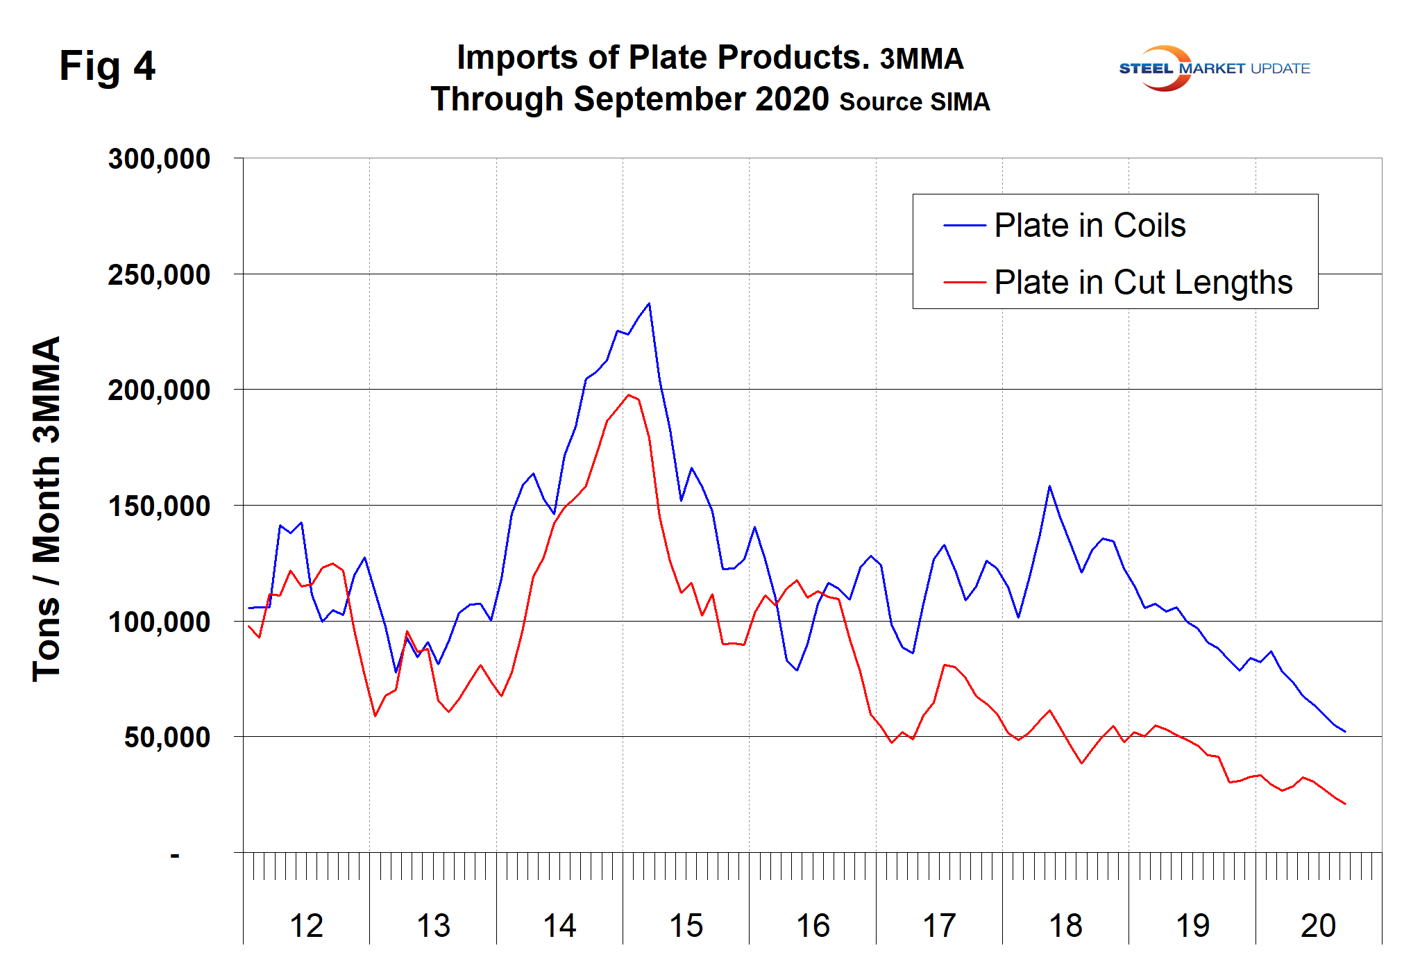
Figures 3 and 4 show the history of sheet and plate product imports since January 2012.