

Market Data

September 16, 2020
Currency Update for Steel Trading Nations
Written by Peter Wright
The U.S. dollar weakened against 12 of the 16 steel and raw materials trading nation currencies in the last 30 days and against 11 in the last 90 days, which is similar to the declines that we reported for June and July. The biggest changes in the last 90 days were in the value of the Australian dollar, which was up by 6.7 percent; the Mexican peso, up by 6.6 percent; and the euro, up by 5.3 percent. On the downside, the Russian ruble was off by 6.8 percent and the Turkish lira by 8.7 percent. These trends all continued at the 30-day level.
![]()
On Sept. 2, Andrew Hecht of the Hecht Commodity Report wrote: “The dollar is still the world’s reserve currency, making it the benchmark pricing mechanism for commodities. In the last week of August, at the virtual Jackson Hole Fed gathering, Chairman Jerome Powell told the world the U.S. central bank is prepared to allow inflation to average 2 percent rather than using the level as a target. The tolerance for a rise in the inflation rate above the 2 percent level is a pass for commodity prices to rise. At the same time, the trend in the U.S. dollar since March amounts to additional bullish fuel for the commodities asset class. The dollar index reached an 18-year high in March when it rose to 103.96 as risk-off conditions gripped markets, sending money flows into safe-haven assets. The index posted a marginally higher high compared to the 103.815 level in early 2017. Since then, it has been all downhill for the U.S. currency, which broke through a support level in July. Currency values rarely experience explosions on the upside or implosions on the downside. They tend to trend for long periods. The trend in the dollar index is lower as it grinds towards its next technical support level.”
At Steel Market Update, we track the currencies of the 16 pre-eminent global steel and iron ore trading nations on a daily basis and report monthly. The currencies of these 16 don’t necessarily follow the Broad Index value of the U.S, dollar, but in the last three months have done so. The latest value of the Broad Index as published by the Federal Reserve was Sept. 11 on which date the dollar was down by 2.4 percent in three months and by 0.5 percent in 30 days. At the three month level, the daily broad index has declined every day since May 14. Our country data from Oanda was current as of Sept. 15.
Figure 1 plots the daily Broad Index (BI) value of the U.S. dollar since 2013. The BI has declined by 7.9 percent since March 23, 2020.
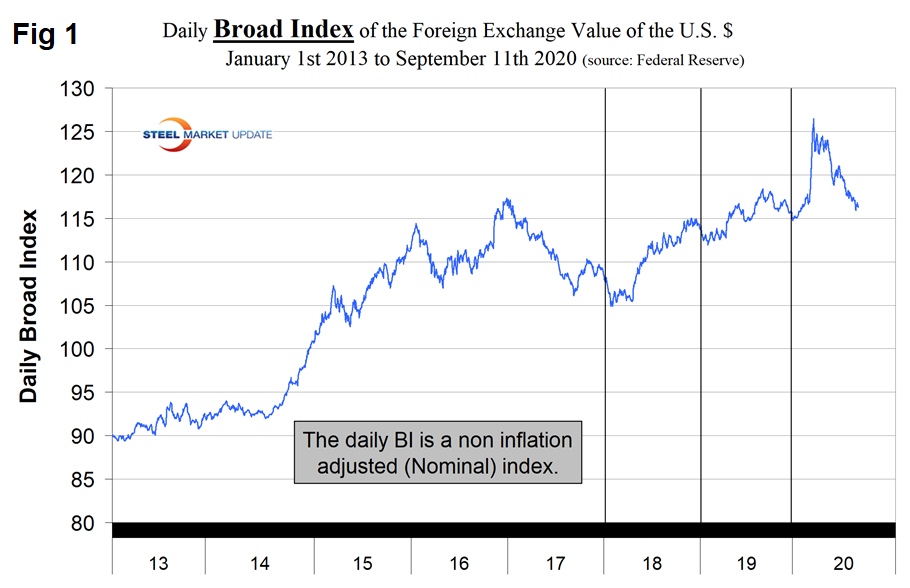
Table 1 shows the number of currency units that it takes to buy one U.S. dollar and the percentage change in the last year, three months, one month and seven days. The overall picture for the steel trading nations is that in three months prior to April 13, the dollar strengthened against 14 of the 16; in this current report of Sept. 15, it weakened against 11 of the 16. Table 1 is color coded to indicate weakening of the dollar in green and strengthening in red. We regard strengthening of the U.S. dollar as negative and weakening as positive because of the effect on net imports. Figures 2 and 3 show the extreme gyrations that have occurred at the three-month and one-month levels in the last four and a half years.
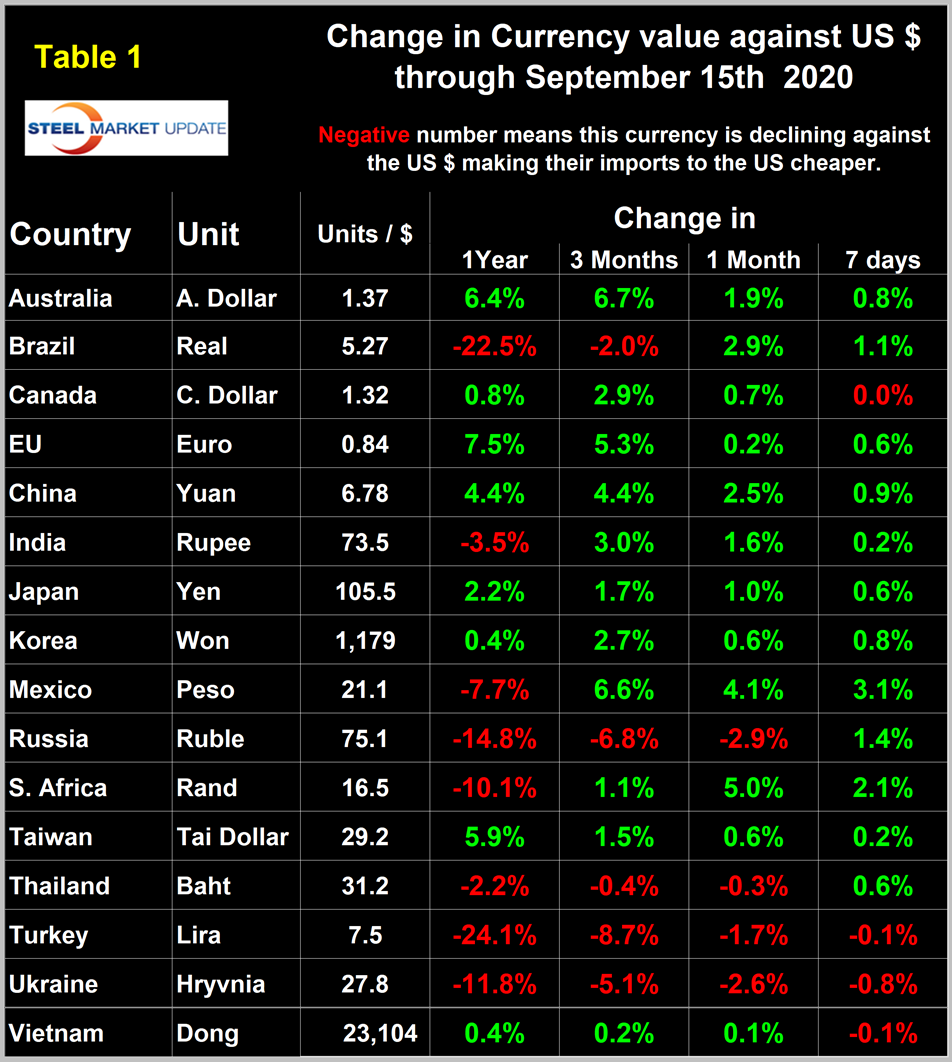
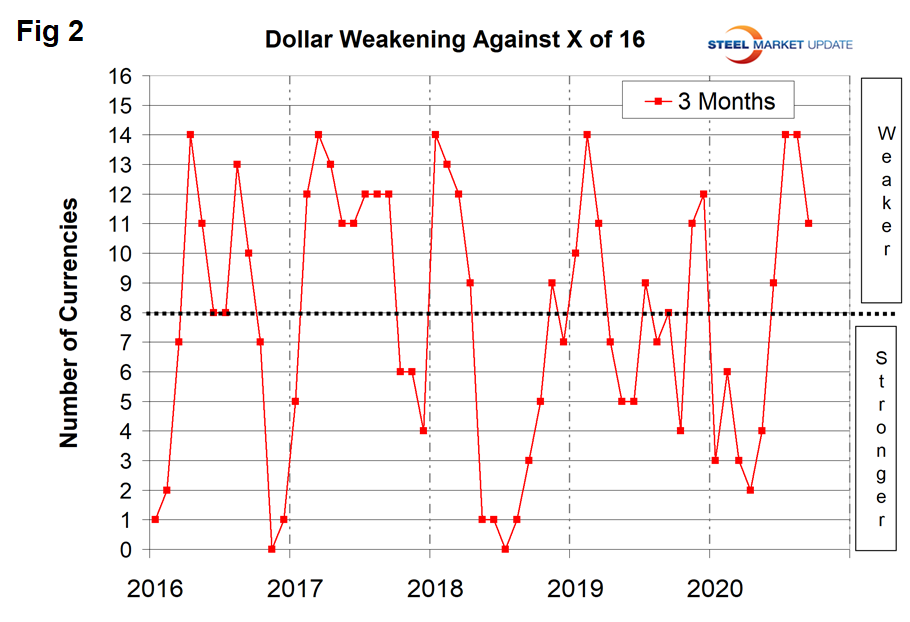
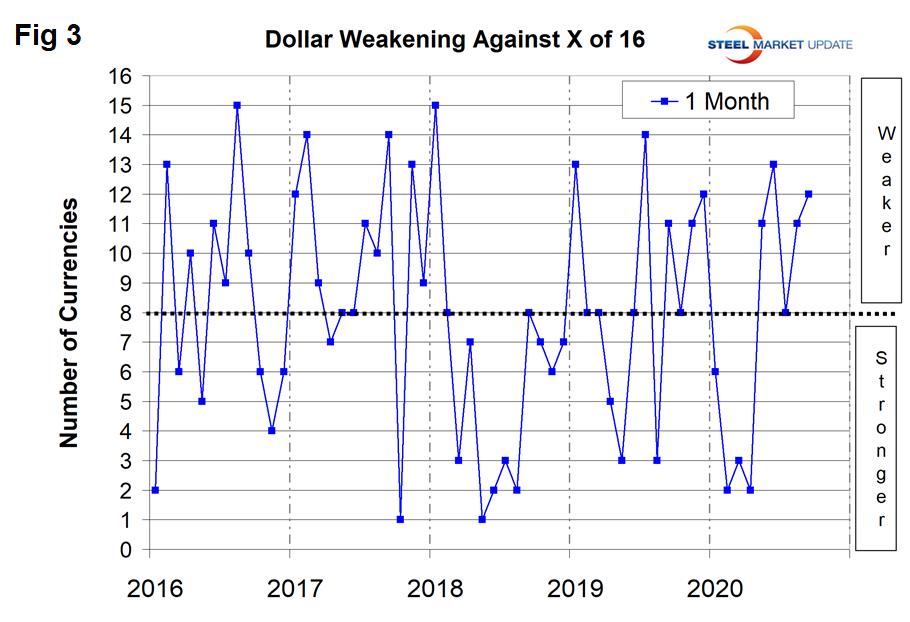
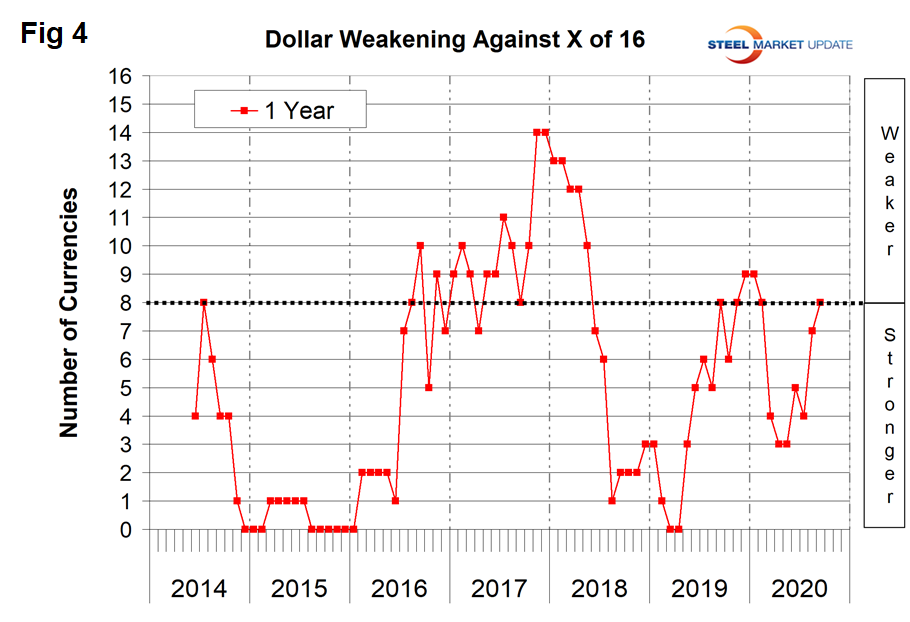
Figure 4 shows the 12-month picture, which removes some of the volatility by showing the number of currencies against which the dollar was weakening on a year-over-year basis. In March and April 2019, the dollar strengthened against all 16 at the 12-month level. There was a progressive weakening until December 2019 and January 2020 when the dollar weakened against nine of the 16. In the 12 months leading up to mid-September 2020, the dollar weakened against eight of the 16. A weakening dollar puts upward pressure on globally traded commodity prices including most steelmaking raw materials.
Our files contain charts of the history of the value of all 16 steel trading nation graphs and are available on request.
Explanation of Data Sources: The Broad Index is published by the Federal Reserve on both a daily and monthly basis. It is a weighted average of the foreign exchange values of the U.S. dollar against the currencies of a large group of major U.S. trading partners. The index weights, which change over time, are derived from U.S. export shares and from U.S. and foreign import shares. The data are noon buying rates in New York for cable transfers payable in the listed currencies. At SMU we use the historical exchange rates published in the Oanda Forex trading platform to track the currency value of the U.S. dollar against that of 16 steel trading nations. Oanda operates within the guidelines of six major regulatory authorities around the world and provides access to over 70 currency pairs. Approximately $4 trillion U.S. dollars are traded every day on foreign exchange markets.


