

Market Data

October 15, 2020
Currency Update for Steel Trading Nations
Written by Peter Wright
The U.S. dollar weakened against 10 of the 16 steel and raw materials trading nation currencies in the last 30 days and against 12 in the last 90 days, which is similar to the declines we reported in our September update. The biggest changes in the last 90 days were in the value of the Russian ruble, down 8.0 percent, and the Turkish lira, down 12.9 percent. The Mexican peso was up 5.9 percent. These trends continued at the 30-day level.
![]()
On Oct. 13, Andrew Hecht of the Hecht Commodity Report wrote: “The Fed’s current approach, which encourages a higher inflation level, is bearish for the U.S. dollar. With other leading central banks following the Fed’s leadership, all currencies’ purchasing power is declining. A decline in the dollar index has occurred since the March 2020 18-year high at 103.96. The index fell to a low of 91.725 on Sept. 1. After a rebound that stopped below the 95 level, it was back at around 93 on Oct. 12. The dollar index has been trending lower over the past seven months. However, I would argue that all currencies have been trending lower as an asset class. The U.S. Treasury has already borrowed a record $3 trillion in May. In the aftermath of the election, more borrowing is likely on the horizon. As the deficit grows, it weighs on the value of the dollar. With unemployment at far higher levels than at the start of 2020, the second wave of the virus causing increasing COVID-19 cases, and the U.S. Fed pressuring the legislature to provide fiscal stimulus, it is not a question of if another package is coming but when it will arrive.”
At Steel Market Update, we track the currencies of the 16 preeminent global steel and iron ore trading nations on a daily basis and report monthly. The currencies of these 16 don’t necessarily follow the Broad Index value of the U.S dollar, but in the last three months have done so. The latest value of the Broad Index as published by the Federal Reserve was Oct. 9 on which date the dollar was down by 1.4 percent in three months and by 2.0 percent in 30 days. At the three-month level, the daily broad index has declined almost every day since May 14. Our country data from Oanda was current as of Oct. 12.
Figure 1 plots the daily Broad Index (BI) value of the U.S. dollar since 2013. The BI has declined by 8.6 percent since March 23, 2020.
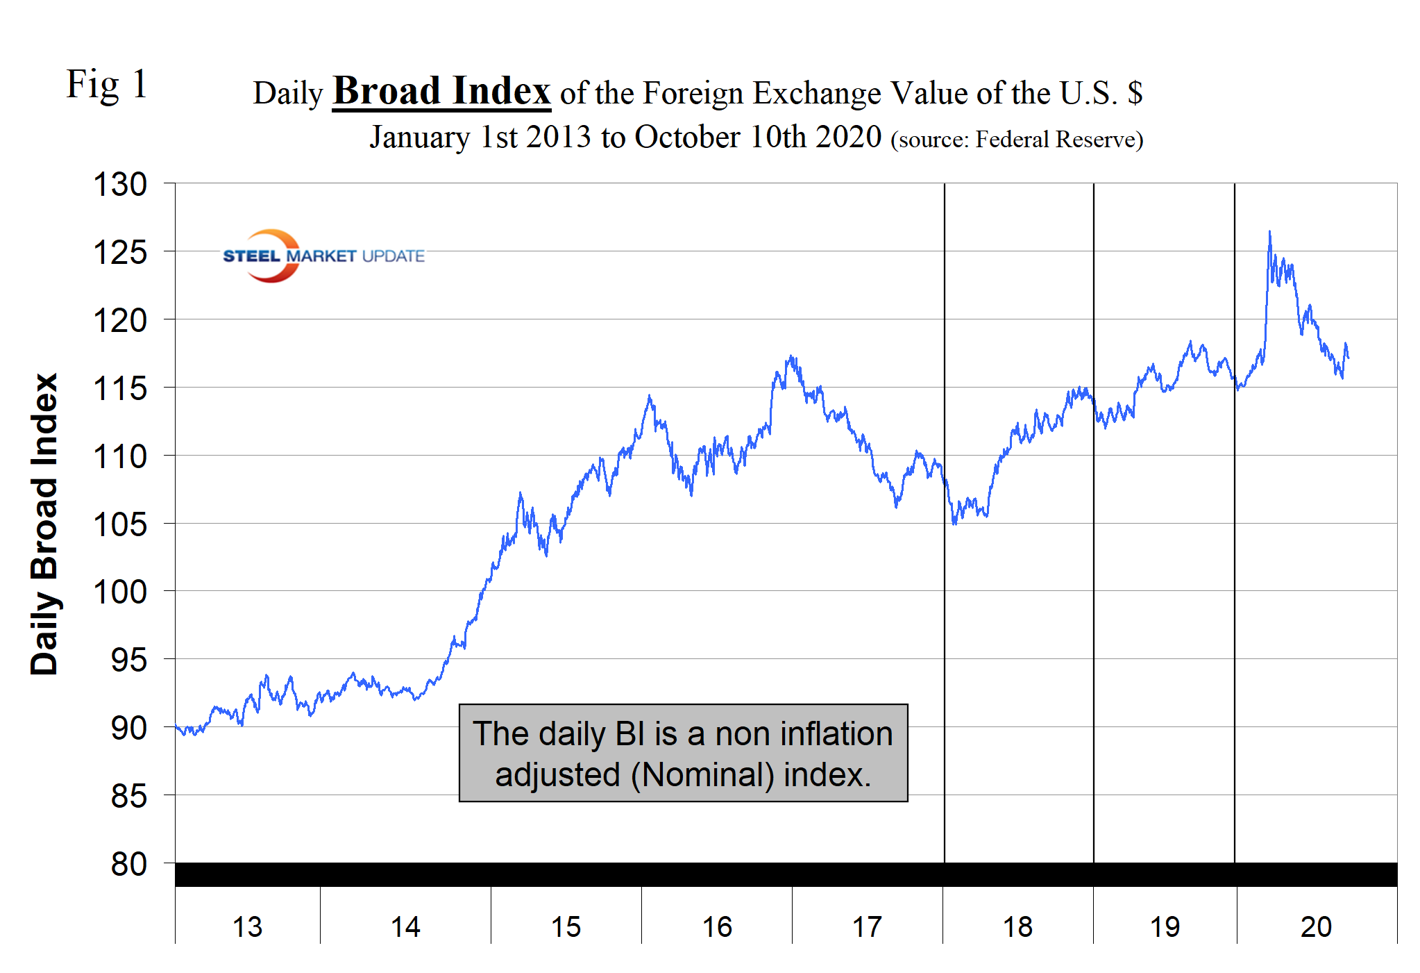
Table 1 shows the number of currency units that it takes to buy one U.S. dollar and the percentage change in the last year, three months, one month and seven days. The overall picture for the steel trading nations is that in three months prior to April 13, the dollar strengthened against 14 of the 16; in this current report of Oct. 12 it weakened against 12 of the 16. Table 1 is color coded to indicate weakening of the dollar in green and strengthening in red. We regard strengthening of the U.S. dollar as negative and weakening as positive because of the effect on net imports. Figures 2 and 3 show the extreme gyrations that have occurred at the three-month and one-month levels in the last four and a half years.
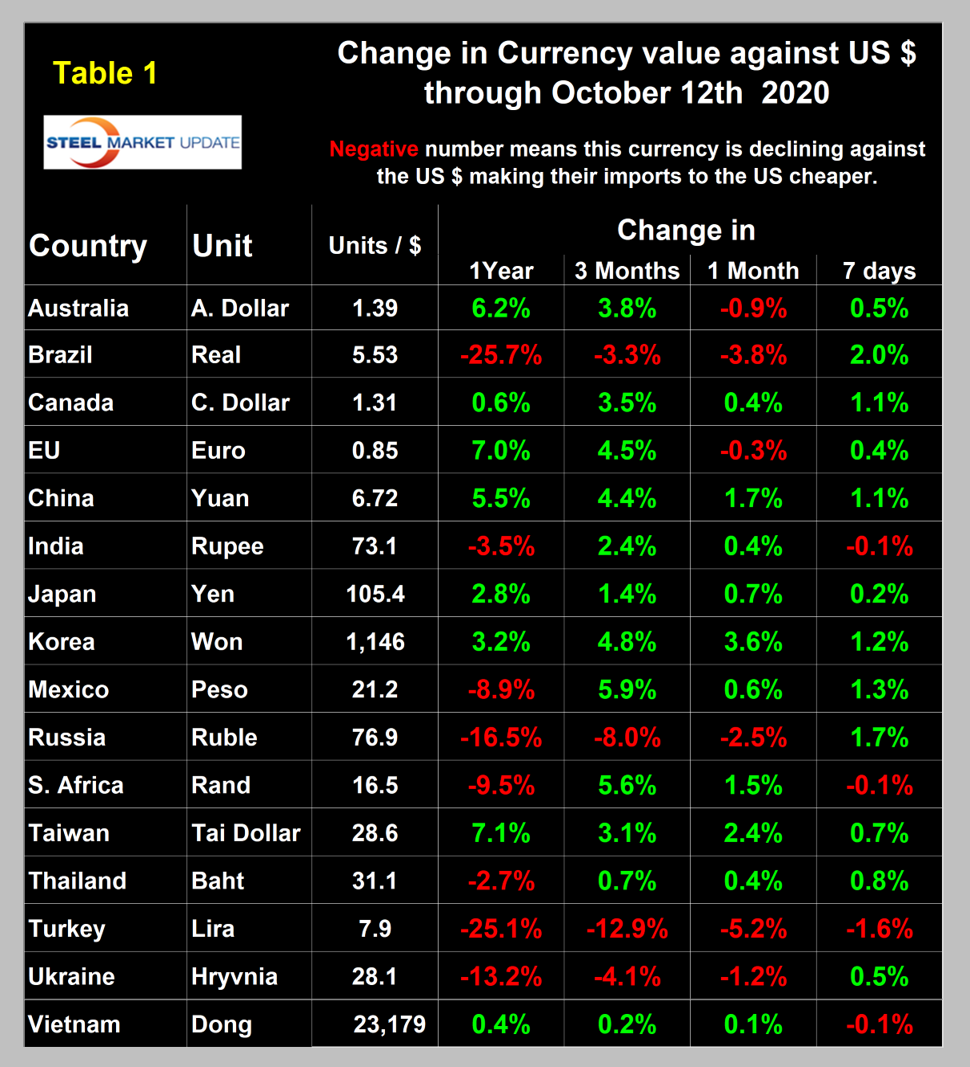
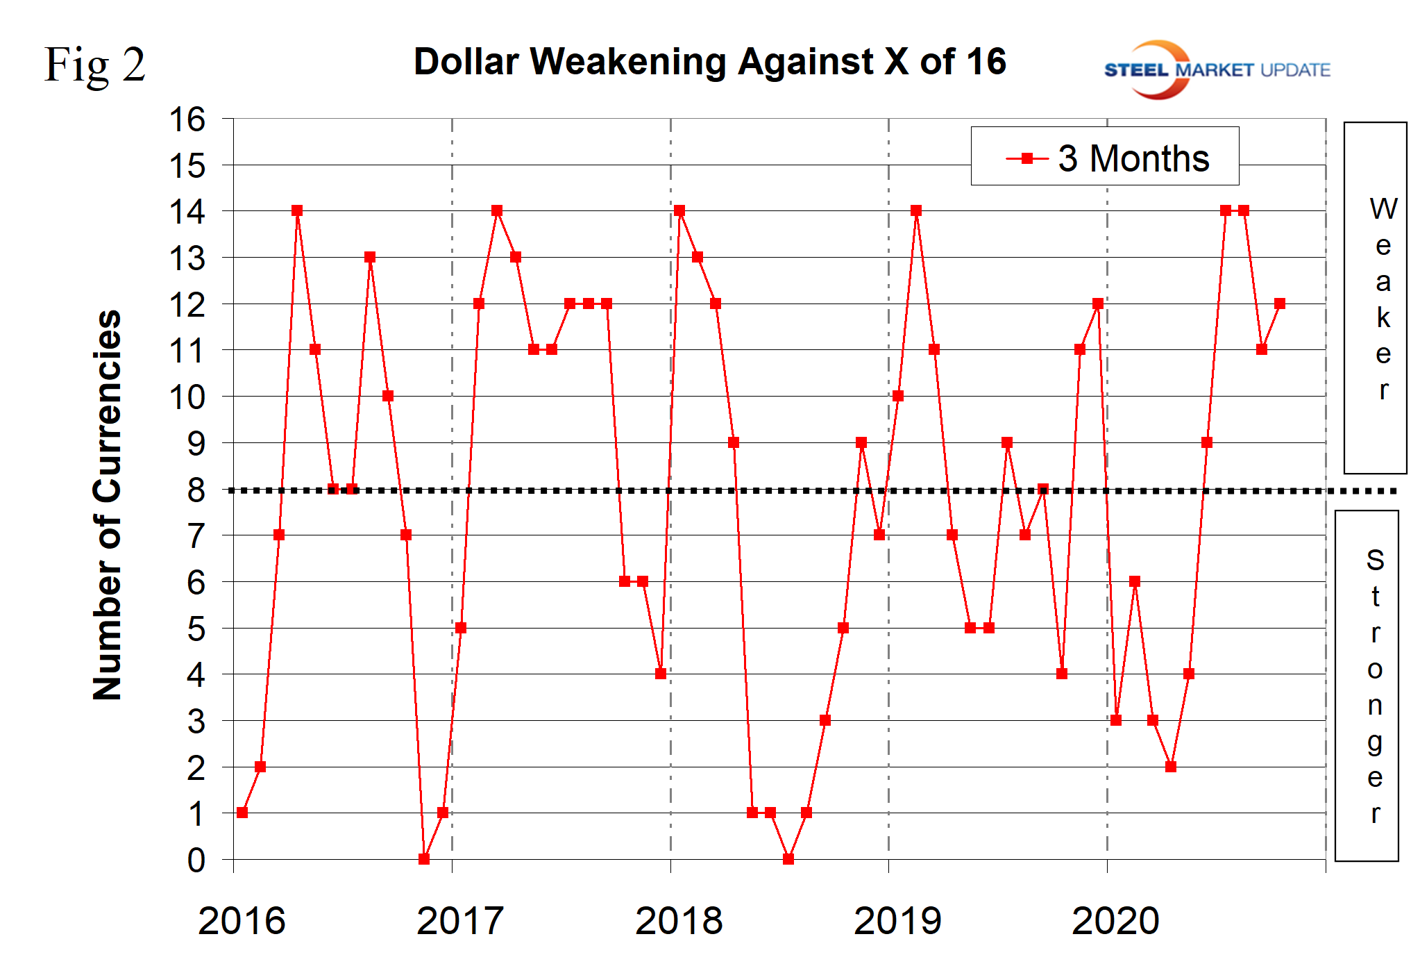
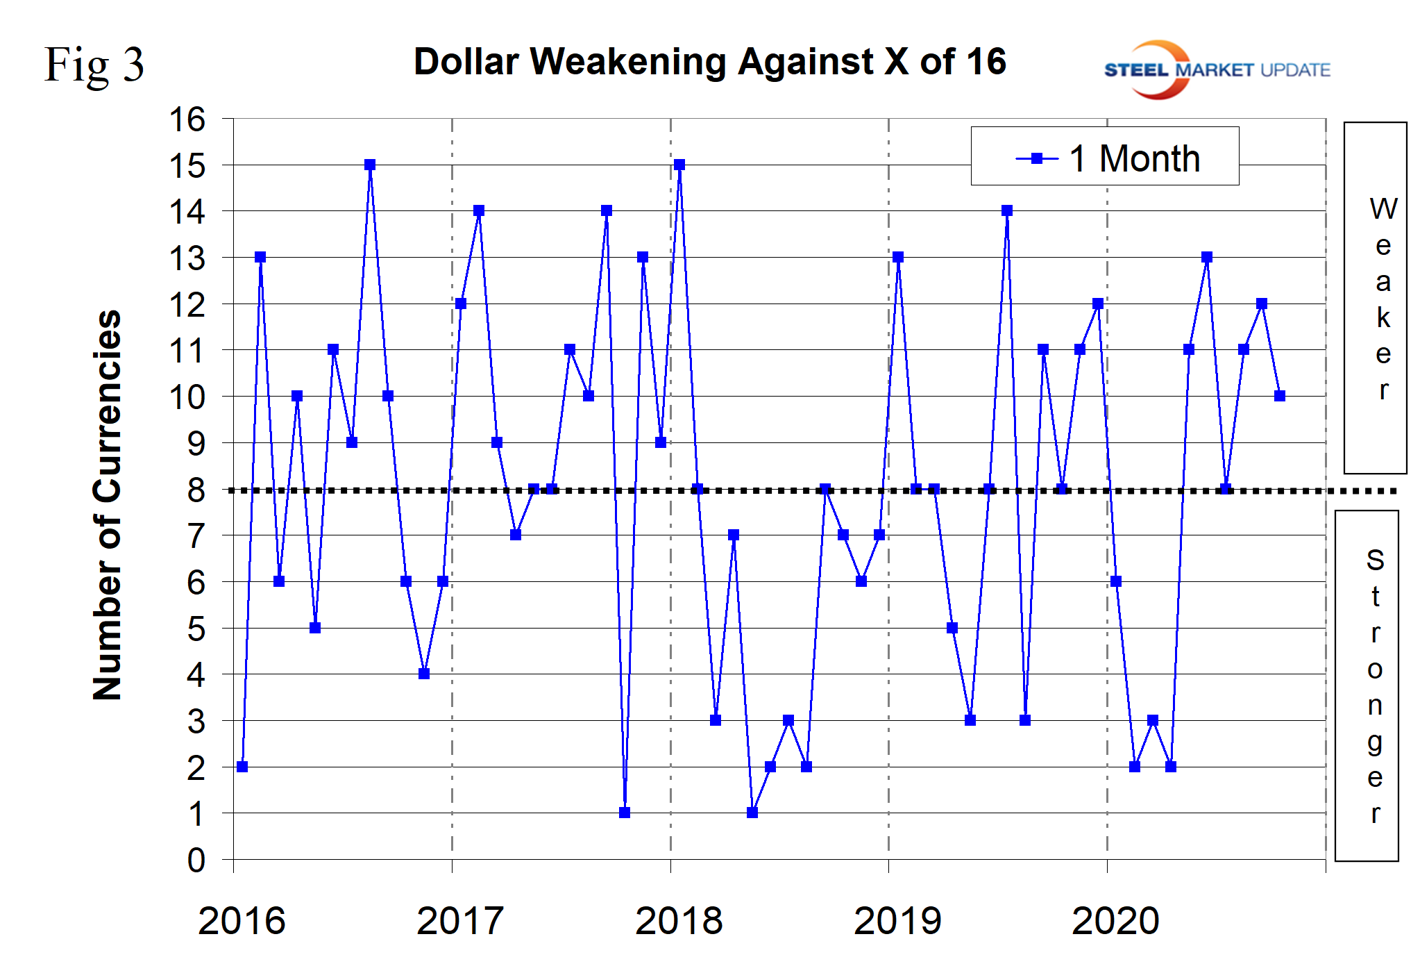
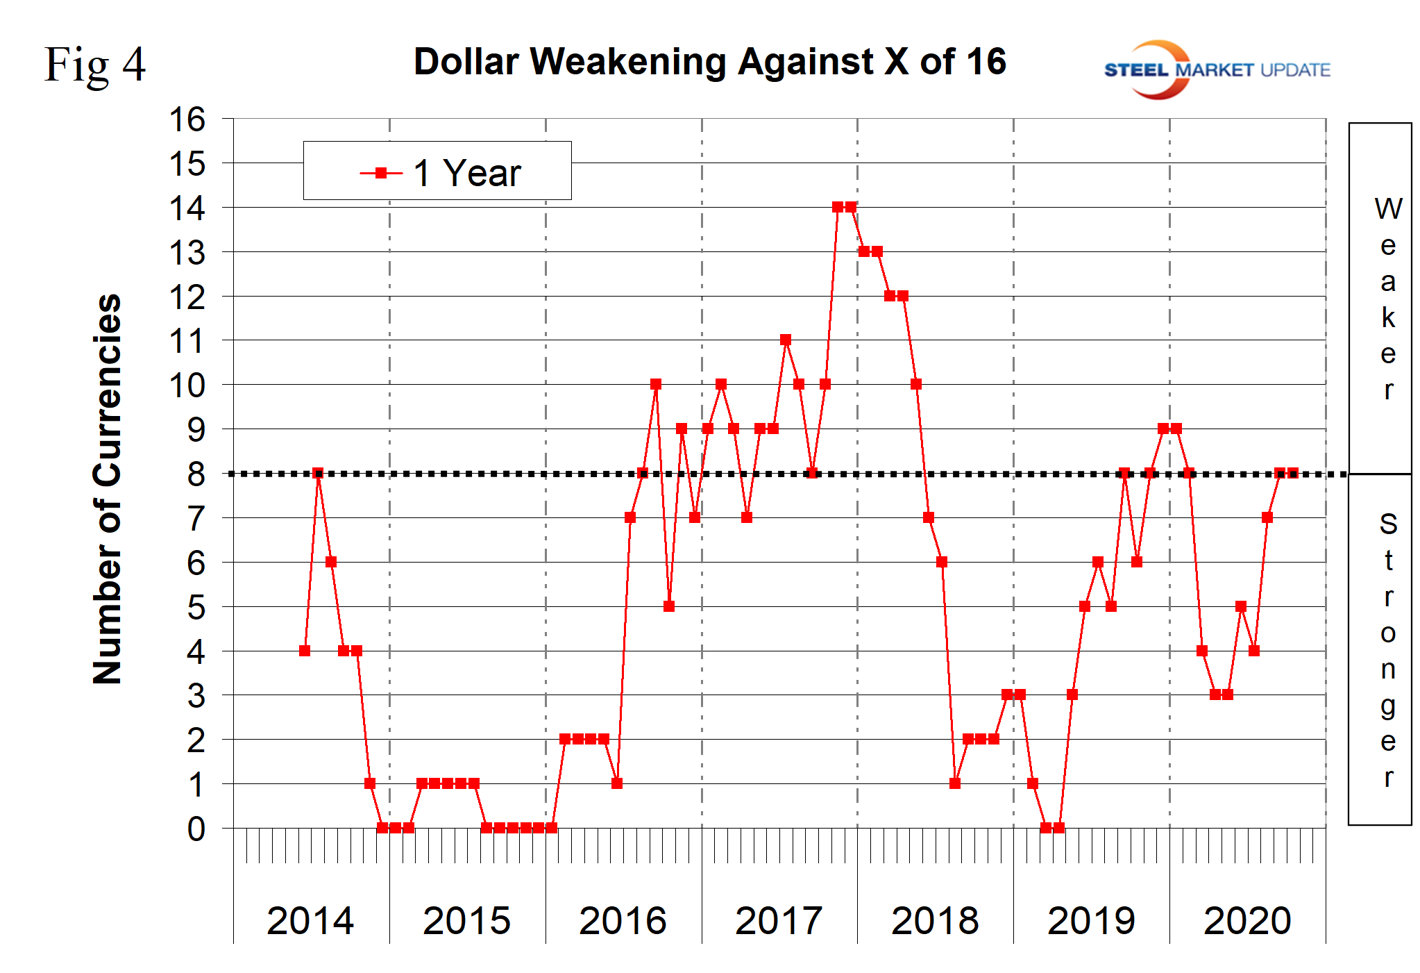
Figure 4 shows the 12-month picture, which removes some of the volatility by showing the number of currencies against which the dollar was weakening on a year-over-year basis. In March and April 2019, the dollar strengthened against all 16 at the 12-month level. There was a progressive weakening until December 2019 and January 2020 when the dollar weakened against nine of the 16. This was followed by a strengthening through April and May and a renewed decline through mid-October. In the 12 months leading up to mid-October 2020 the dollar weakened against eight of the 16. A weakening dollar puts upward pressure on globally traded commodity prices including most steelmaking raw materials.
Our files contain charts of the history of the value of all 16 steel trading nation graphs and are available on request.
Explanation of data sources: The Broad Index is published by the Federal Reserve on both a daily and monthly basis. It is a weighted average of the foreign exchange values of the U.S. dollar against the currencies of a large group of major U.S. trading partners. The index weights, which change over time, are derived from U.S. export shares and from U.S. and foreign import shares. The data are noon buying rates in New York for cable transfers payable in the listed currencies. At SMU we use the historical exchange rates published in the Oanda Forex trading platform to track the currency value of the U.S. dollar against that of 16 steel trading nations. Oanda operates within the guidelines of six major regulatory authorities around the world and provides access to over 70 currency pairs. Approximately $4 trillion U.S. dollars are traded every day on foreign exchange markets.


