

Market Data

October 15, 2020
Currency Update for Steel Trading Nations
Written by Peter Wright
The U.S. dollar weakened against 15 of the 16 steel and raw materials trading nation currencies in the last 30 days and against 12 in the last 90 days, which is similar to the declines we reported in our last two updates. The biggest changes in the last 90 days were in the value of the Mexican peso, up 8.6 percent, the Korean won, up 6.9 percent, and the South African rand, up 8.9 percent. The Russian ruble was down 2.6 percent and the Turkish lira was down 6.5 percent. At the 30-day level, the Turkish lira bounced back by 6.7 percent and the Brazilian real was up by 7.9 percent.
![]()
Rothco Research stated Nov. 26: “In addition to the central banks’ asset growth differential, another leading indicator that is pricing in significant USD weakness in the medium term is the U.S. twin deficits (fiscal and current account deficit). The twin deficit has led the USD index by 15 months in the past 15 years, and the recent titanic Treasury issuance to finance the COVID-19 losses has widened the twin deficit to 12% and therefore should be followed by constant USD depreciation. Real rates, which are also considered to be one of the main drivers of currencies in the medium term, have dramatically fallen in the U.S. in the past year and therefore are also pricing in a weaker USD. Although we may see further weakness in the short run, we do not think that the USD will continue to depreciate indefinitely in the medium term. First, we are confident that U.S. real yields found their bottom in the past two months and may start to consolidate higher in the coming months. In addition, even though the twin deficit is an interesting leading indicator, we do not think that it is relevant in periods of crisis. For instance, we saw that in 2008, the twin deficit was pricing in a much lower USD, but demand for the ‘safe’ currency remained high and therefore supported USD against all other currencies. Moreover, forecasting a much weaker USD from current level implies a significant appreciation of the euro and the Japanese yen, which will not be tolerated by ECB and BoJ policymakers.”
Steel Market Update tracks the currencies of the 16 pre-eminent global steel and iron ore trading nations on a daily basis and reports monthly. The currencies of these 16 don’t necessarily follow the Broad Index value of the U.S, dollar but in the last four months have done so. The latest value of the Broad Index as published by the Federal Reserve was Nov. 20, on which date the dollar was down by 10.0 percent since March 23 and down by 3.5 percent in three months. At the three-month level, the daily broad index has declined almost every day since May 14. Our country data from Oanda was current as of Nov. 29.
Figure 1 plots the daily Broad Index (BI) value of the U.S. dollar since 2013. The BI has declined steadily since March 23, 2020.
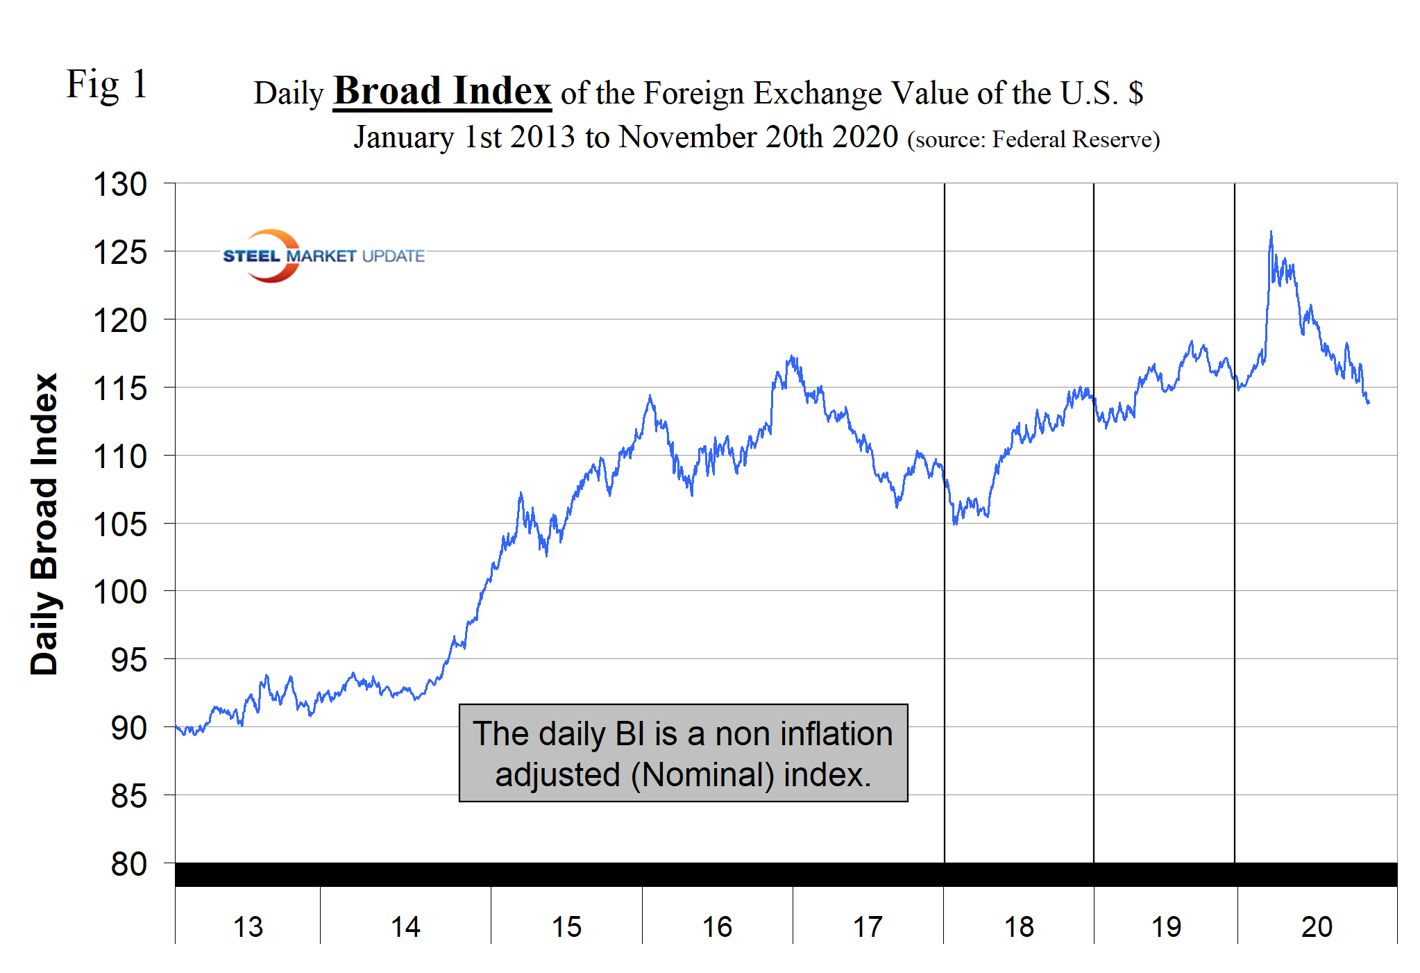
Table 1 shows the number of currency units that it takes to buy one U.S. dollar and the percentage change in the last year, three months, one month and seven days. The overall picture for the steel trading nations is that in the three months prior to April 13, the dollar strengthened against 14 of the 16. In this current report of Nov. 29, it weakened against 12 of the 16. Table 1 is color coded to indicate weakening of the dollar in green and strengthening in red. We regard strengthening of the U.S. dollar as negative and weakening as positive because of the effect on net imports. Figures 2 and 3 show the extreme gyrations that have occurred at the three-month and one-month levels in the last five years.
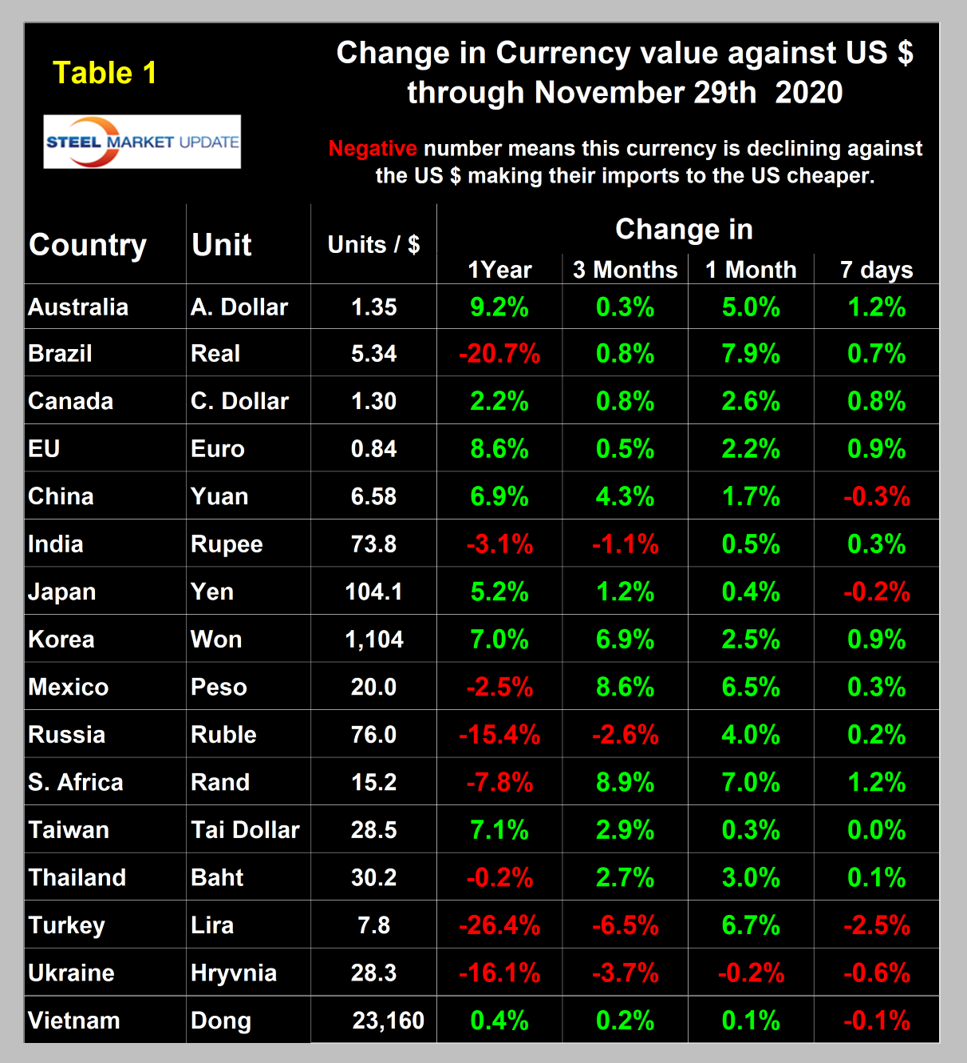
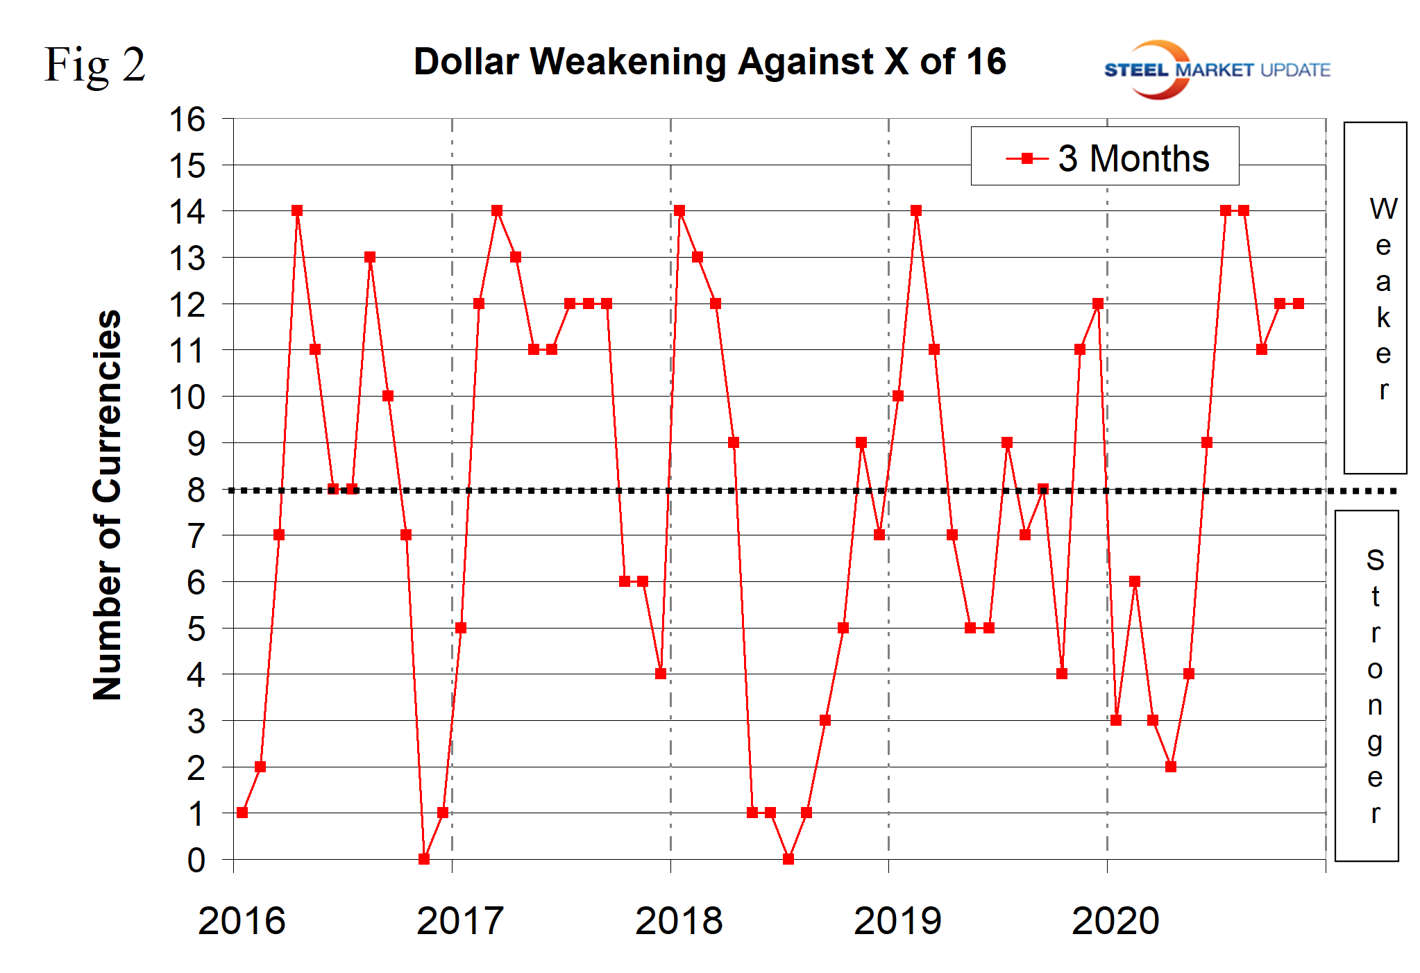
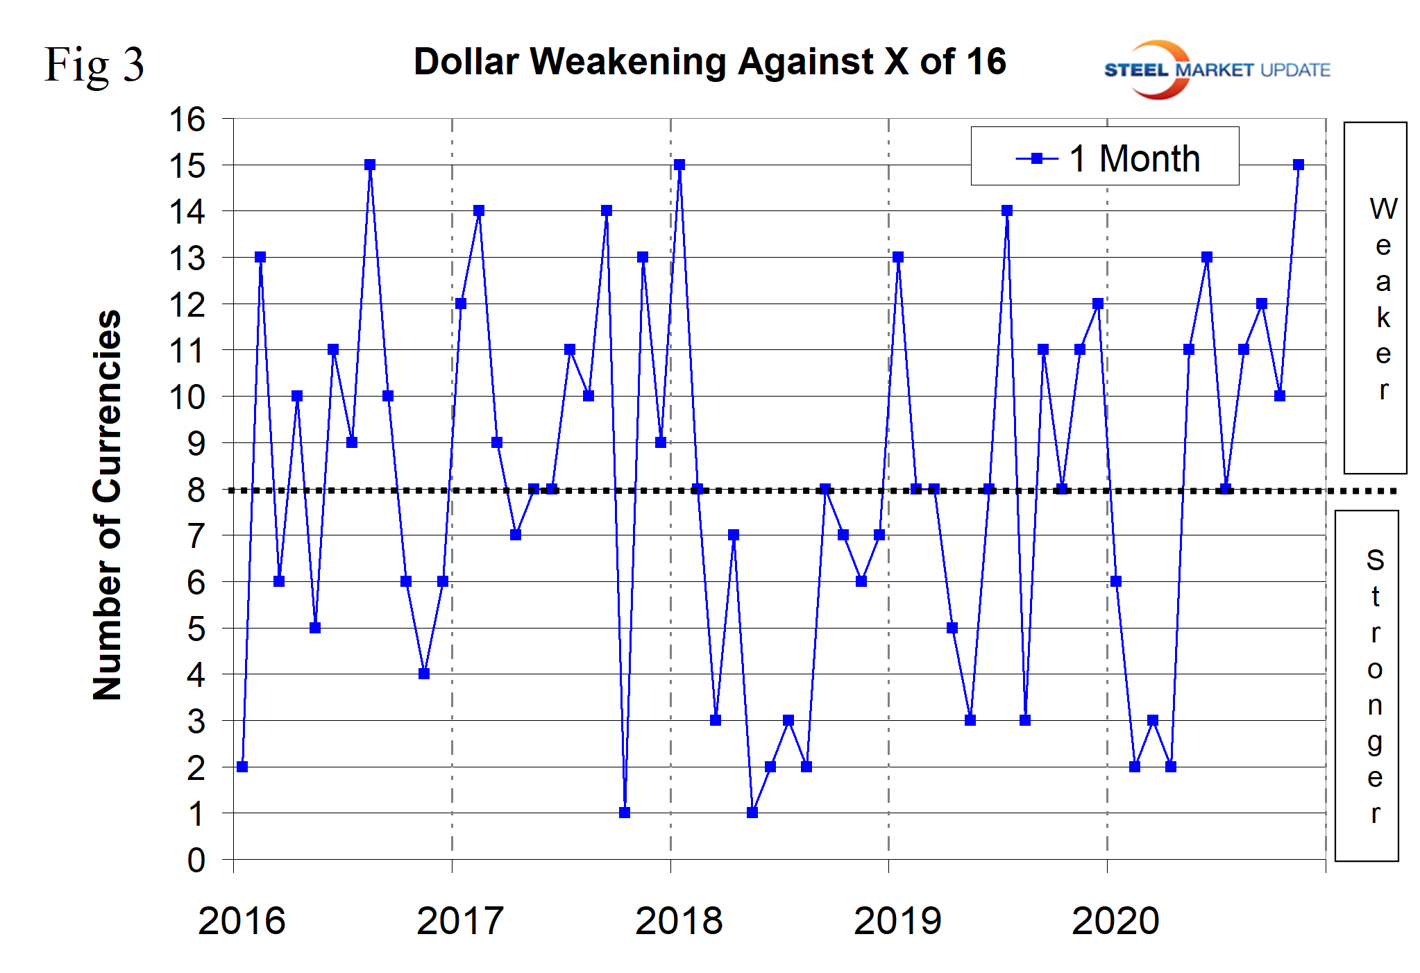
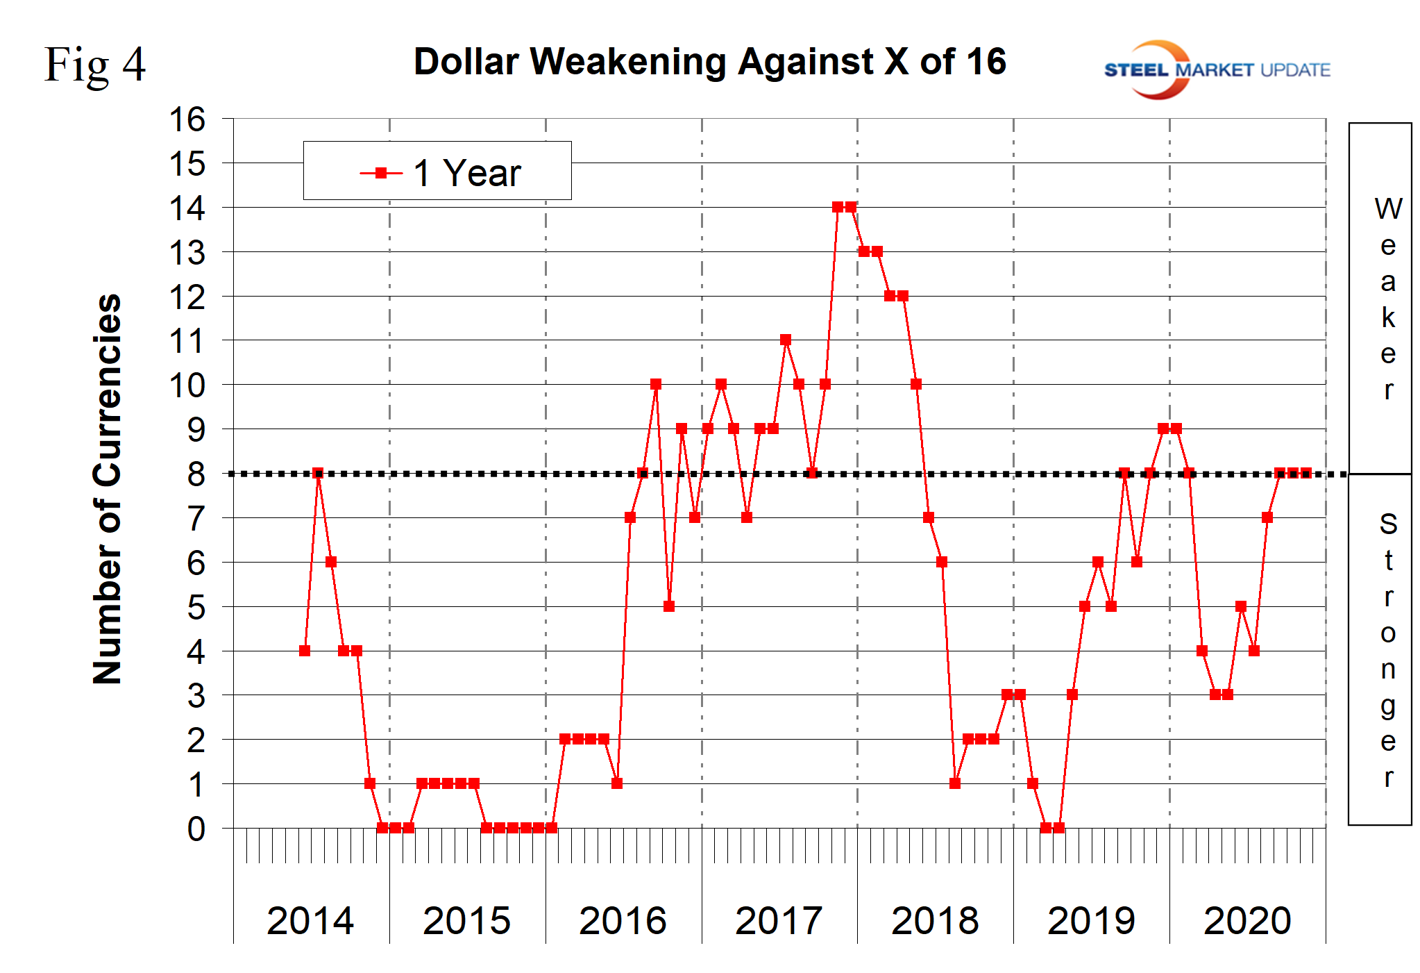
Figure 4 shows the 12-month picture, which removes some of the volatility by showing the number of currencies against which the dollar was weakening on a year-over-year basis. In March and April 2019, the dollar strengthened against all 16 at the 12-month level. There was a progressive weakening until December 2019 and January 2020 when the dollar weakened against nine of the 16. This was followed by a strengthening through April and May and a renewed decline through mid-September. In the 12 months leading up to the end of November 2020, the dollar weakened against eight of the 16. A weakening dollar puts upward pressure on globally traded commodity prices including most steelmaking raw materials.
Our files contain charts of the history of the value of all 16 steel trading nation graphs and are available on request.
Explanation of data sources: The Broad Index is published by the Federal Reserve on both a daily and monthly basis. It is a weighted average of the foreign exchange values of the U.S. dollar against the currencies of a large group of major U.S. trading partners. The index weights, which change over time, are derived from U.S. export shares and from U.S. and foreign import shares. The data are noon buying rates in New York for cable transfers payable in the listed currencies. At SMU, we use the historical exchange rates published in the Oanda Forex trading platform to track the currency value of the U.S. dollar against that of 16 steel trading nations. Oanda operates within the guidelines of six major regulatory authorities around the world and provides access to over 70 currency pairs. Approximately $4 trillion U.S. dollars are traded every day on foreign exchange markets.


