

Market Data

October 29, 2020
Q3 GDP Shows Big Rebound from Disastrous Q2
Written by Peter Wright
GDP contraction in the second quarter of 2020 was the highest ever recorded at negative 31.4 percent. Growth in the third quarter was also the highest ever at positive 33.1 percent. GDP in Q3 was 2.9 percent below the first quarter result.
![]()
On Oct. 29, the Bureau of Economic Analysis (BEA) released the first estimate of GDP growth for the third quarter, stating: “Real gross domestic product (GDP) increased at an annual rate of 33.1 percent in the third quarter of 2020, according to the ‘advance’ estimate. In the second quarter, real GDP decreased 31.4 percent. The GDP estimate released today is based on source data that are incomplete or subject to further revision. The ‘second’ estimate for the third quarter, based on more complete data, will be released on Nov. 25, 2020. The increase in real GDP reflected increases in personal consumption expenditures, private inventory investment, exports, nonresidential fixed investment and residential fixed investment that were partly offset by decreases in federal government spending and state and local government spending. Imports, which are a subtraction in the calculation of GDP, increased.”
GDP is now measured and reported in chained 2012 dollars, and on an annualized basis in the third quarter totaled $18.584 trillion, down from $19.254 trillion in Q4 2019. The growth calculation is misleading because it takes the quarter-over-quarter change and multiplies by four to get an annualized rate. This makes the high quarters higher and the low quarters lower. Figure 1 clearly shows this effect. The blue line is the trailing 12-month growth and the black line is the headline quarterly result. On a trailing 12-month basis, GDP was down by 2.9 percent in the third quarter, which was an improvement from negative 9.03 percent in the second quarter, but down from positive 2.78 percent in Q1 2019. To put this into perspective, the average in 43 quarters since Q1 2010 has been a growth of 1.87 percent. The blue line in Figure 1 shows the progress of the trailing 12-month result since the first quarter of 2005.
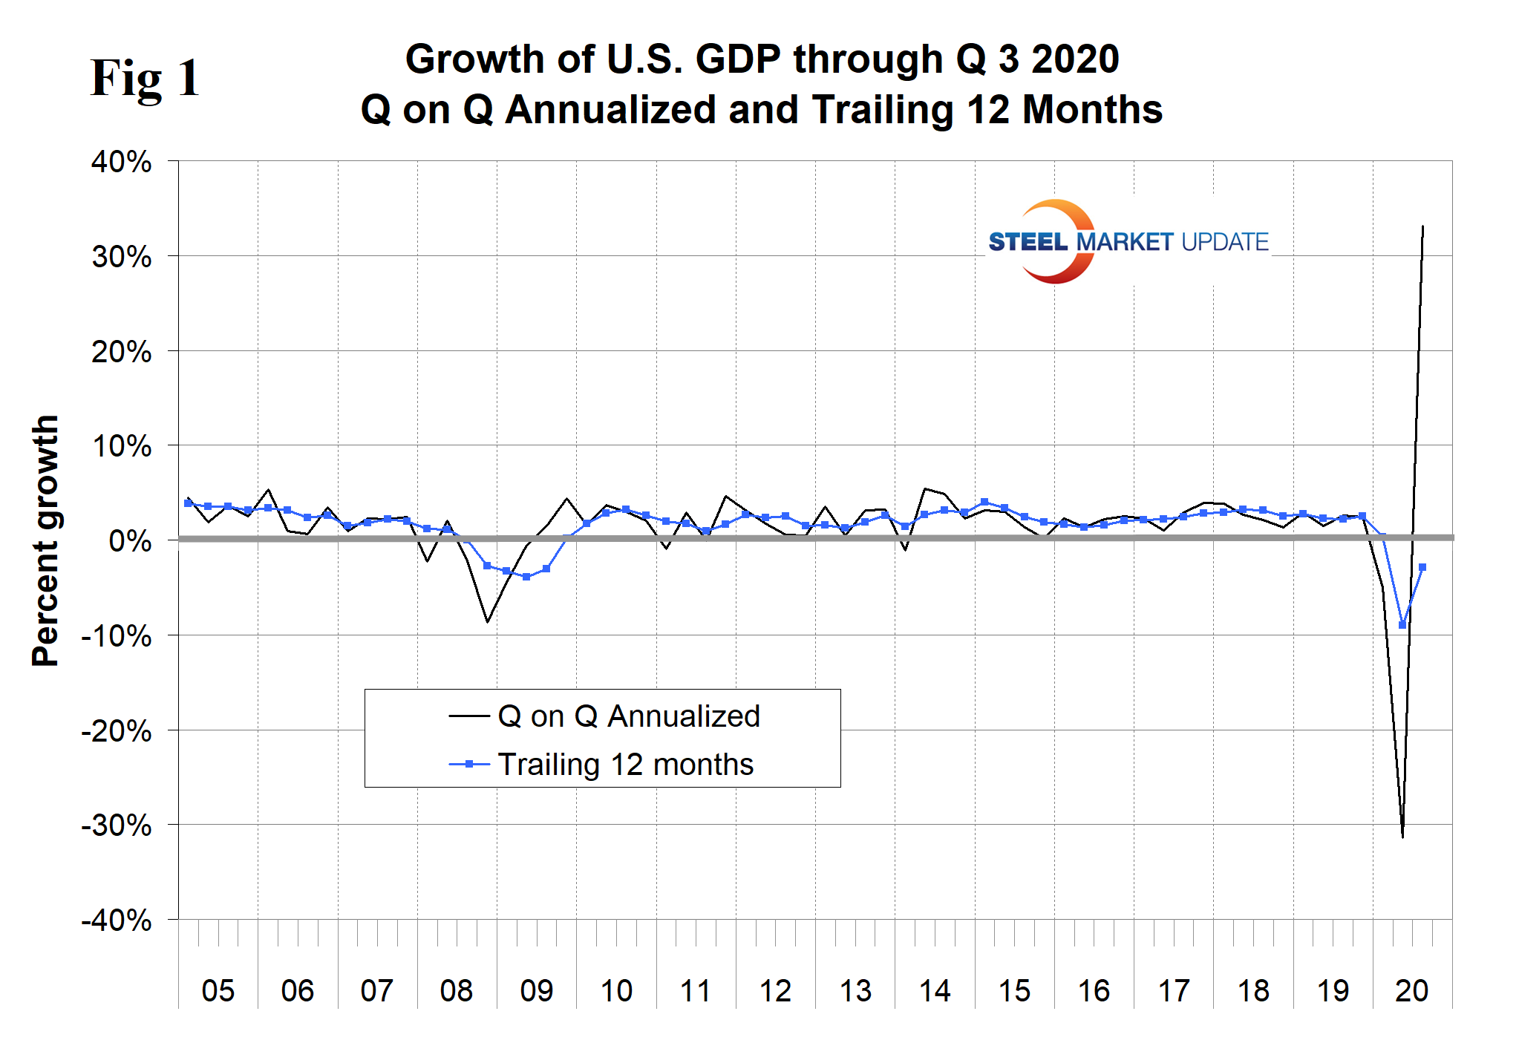
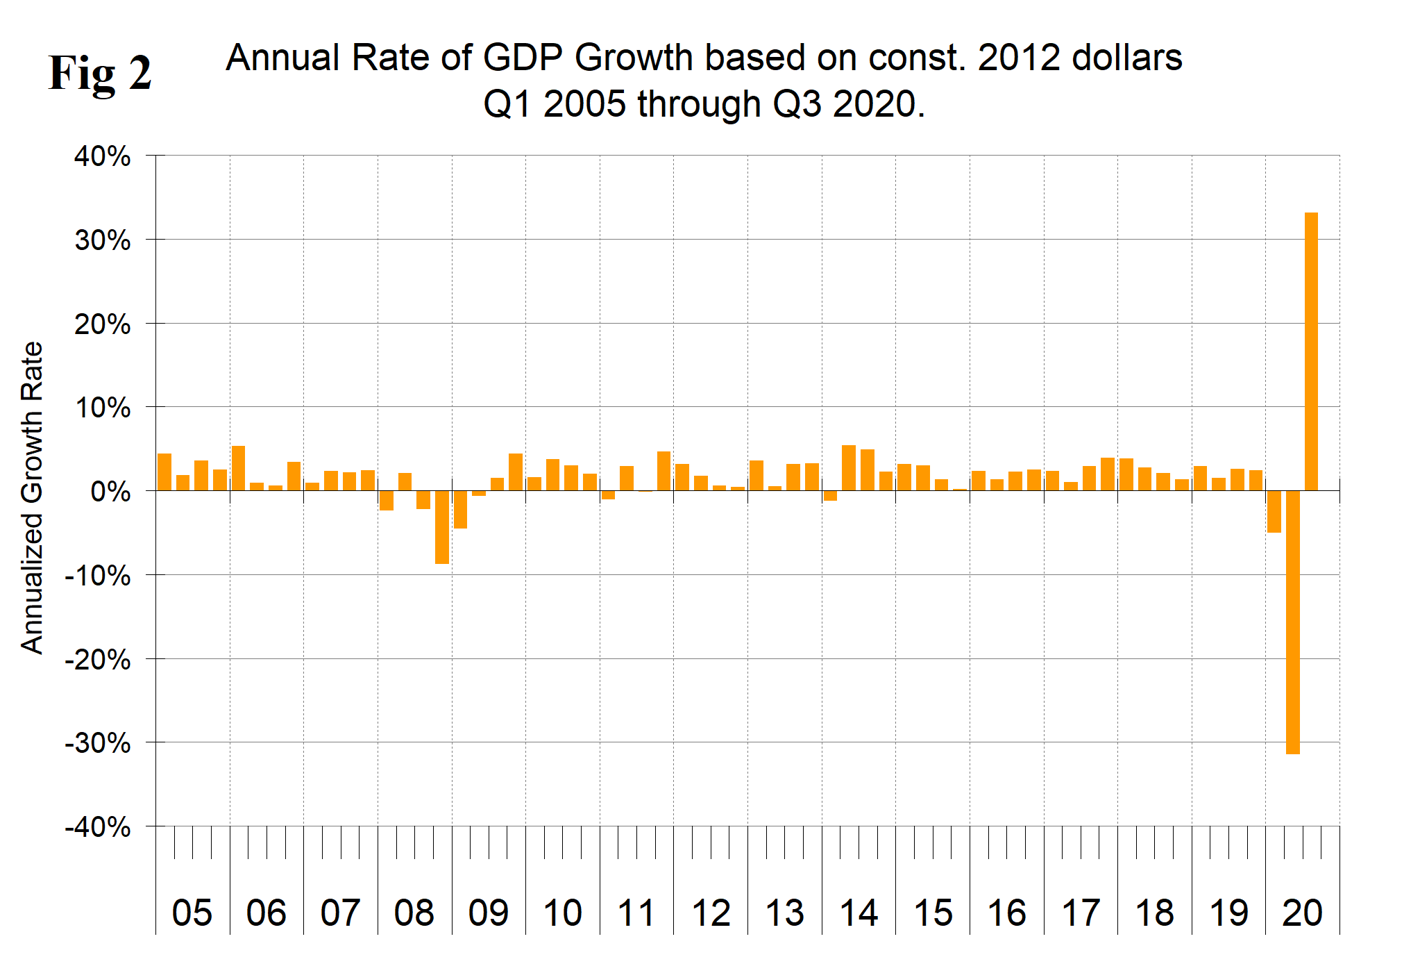
Figure 2 shows the headline quarterly results also since Q1 2005.
The mix of the six major contributory components in the final GDP growth calculation is shown in Figure 3. Normally, personal consumption is the dominant growth driver, and this was the case in the latest data when this contribution was positive 25.27 percent, an improvement from negative 24.01 percent in the second quarter. Personal consumption includes goods and services, the goods portion of which includes both durables and non-durables. Net exports and government expenditures detracted from the overall recovery. The effect of inventories is always a wild card in the GDP calculation. Declining inventories are entered as a negative in the GDP calculation. Note that in the definitions at the end of this piece, inventories are not mentioned. Over the long run, inventory changes are a wash and simply move the reported growth from one period to another.
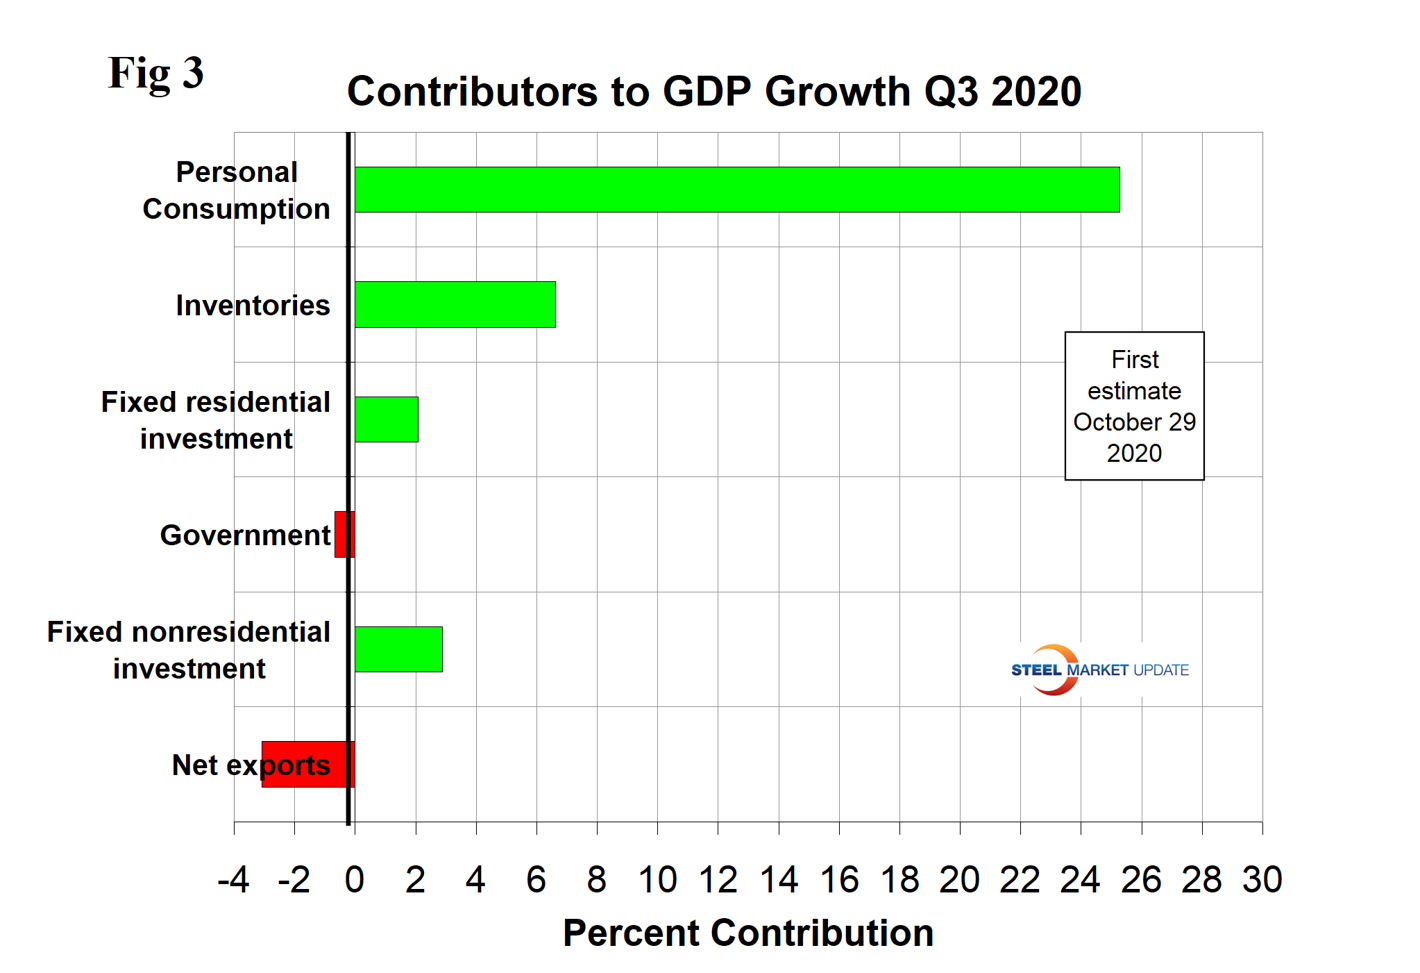
Figure 4 shows the contributions of residential and nonresidential investment. These latest data do not align well with the results of construction put in place (CPIP) data issued by the Department of Commerce.
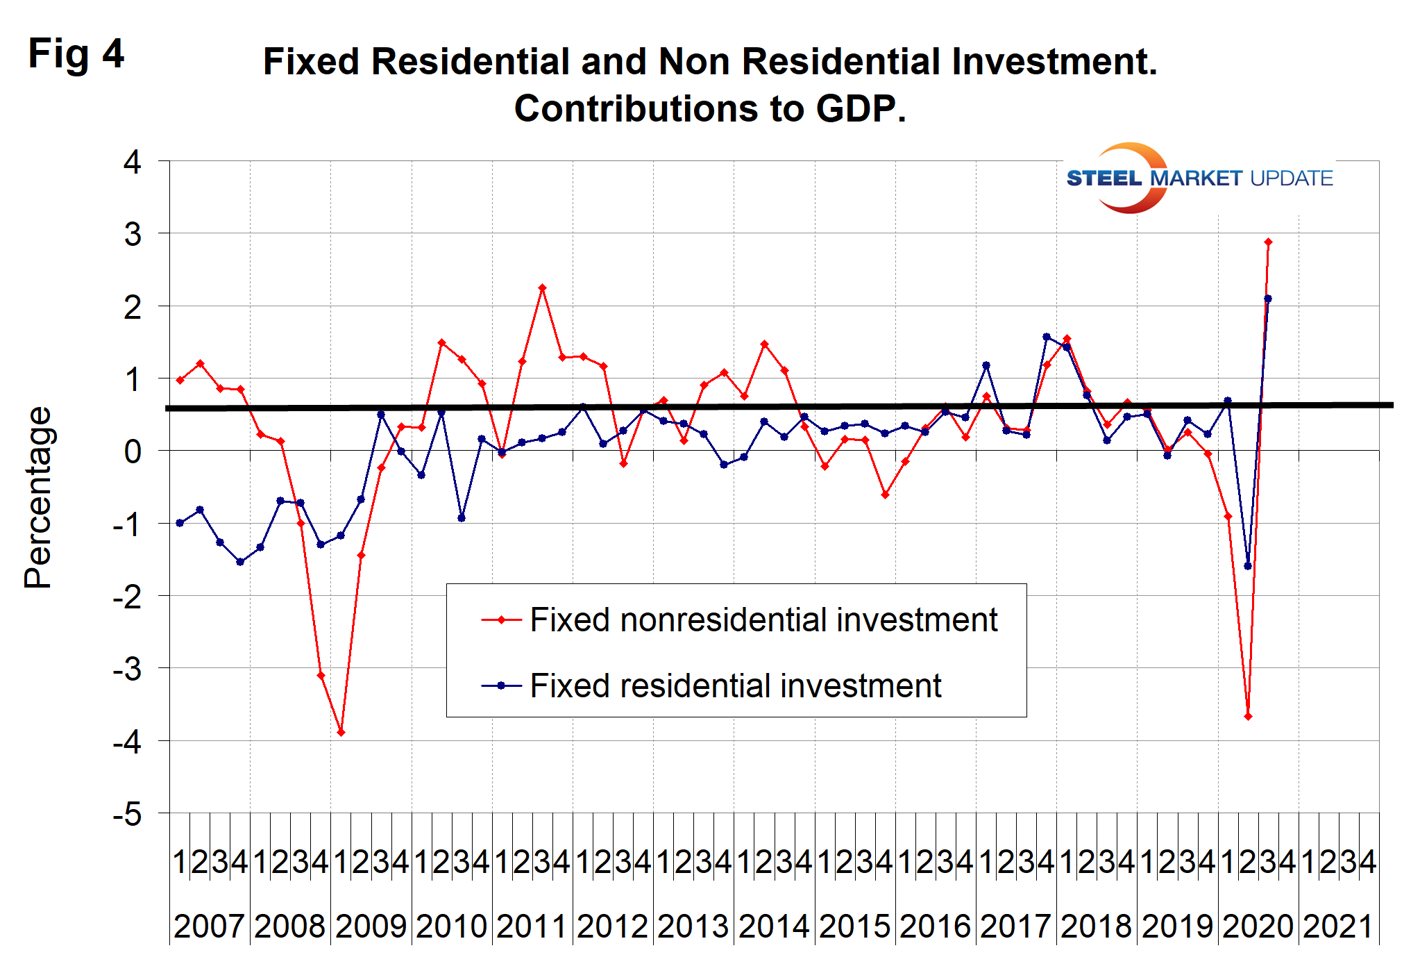
Figure 5 shows the quarterly contributions of the six major subcomponents of GDP since Q1 2007. Clearly, the contraction and recovery was driven by the consumer. In addition, rising inventories made a 6.6 percent contribution to the Q3 result.
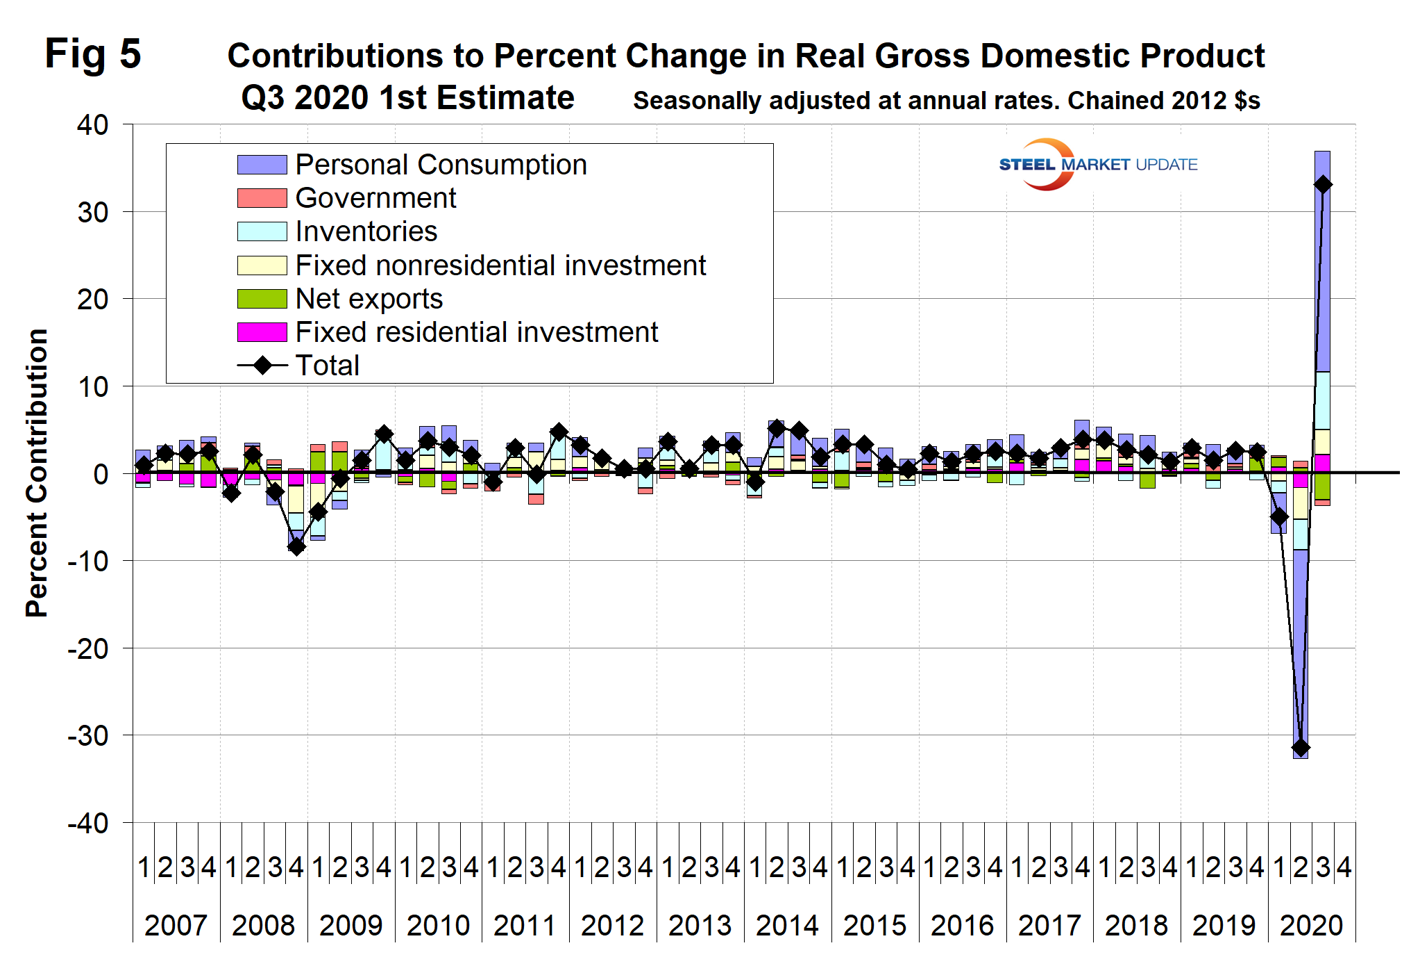
Figure 6 shows the breakdown of the $18.584 trillion economy.
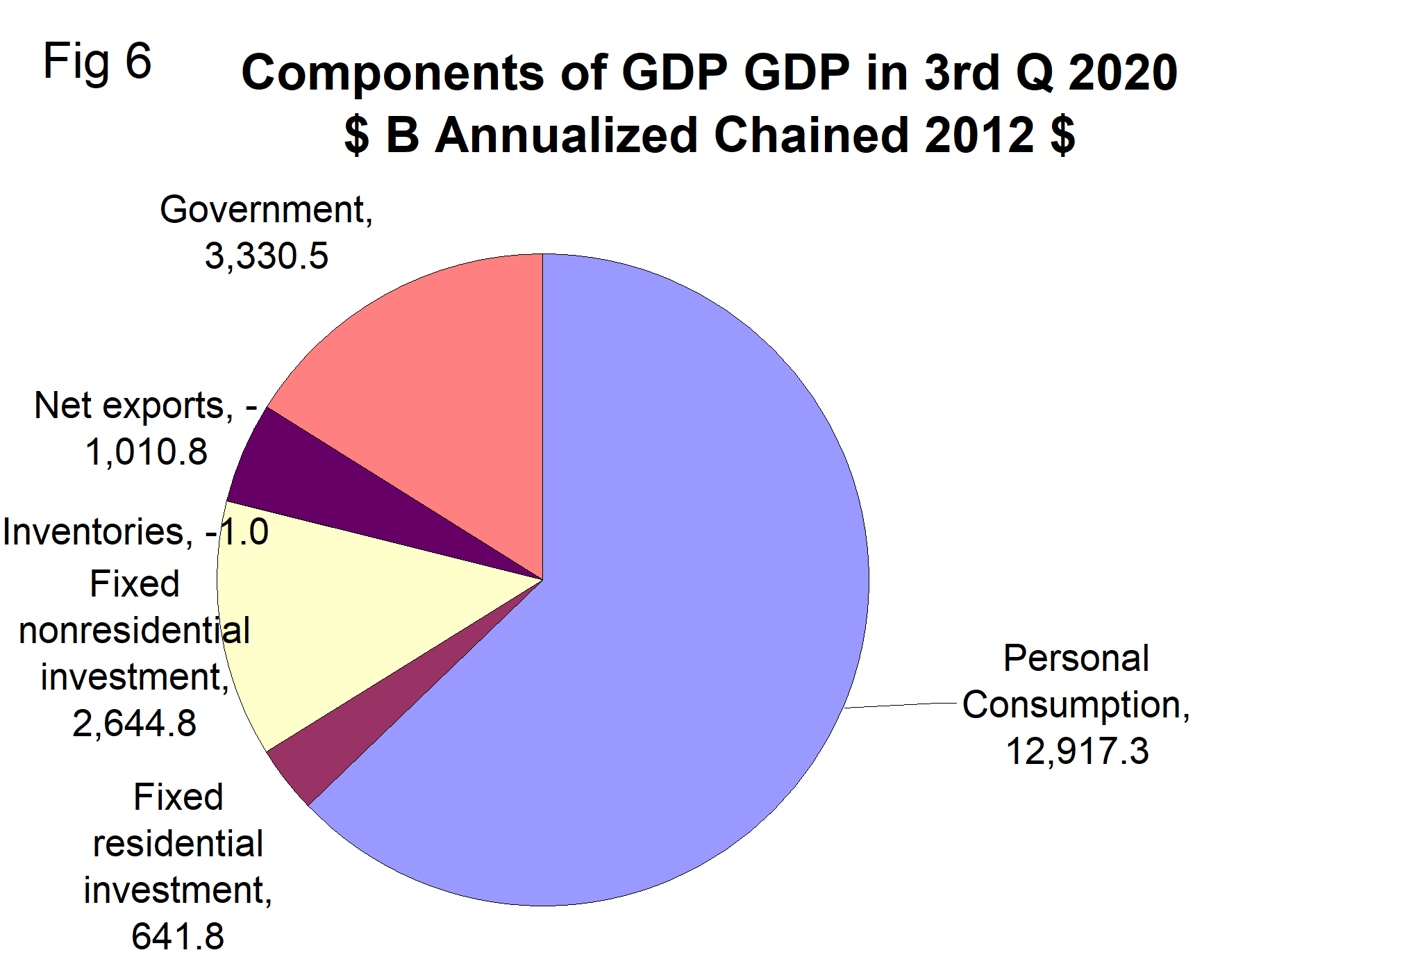
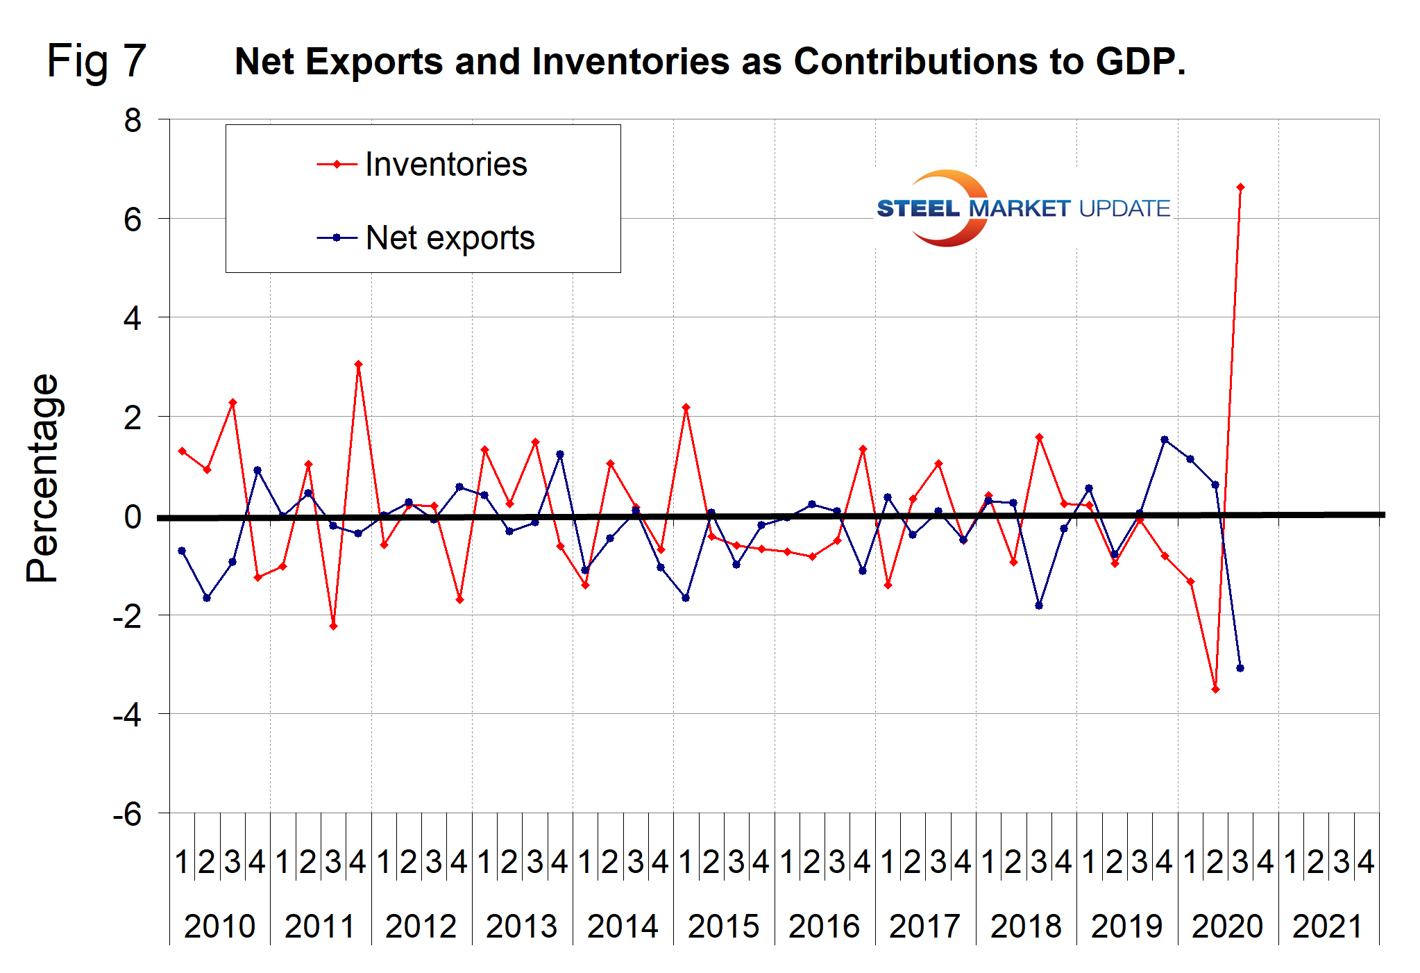
Figure 7 isolates the contribution of net exports and inventories. There seems to be a strong tendency for these to bail each other out and to make the headline quarterly result more stable.
SMU Comment: This has been a bizarre result for back-to-back quarters. We believe the blue line in Figure 1 is the best way to clear our minds of the volatility. On a trailing 12-month basis, GDP growth has declined from positive 3.2 percent in Q2 2018 to negative 2.91 percent in Q3 2020. We think this is the best way to look at the data because the headline quarterly result can be very misleading in its exaggeration of volatility.


