Analysis

November 13, 2020
Heating and Cooling Equipment Shipments in September
Written by Brett Linton
September heating and cooling equipment shipments totaled 2.03 million units, up 28.3 percent from the same month one year ago, according to recent data from the Air-Conditioning, Heating, and Refrigeration Institute (AHRI). Total September shipments declined 3.0 percent from the previous month, but the market is coming down from a recent record-high; June 2020 saw the highest monthly shipment level in SMU’s 12-year history.
Total shipments for 2020 are now at 16.6 million units, up 2.8 percent compared to 16.2 million units shipped in the first nine months of 2019. This similar year-to-date figure helps put 2020 data into perspective; September heating and cooling shipments appear significantly higher than previous years on a monthly basis, but in reality they are just “catching up” after the Q2 2020 Covid-induced lull.
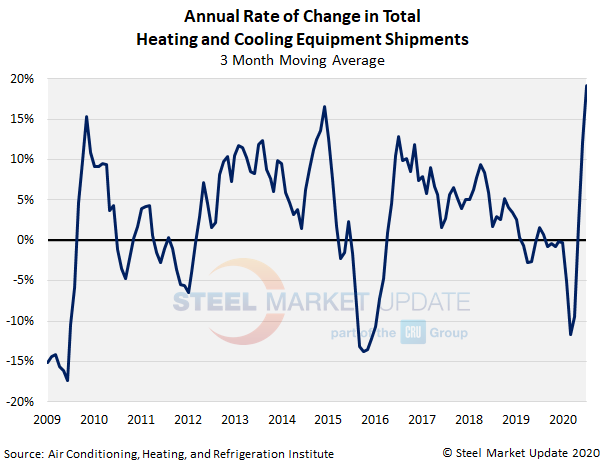
As a three-month moving average (3MMA), total heating and cooling shipments were up 19.2 percent year-over-year, following a 12.1 percent increase in August. This is the third consecutive month that 3MMA shipments have increased on a year-over-year basis since last October. Due to the uptick in Q3 shipments, this is the largest 3MMA annual rate of change seen in SMU’s limited history, surpassing the previous high of 16.6 percent in February 2014.
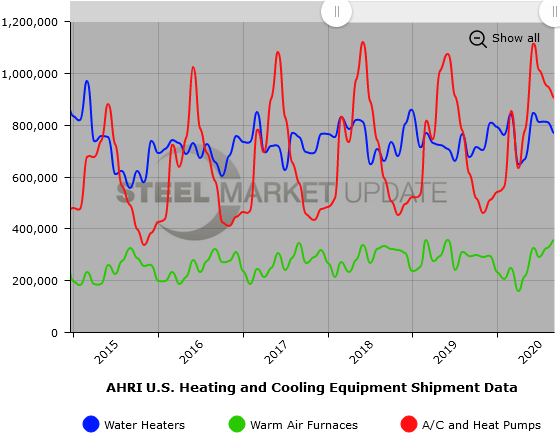
Residential and commercial storage water heater shipments increased 13.8 percent year over year to a combined 767,119 units in September; 749,339 units were shipped for residential use and 17,780 units for commercial use.
September shipments of warm air furnaces totaled 356,475 units, an increase of 22.1 percent compared to the same month last year.
Central air conditioners and air-source heat pump shipments were up 47.1 percent over levels one year ago to 902,546 total units; 573,565 air conditioners and 328,981 heat pumps were shipped in September.
The full press release is available on the AHRI website here.
Below is a graph showing the history of total water heater, warm air furnace and air conditioner shipments. To use its interactive features, view the graph on our website by clicking here. For assistance with either logging in or navigating the website, contact info@SteelMarketUpdate.com.