

Market Data

January 15, 2021
SMU Energy Analysis through Jan. 15
Written by Brett Linton
Steel Market Update is pleased to share this Premium content with Executive members. For information on how to upgrade to a Premium-level subscription, email info@steelmarketupdate.com.
The Energy Information Administration’s Jan. 12 Short-Term Energy Outlook remains subject to heightened levels of uncertainty because responses to COVID-19 continue to evolve. Reduced economic activity from the pandemic has caused a decline in 2020 energy demand and supply. The ongoing pandemic and the success of vaccination programs will continue to affect energy use in the future. After falling by 7.8% in 2020, EIA forecasts that total U.S. energy consumption will rise by 2.6% in 2021 and by 2.5% in 2022.
Spot Prices
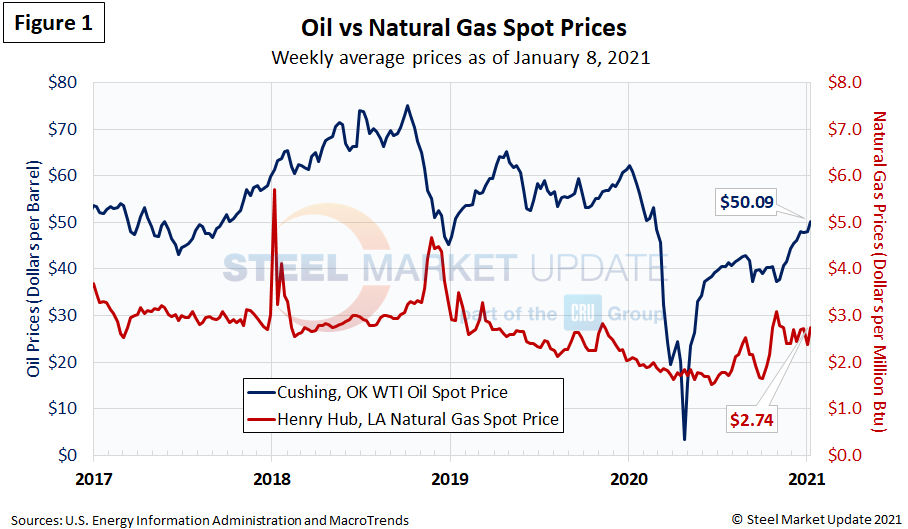
The spot market price for West Texas Intermediate (WTI) continues to rise, at $50.09 per barrel as of Jan. 8. Natural gas at the Henry Hub in Oklahoma has been relatively steady since November, priced at $2.74 per MMBTU (million British Thermal Units) as of last week.
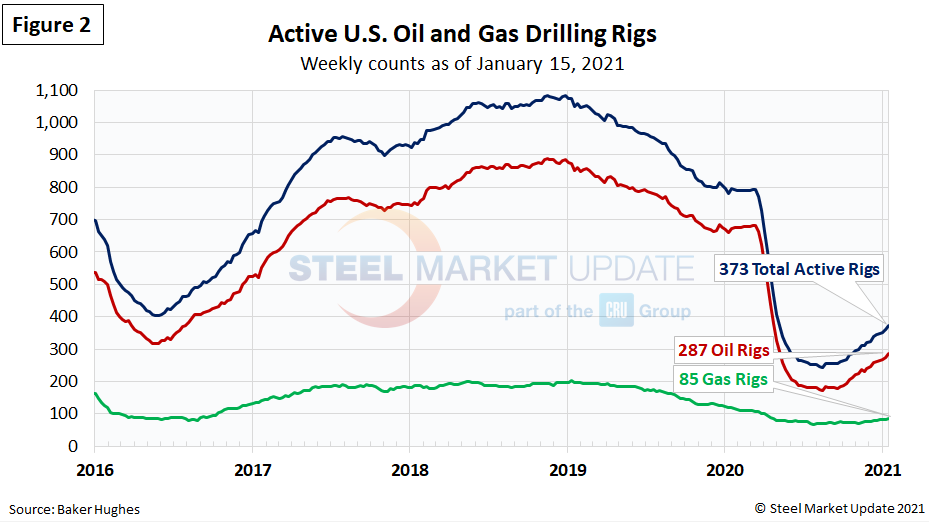
Rig Counts
The decline in active U.S. rigs drilling for oil and gas flattened in late-August and has continued to improve each week since. Last week there were 373 active drill rigs, comprised of 287 oil rigs, 85 gas rigs and 1 miscellaneous rig, according to the latest data from Baker Hughes (Figure 2). While up over recent months, active drill rigs are down 53 percent from the March peak of 793 rigs, just prior to the coronavirus shutdowns. The table below compares the current U.S., Canada and International rig counts to historical levels.
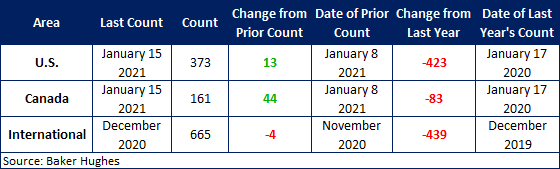
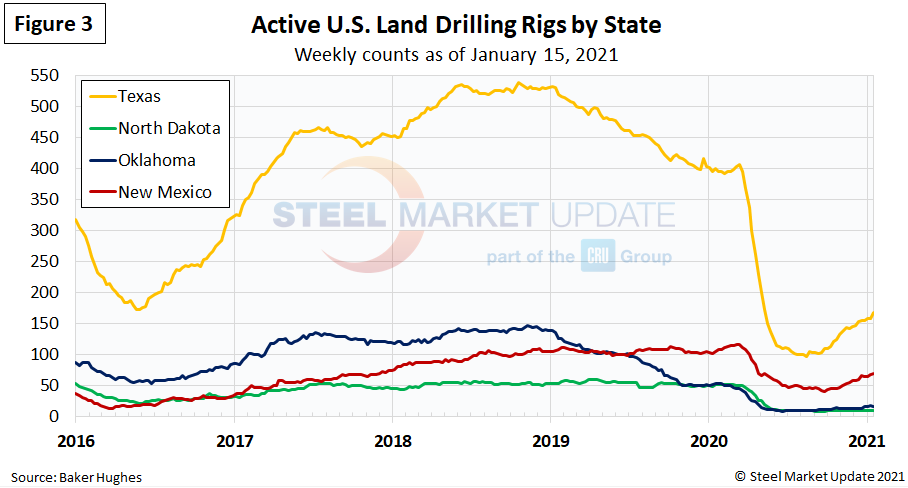
U.S. oil and gas production are heavily concentrated in Texas, Oklahoma, North Dakota and New Mexico, which have all seen declines of 40 to 80 percent since mid-March. The most active state, Texas, now has 168 active rigs in operation, the highest level seen since early May 2020. Texas rigs had plummeted from 407 in mid-March to 97 rigs in mid-August (Figure 3).
Stock Levels
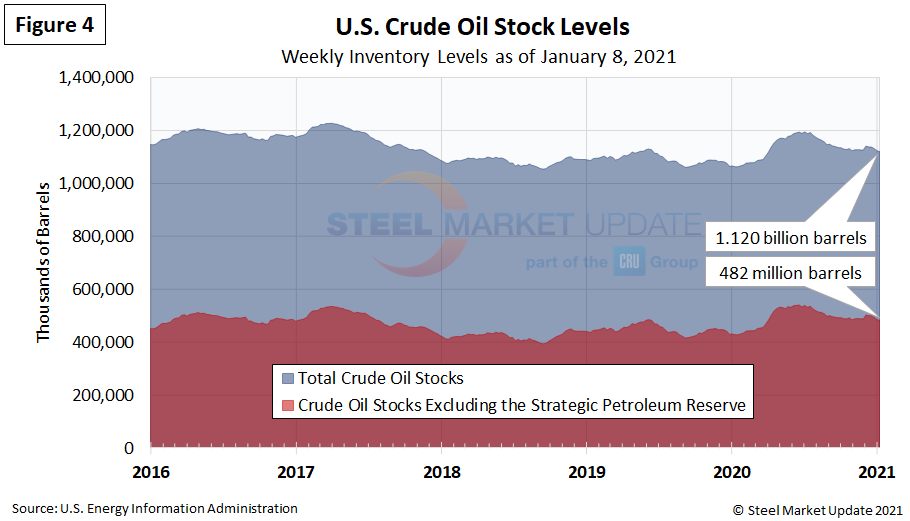
U.S. total crude oil stocks in 2020 had surged from mid-March through July, but have steadily declined since then. The latest level is 1.120 billion barrels as of Jan. 8, up from 1.063 billion barrels the same time last year (Figure 4).
Trends in energy prices and rig counts are a predictor of demand for oil country tubular products (OCTG), line pipe and other steel products.
Brett Linton, brett@steelmarketupdate.com


