

Market Data

March 9, 2021
Encouraging Progress in Fourth-Quarter GDP
Written by David Schollaert
U.S. gross domestic product (GDP) closed out 2020 on an encouraging note with annualized growth of 4.1%, based on the second estimate from the Bureau of Economic Analysis (BEA). The second estimate included upward revisions to residential fixed investment, private inventory investment, and state and local government spending, partly offset by a downward revision to personal consumption expenditures.
To put Q4 GDP in perspective, the U.S. saw the sharpest decline in history in Q2 at negative 31.4% as much of the country shut down to stymie the deadly spread of COVID-19. That was followed by a vigorous 33.4% rebound in Q3, the highest jump ever recorded, as the government intervened to stimulate the economy.
Fourth-quarter GDP totaled $21.49 trillion, up from $19.22 trillion in Q4 2019, measured in chained 2012 dollars on an annualized basis. In Figure 1, the orange line is the trailing 12-month growth and the dark blue line is the headline quarterly result. On a trailing 12-month basis, GDP was down by 2.28% in the fourth quarter, though it was an improvement from negative 9.04% in the second quarter and a negative 2.74% in the third quarter. In the same period in 2019, the trailing 12-month growth rate was positive 2.33%. For comparison, the average in 43 quarters since Q1 2010 has been a positive growth of 1.87%. The blue line in Figure 1 shows the progress of the trailing 12-month result since the first quarter of 1990.
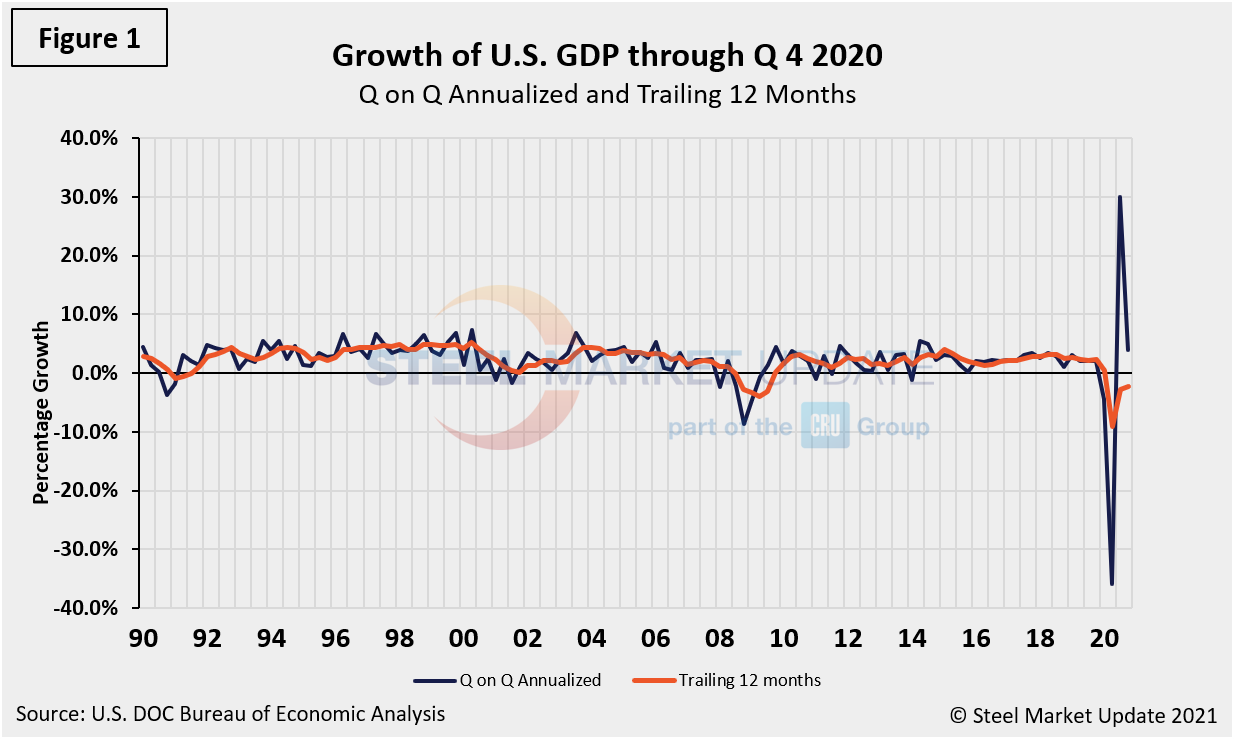
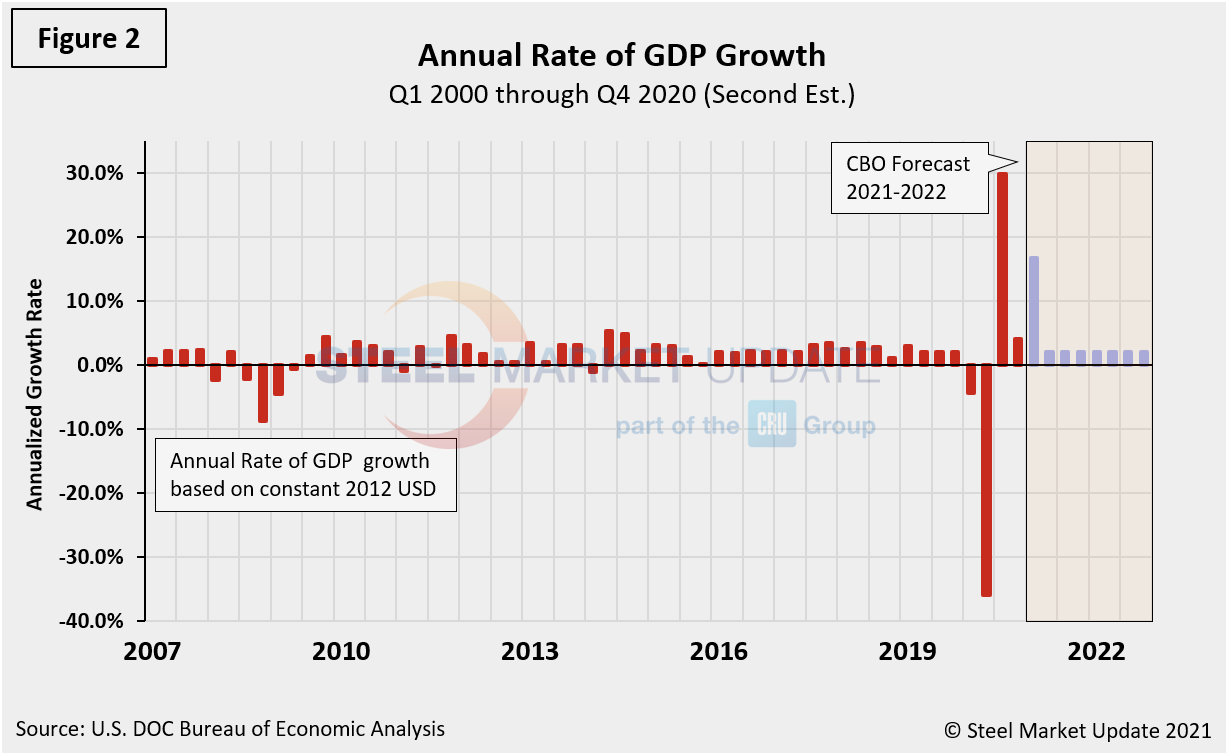
Figure 2 shows the headline quarterly results also since Q1 2007 including the Congressional Budget Office’s GDP projection through 2022.
The mix of the six major contributory components in the final GDP growth calculation is shown in Figure 3. Normally, personal consumption is the dominant growth driver as it highlights consumer confidence and spending engagement. However, fixed non-residential investment was the main driver in the Q4 second estimate with a positive 1.76%. Despite the positive mark for fixed non-residential investment, it was a decrease from 3.20% in the third quarter.
The most notable change and major source of GDP fluctuation is still personal consumption, which saw a negative 24.01% contribution in Q2, followed by a positive 25.44% contribution in Q3, but only providing a meager positive 1.61% contribution in Q4’s second estimate, a marginal decrease from 1.70% in Q4’s advance estimate. The extreme swing in percentage change on personal consumption shines a further spotlight of the COVID-19 effect on overall market sentiment and the U.S. economy. Personal consumption includes goods and services, the goods portion of which includes both durables and non-durables. Net exports and government expenditures detracted from the overall recovery, and while inventories saw a positive 1.11% growth in Q4, the category was down from a positive 6.57% in the third quarter.
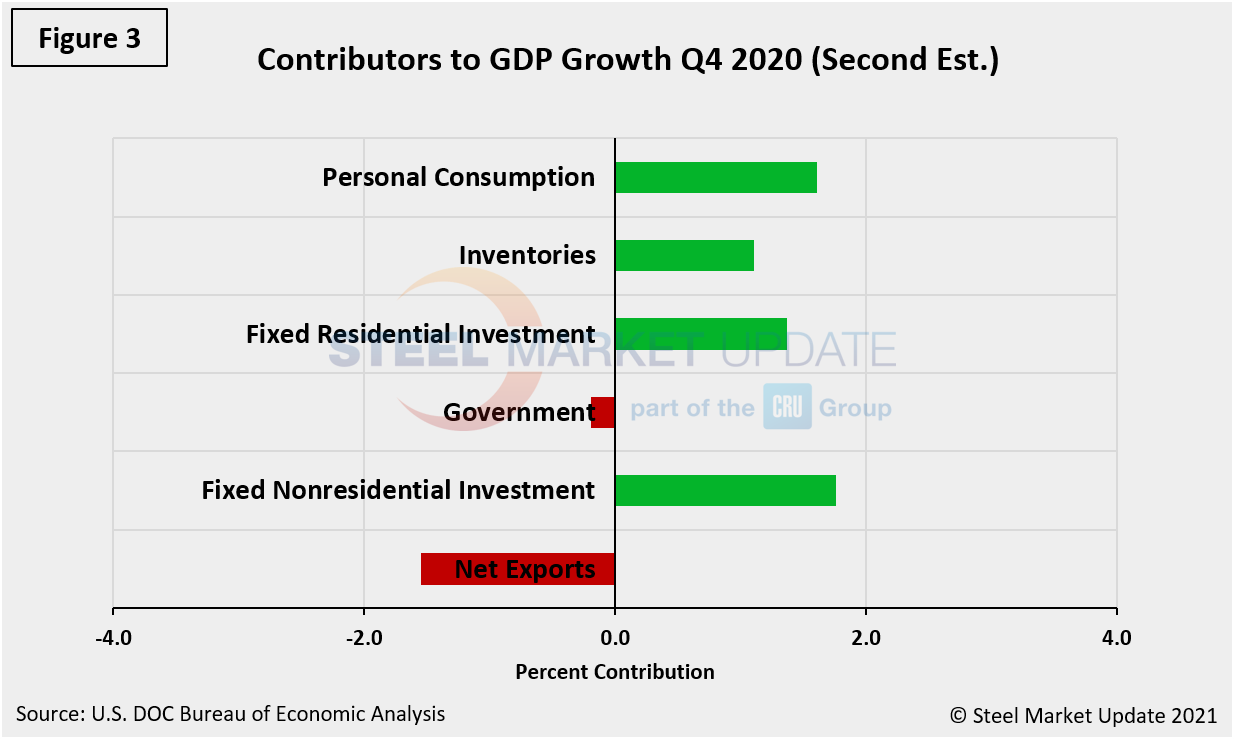
Figure 4 shows the contributions of residential and non-residential investment. These latest data points do not align well with the results of construction put in place (CPIP) data issued by the Department of Commerce at the end of 2020, as CPIP data rose significantly during that period, while the contributions of residential and non-residential investment have been marginal.
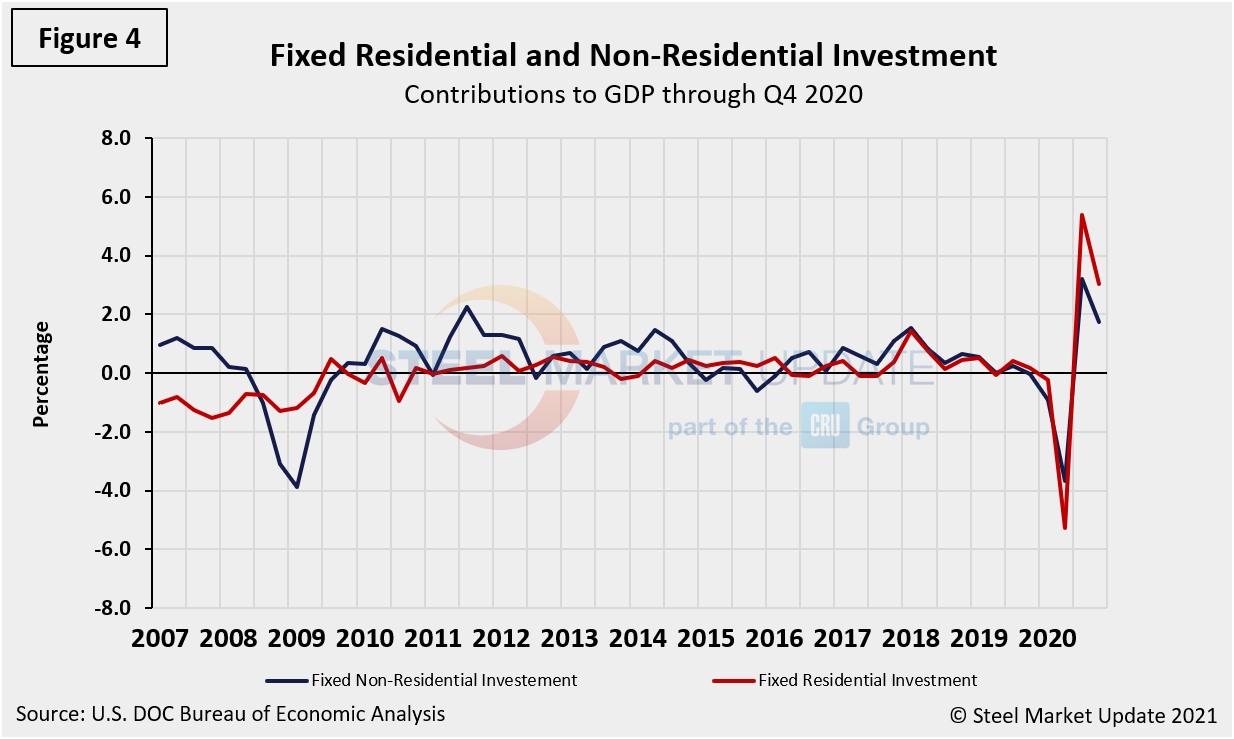
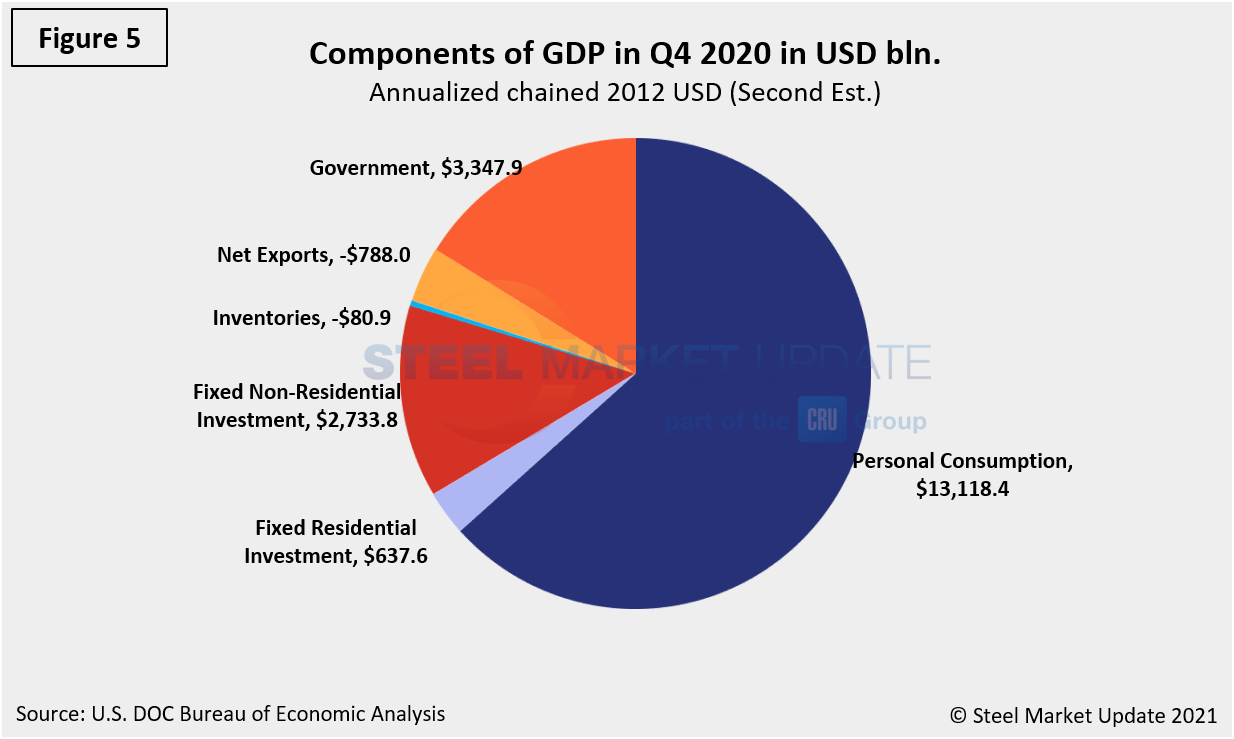
Figure 5 shows the breakdown of the $21.49 trillion economy.
SMU Comment: The increase in the fourth-quarter GDP second estimate, albeit fractional, reflected both the continued economic recovery from the sharp declines earlier in the year and the ongoing impact of the global pandemic. The full economic effects of the pandemic are still being felt and quantified; however, Q4 was unable to sustain any semblance of the record-setting 33.4% growth in the third quarter. As a result, for full year 2020, U.S. GDP fell by 3.4%, making 2020 the worst year for the economy since 1946.
By David Schollaert, David@SteelMarketUpdate.com


