

Market Data

April 8, 2021
Employment by Industry: March Job Numbers Soar
Written by David Schollaert
The U.S. labor market saw a strong surge in employment to closed out the first quarter. The U.S. Bureau of Labor Statistics (BLS) reported that employers added 916,000 to their payrolls in March, more than doubling the 379,000 jobs added in February. Following a dismal close to 2020 and a slow start in January, total non-farm employment rose by 1.295 million in February and March combined. These recent gains point to an economy recovering from the pandemic and a growing workforce that has benefited from improved vaccination efforts and lifted restrictions. Despite the added jobs this past month, however, the unemployment rate fell only slightly to 6.0%, compared to 6.2% the month prior, according to Steel Market Update’s latest analysis of the BLS data.
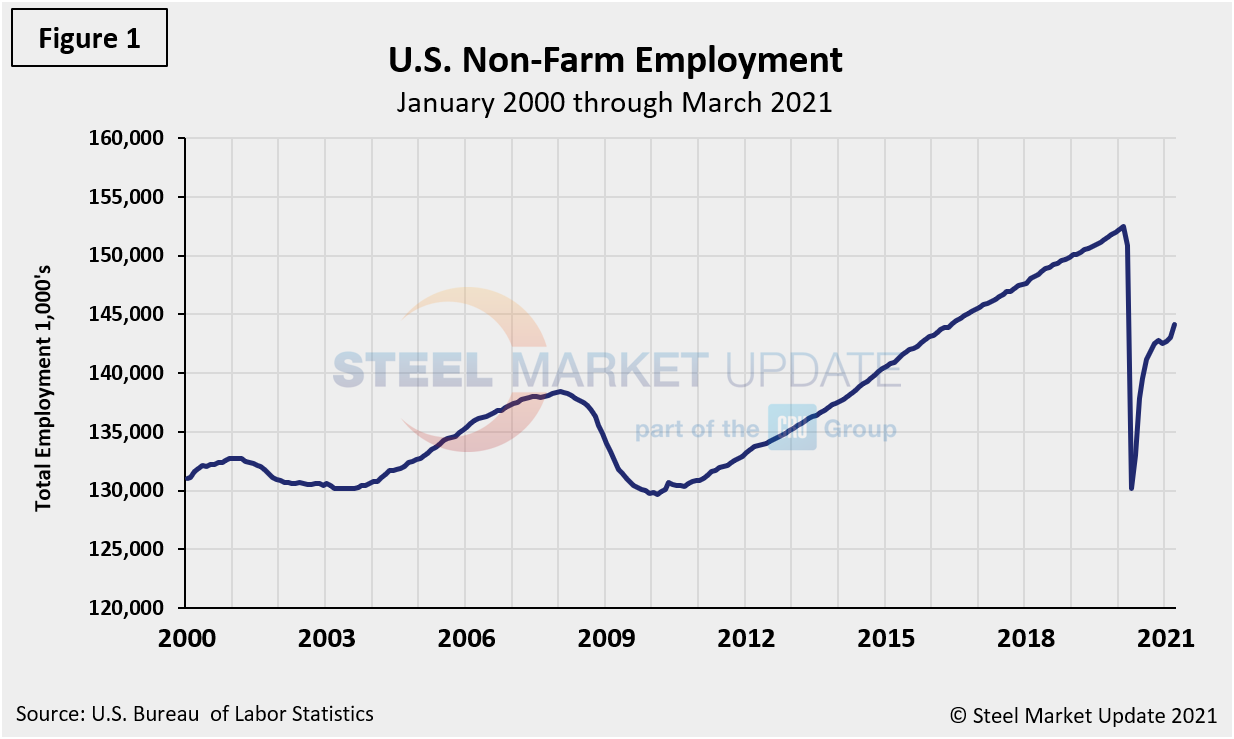
The addition of 916,000 jobs in March was the fastest gain since last summer as stronger economic growth contributed to a surge in hospitality and construction jobs. Even though the unemployment rate saw only a small decline month to month, the number of unemployed persons fell below the 10.0 million mark for the first time in 12 months, to 9.9 million. While 12.6 million people have found work since the peak of unemployment last April, the labor market still has a long way to go to return to the pre-pandemic levels of last February, when just 5.7 million were out of work and the unemployment rate was a mere 3.5%. Due to the pandemic fallout, the baseline against which future comparisons will be made is February 2020, the all-time high for nonfarm employment at 152,463,000. Figure 1 shows the total number of people employed in the nonfarm economy.
Designed on rolling time periods of 1 month, 3 months, 1 year and 2 years, the table below breaks total employment into service industries and goods-producing industries, and then into private and government employees. Most of the goods-producing employees work in manufacturing and construction. Comparing service industries and goods-producing in March shows service jobs have increased by 0.7%, while goods-producing rose by 1.0% from February’s result. Note, the subcomponents of both manufacturing and construction shown in this table don’t add up to the total because we have only included those with the most relevance to the steel industry.
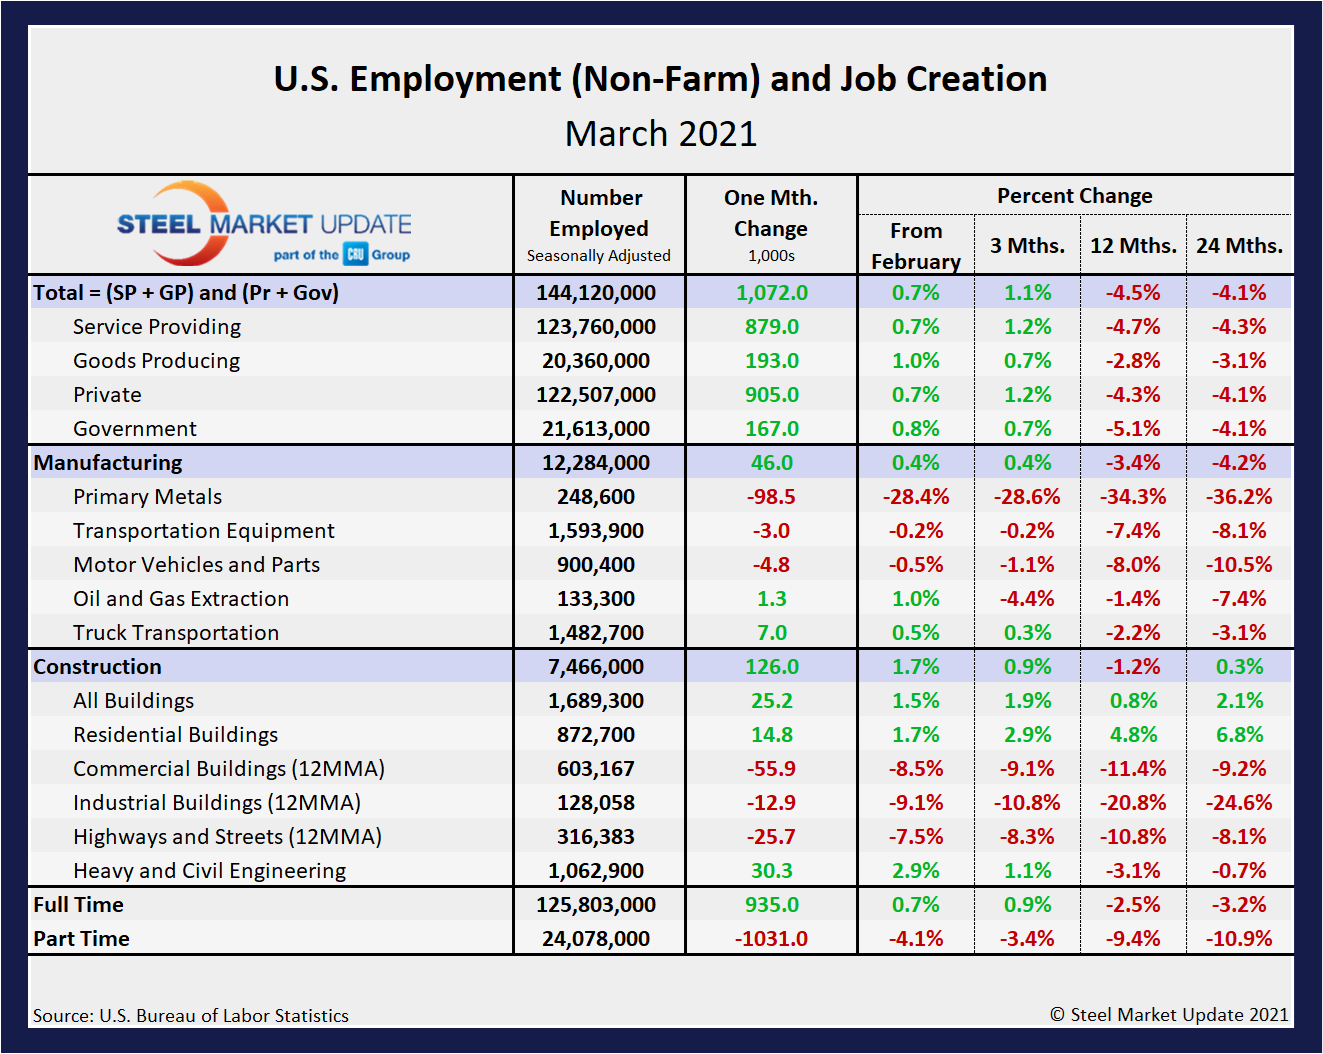
Comparing March to February, manufacturing employment was up by 0.4% versus 0.2% the month prior. Construction was up 1.7% with the addition of 126,000 new jobs, a major seasonal shift after repeated decreases over the past few months. Despite the repeated increases in February and March, 3-month, 12-month and 24-month comparisons are problematic due to the extensive loss resulting from COVID-19. In the year-over-year contrast, manufacturing was down 3.4% and construction 1.2%. The trend is expected to remain on a rising trajectory as we move farther away from the freefall last April.
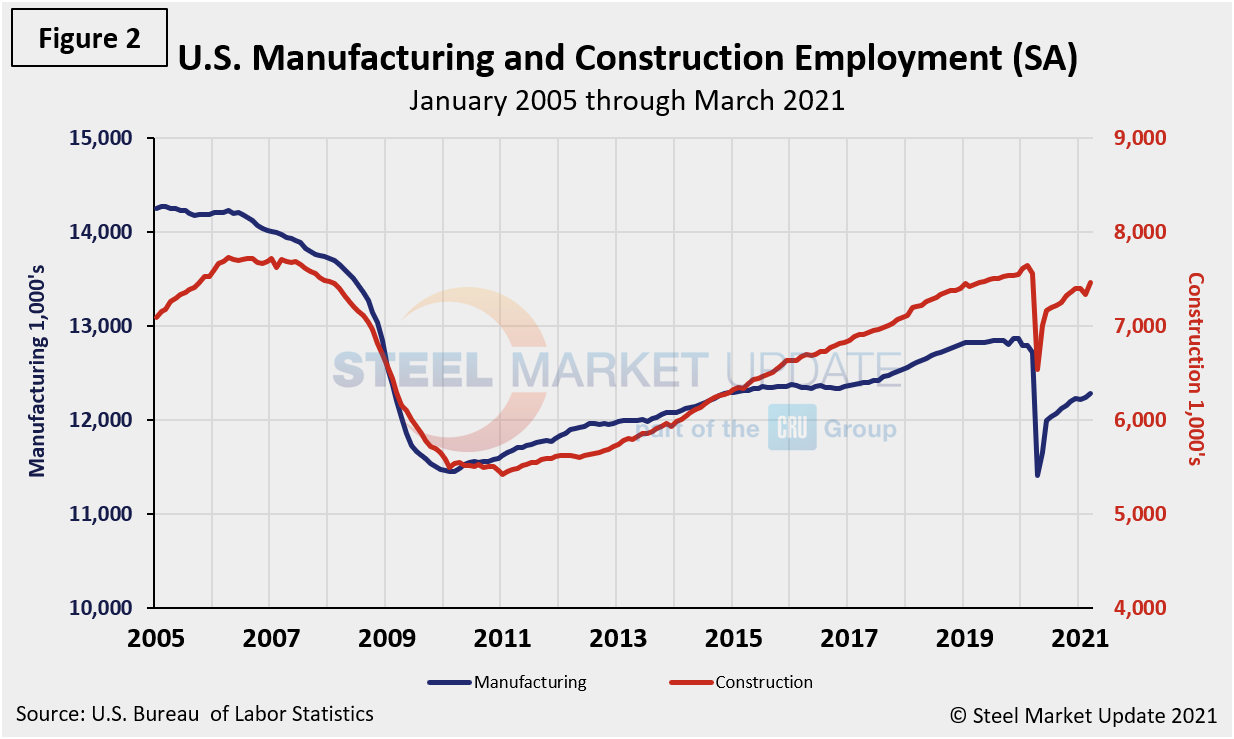
Manufacturing employment increased by 46,000 in March, led by a gain of 7,000 in transportation equipment. Construction rose by 126,000, led by heavy and civil engineering at 30,300 new jobs, followed by general commercial and residential buildings, according to the BLS data. Improved weather across much of the country has aided the employment growth in construction, with further increases likely in the near-term. Employment in the industry is now 91,000 below year-ago levels, but a vast improvement from the negative 308,000 just last month. Mining lost 98,5000 jobs in March, while transportation equipment and motor vehicles and parts also saw losses. Figure 2 shows the history of employment in manufacturing and construction since January 2005.
The reported number of unemployed manufacturing and construction workers is shown in Figure 3. These were 780,000 and 835,000, respectively, at the end of March.

Explanation: On the first or second Friday of each month, the Bureau of Labor Statistics releases the employment data for the previous month. Data is available at www.bls.gov. The BLS employment database is a reality check for other economic data streams such as manufacturing and construction. It is easy to drill down into the BLS database to obtain employment data for many subsectors of the economy. The important point about all these data streams is not necessarily the nominal numbers, but the direction in which they are headed.
By David Schollaert, David@SteelMarketUpdate.com


