

Market Data

April 8, 2021
U.S. Job Creation Jumps in March
Written by David Schollaert
The U.S. economy added 916,000 jobs in March, posting increases for a second consecutive month and pushing well ahead of early estimates, reported the Bureau of Labor Statistics (BLS). Gains were strongest in leisure and hospitality, while construction jumped by 126,000. Following a depressing close to 2020 and a loss of 447,000 jobs in January, total nonfarm employment soared by 1.295 million in February and March combined. Figure 1 shows the total number of nonfarm employed people in the U.S. since 2000.
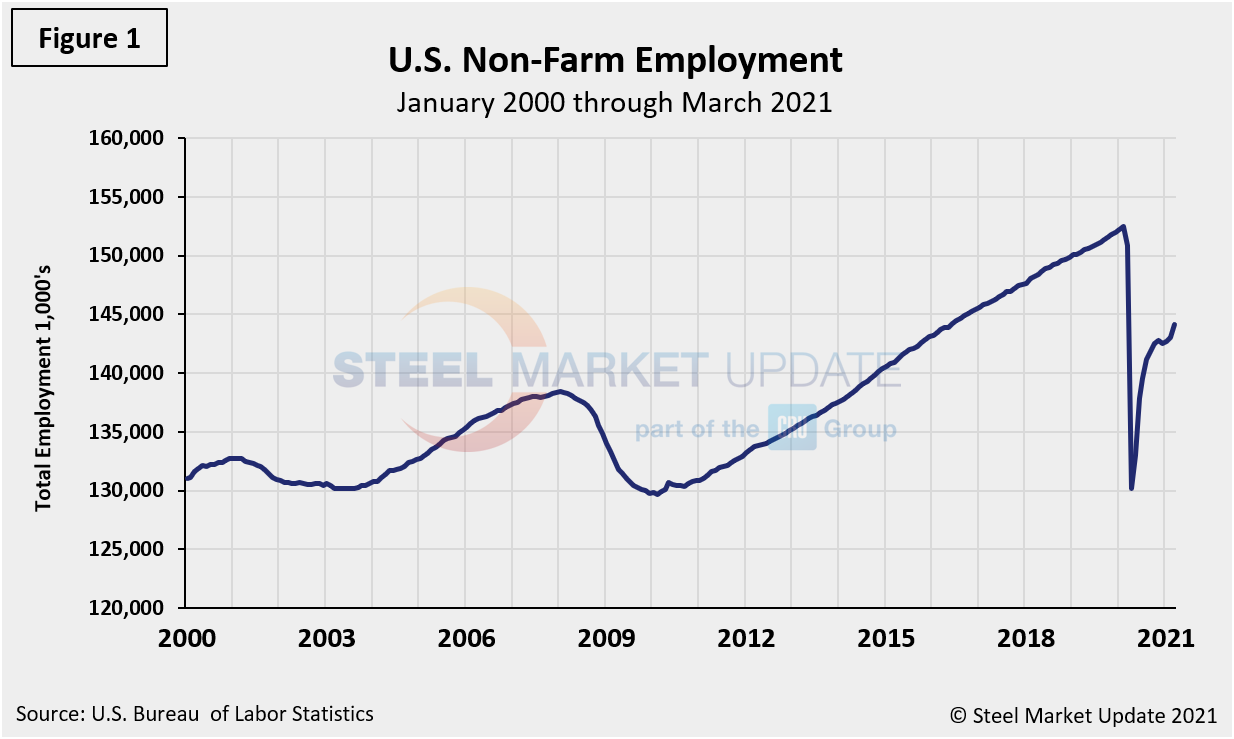
“Total nonfarm payroll employment rose by 916,000 in March, and the unemployment rate edged down to 6.0 percent,” the BLS stated. “These improvements in the labor market reflect the continued resumption of economic activity that had been curtailed due to the pandemic. Job growth was widespread in March, led by gains in leisure and hospitality, public and private education, and construction.
“The unemployment rate edged down to 6.0 percent in March. The rate is down considerably from its recent high in April 2020, but is 2.5 percentage points higher than its pre-pandemic level in February 2020. The number of unemployed persons, at 9.7 million, seasonally adjusted, continued to trend down in March, but is 4.0 million higher than in February 2020,” the BLS said.
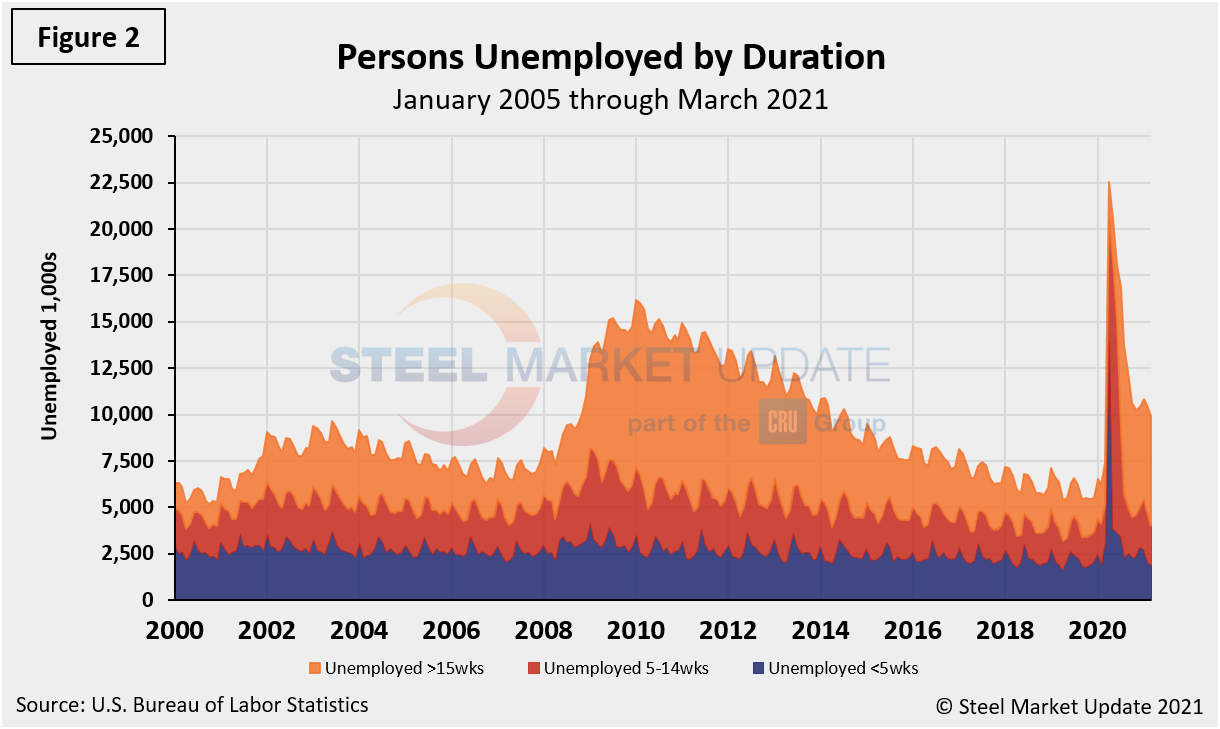
The historical picture for the duration of unemployment since January 2000 is broken down into < 5 weeks, 5 to 14 weeks, and > 15 weeks, noted below in Figure 2. The total number unemployed was 9,905,000 at the end of March, a decrease of 581,000 compared to February, but still 12,599,000 less than May 2020’s historical high. As of April 8, 59.4% had been unemployed for more than 15 weeks, 21.7% for 5 to 14 weeks and 18.9% for less than 5 weeks.
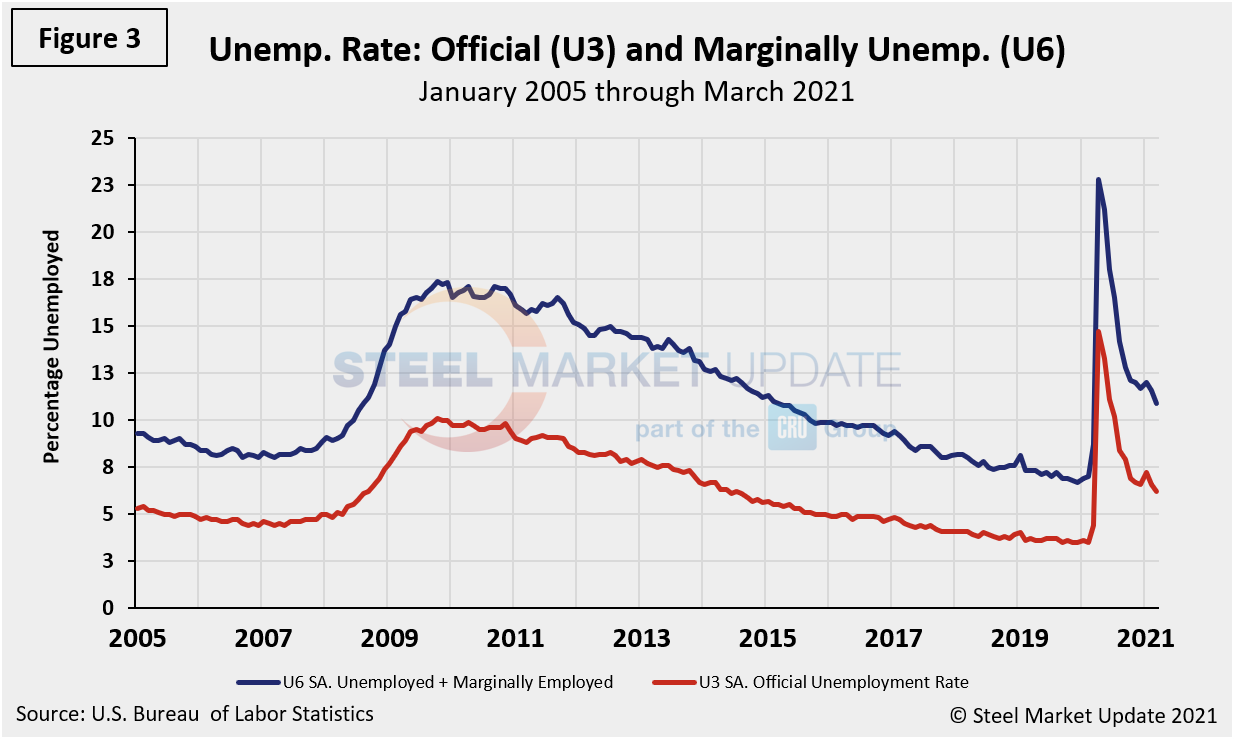
The official unemployment rate, U3, reported in the BLS Household survey (see explanation below) increased from 3.5% in February 2020 to 14.7% in April 2020 and then recovered to 6.2% in March 2021. The more comprehensive U6 unemployment rate, at 10.9% last month, improved from 22.8% last April (Figure 3). U6 includes individuals working part time who desire full-time work and those who want to work but are so discouraged they have stopped looking.
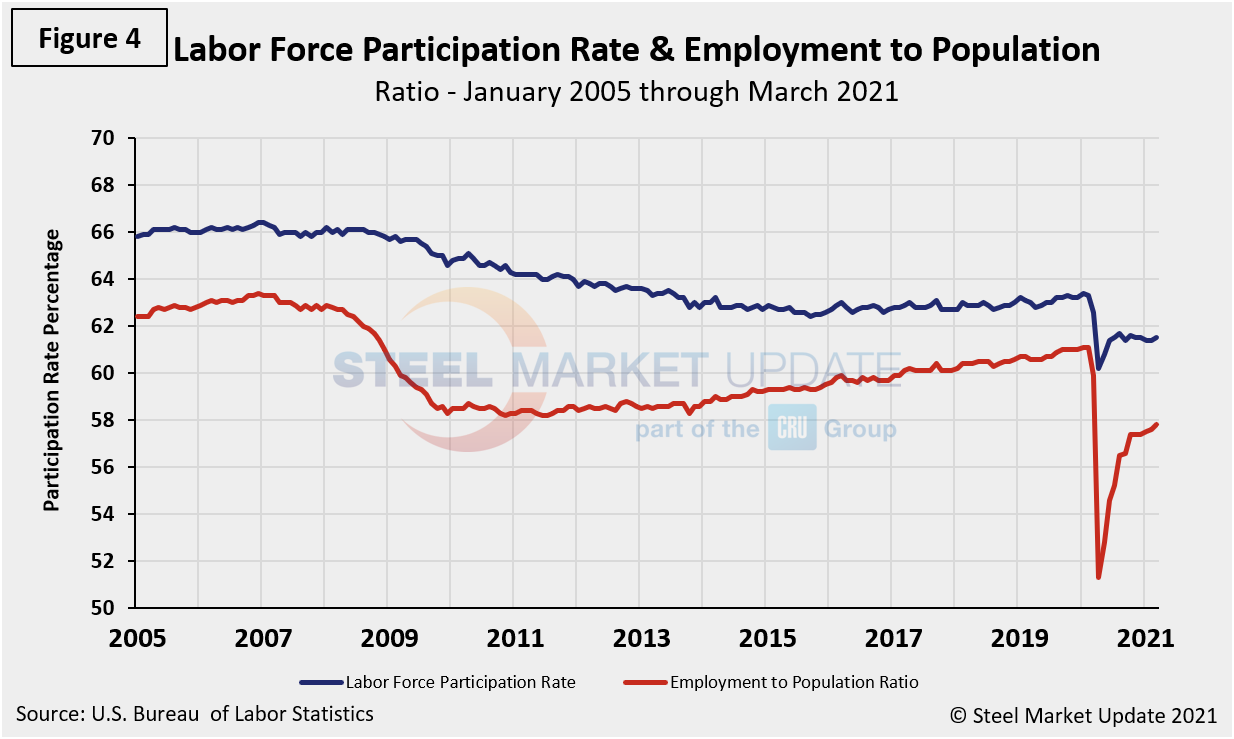
The labor force participation rate is calculated by dividing the number of people actively participating in the labor force by the total number of people eligible to participate. This measure was 61.5% in March, up 0.1% month on month, but just marginally up from 60.2% last April shortly after the pandemic shocked the economy, and it’s still lagging the pre-pandemic measure of 63.3% last February. Another gauge and more definitive view are the number employed as a percentage of the population. Last month, the employment-to-population ratio was 57.8%, a marginal change of 0.2% higher month on month, but up from the low point of 51.3% last April. Figure 4 shows both measures on one graph.
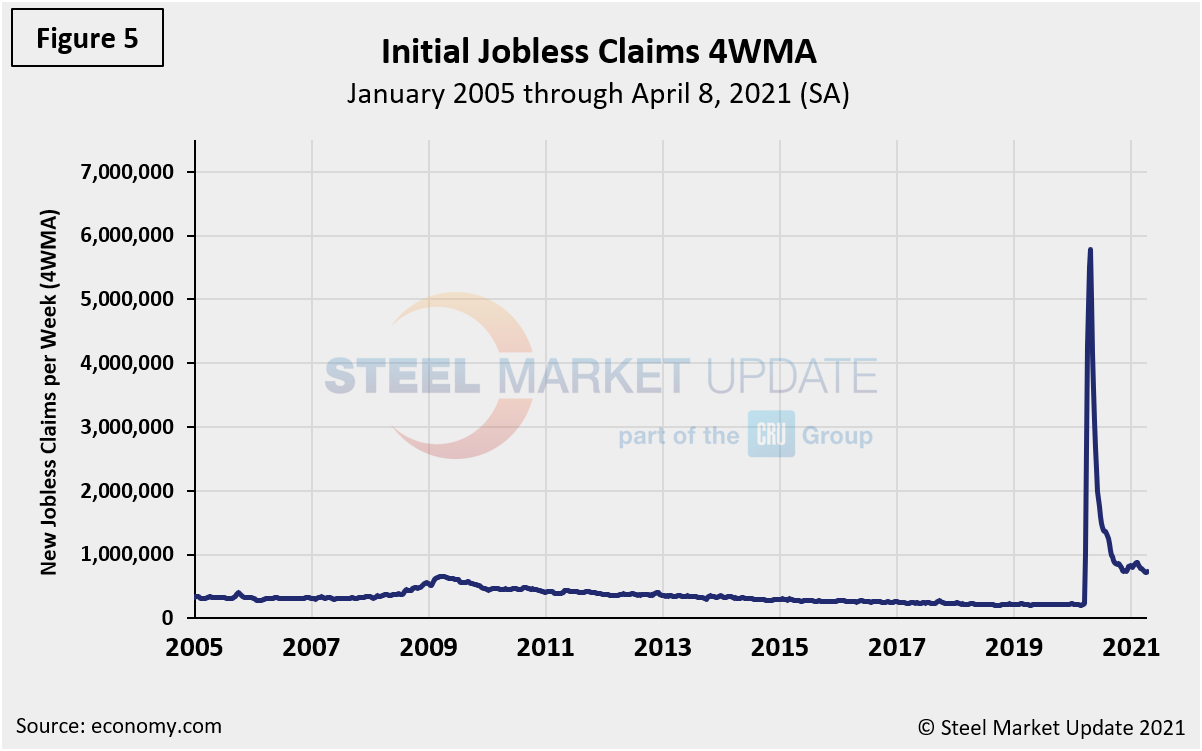
Initial claims for unemployment insurance, which are reported weekly by the Department of Labor, have been choppy in recent weeks with little sign of improvement. New filings rose from an upwardly revised 728,000 to 744,000 in the week ended April 3 despite the consensus expecting a decline to well below 700,000. Continuing claims barely budged, dropping from 3.75 million to 3.73 million in the week ended March 27. The number of those filing for Pandemic Unemployment Assistance dropped by more than 85,000 in the week ended April 3 to 151,752, the lowest total since these benefits were first introduced in April 2020. In total, initial claims remain below the 1.0 million threshold for the third straight week after clocking in higher every week since the pandemic began. Figure 5 shows the four-week moving average of new claims since January 2007.
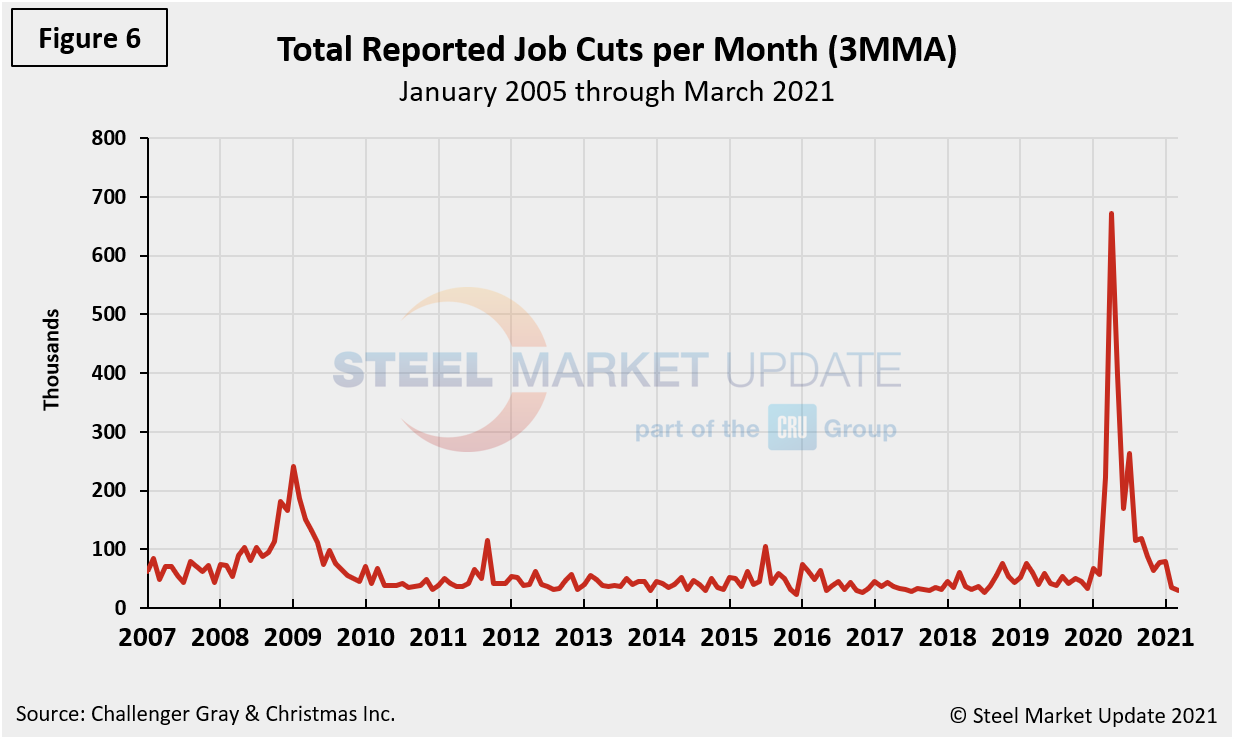
Human resources consulting firm Challenger, Gray and Christmas Inc. produces a monthly employment update for the U.S. It reported that job cuts in March were 30,630, down 11% from the 34,513 reported in February. It is the lowest monthly total since July 2018 when 27,122 cuts were recorded, and a far cry from the 671,100 seen at the peak of the pandemic in April 2020. Additionally, March’s total is 86% lower versus the same month last year when 222,288 job cuts announced as the fallout from the COVID-19 lockdowns began to impact businesses across the country. Through first-quarter 2021, 144,686 job cuts have been announced, 58% lower than the 346,683 announced in the first quarter of 2020. The three-month moving average (3MMA) has declined in each of the last nine months.
“We have now marked one year since the first wave of layoffs occurred due to the pandemic and subsequent lockdowns,” Challenger reported. “It appears we have entered a recovery phase where job eliminations are slowing, and companies are able to predict and assess where growth will occur.”
Figure 6 shows the monthly job cuts reported by Challenger on a 3MMA basis since January 2007.
Explanation: On the first Friday of each month, the Bureau of Labor Statistics releases the employment data for the previous month. Data is available at www.bls.gov. The BLS reports on the results of two surveys. The Establishment survey reports the actual number employed by industry. The Household survey reports on the unemployment rate, participation rate, earnings, average workweek, the breakout into full-time and part-time workers and lots more details describing the age breakdown of the unemployed, reasons for and duration of unemployment.
By David Schollaert, David@SteelMarketUpdate.com


