

Prices

April 12, 2021
U.S. Steel Exports Flat in February
Written by Brett Linton
After recovering 9% in January, U.S. steel exports rose 1% in February to 677,000 tons, according to recent U.S. Department of Commerce data. Of our six monitored product groups, the greatest month-over-month increase in exports went to cold rolled products, followed by hot rolled steel, while plate and other metallic coated exports declined. Total February 2021 exports were within 1,300 tons of February 2020 levels.
Recall that 2020 saw quite a swing in monthly export levels; the year started strong, nearing 700,000 tons in February through March. Then the COVID downturn choked exports in April and May, with May levels reaching the lowest seen in SMU’s 24-year data history at 374,000 tons. Monthly export levels recovered each month afterward through October, reaching a 2.5-year high of 730,000 tons, but slowed again through the remaining months of the year.
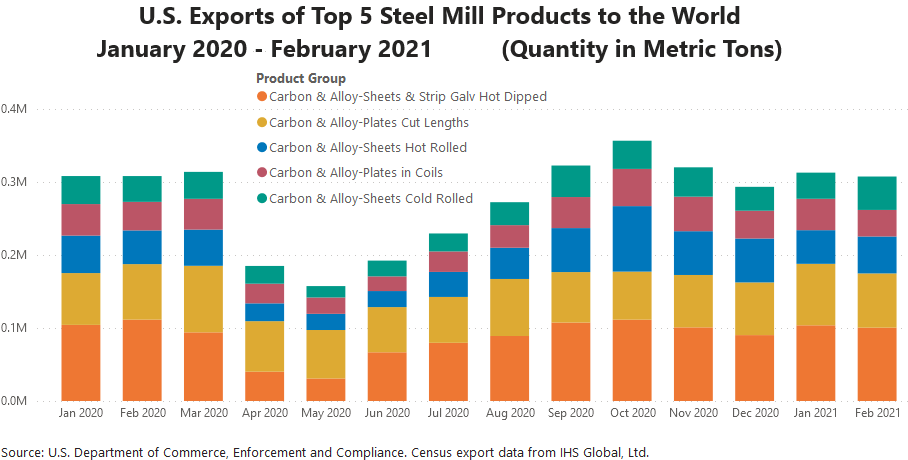
The 2020 monthly average for exports was 591,000 tons, below both the 2019 monthly average of 648,000 tons and the 2018 monthly average of 775,000 tons.
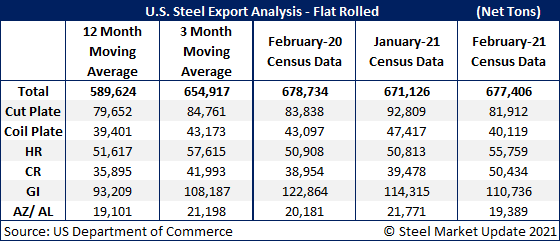
Total February exports were above the three-month moving average (average of December 2020 through February 2021), and above the 12-month moving average (average of March 2020 through February 2021). Here is a detailed breakdown by product:
Cut plate exports were down 12% from January to 81,912 tons, down 2% compared to one year ago.
Exports of coiled plate were 40,119 tons in February, down 15% over the prior month, and down 7% from levels seen one year earlier.
Hot rolled steel exports were up 10% from January to 55,759 tons, also up 10% from the prior year.
Exports of cold rolled products were 50,434 tons in February, up 28% from January, and up 29% from the same time last year.
Galvanized exports decreased 3% month over month to 110,736 tons. Compared to levels one year ago, February was down 10%.
Exports of all other metallic coated products were 19,389 tons, down 11% from January, and down 4% year-over-year.
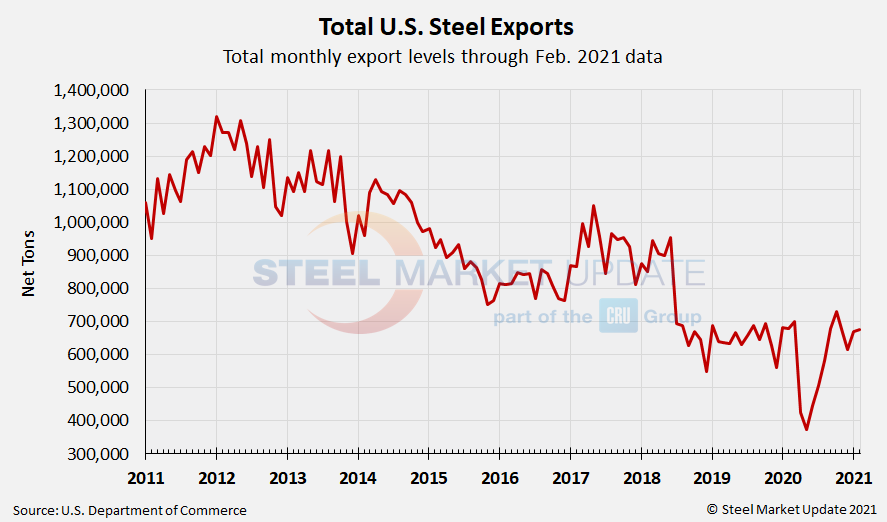
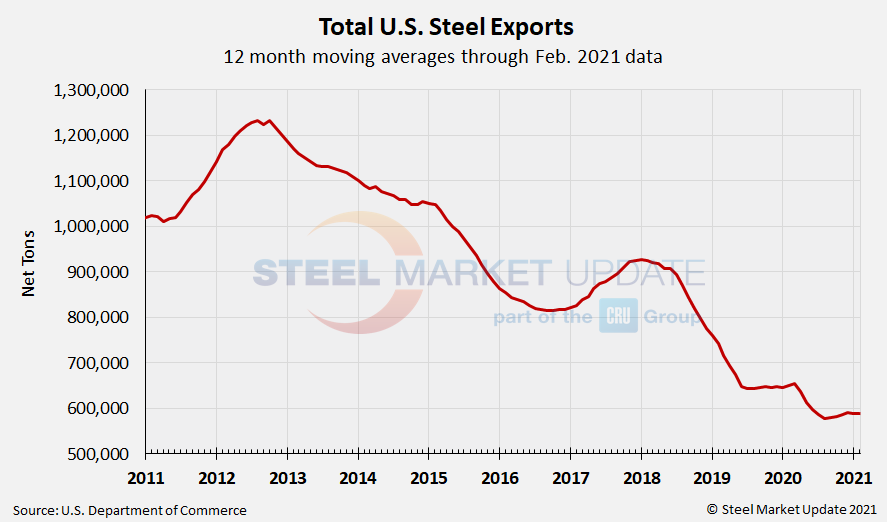
Below are two graphs showing the history of total U.S. steel exports through the latest final data, one with unadjusted monthly figures and the other with data displayed as a 12-month moving average. We also have interactive graphics available on our website here. If you need assistance logging into or navigating the website, contact us at Info@SteelMarketUpdate.com.
By Brett Linton, Brett@SteelMarketUpdate.com


