

Market Data

May 10, 2021
U.S. Job Creation Disappoints in April
Written by David Schollaert
The U.S. economy added just 266,000 jobs in April, a disappointment following stronger-than-expected growth in February and March and well below earlier estimates, reported the Bureau of Labor Statistics (BLS). Although far fewer workers were added to the payroll than the 1.0 million forecast by economists, there were some notable job gains in leisure and hospitality, pointing towards progress in the reopening efforts across the U.S. marketplace.
Manufacturing employment edged down in April by 18,000, following gains of 89,000 over the previous two months. Manufacturing payrolls remain 515,000 less than the pre-pandemic totals in February 2020. Employment in construction was unchanged over the month. Year on year, construction employment is up by 917,000 workers, but it’s still 196,000 below its February 2020 level pre-pandemic. Figure 1 shows the total number of nonfarm employed people in the U.S. since 2000.
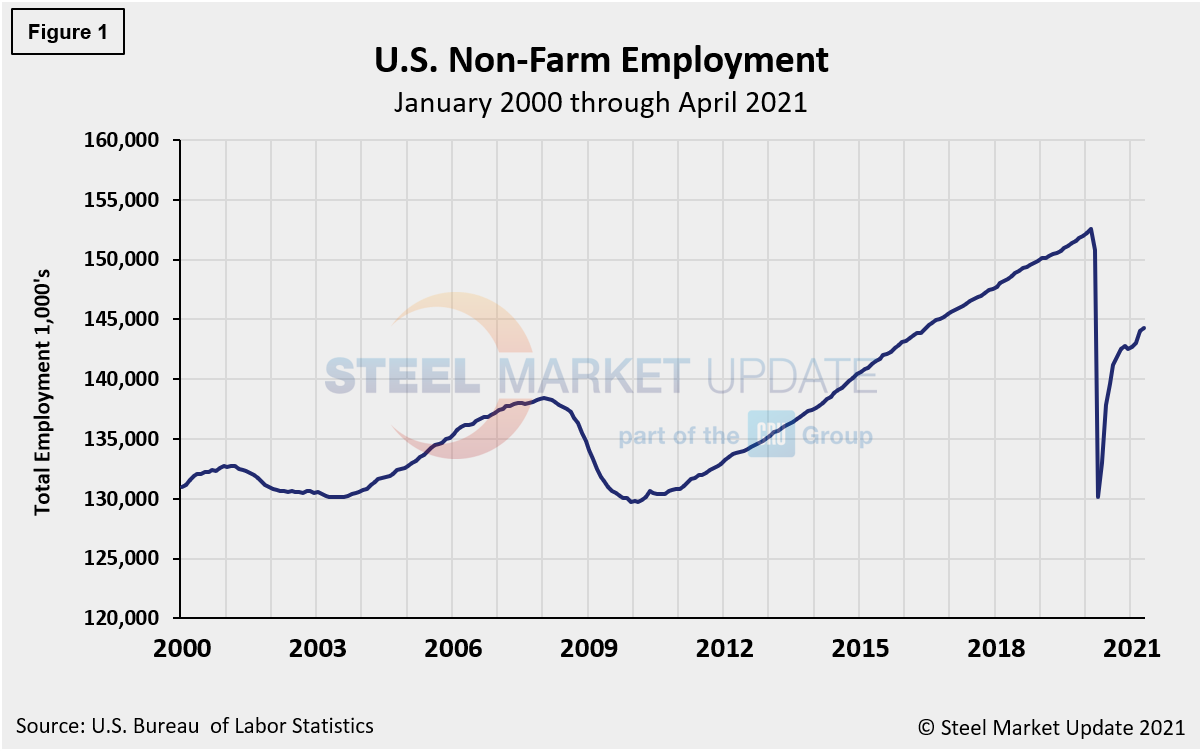
“Total nonfarm payroll employment increased by 266,000 in April, following increases of 770,000 in March and 536,000 in February,” the BLS said. “In April, nonfarm employment is down by 8.2 million, or 5.4%, from its pre-pandemic level in February 2020. In April, employment in leisure and hospitality increased by 331,000, as pandemic-related restrictions continued to ease in many parts of the country.
“More than half of the increase was in food services and drinking places. Job gains also occurred in amusements, gambling, recreation and in accommodation. Although leisure and hospitality has added 5.4 million jobs over the past 12-months, employment in the industry is down by 2.8 million, or 16.8%, compared with February 2020,” the BLS added.
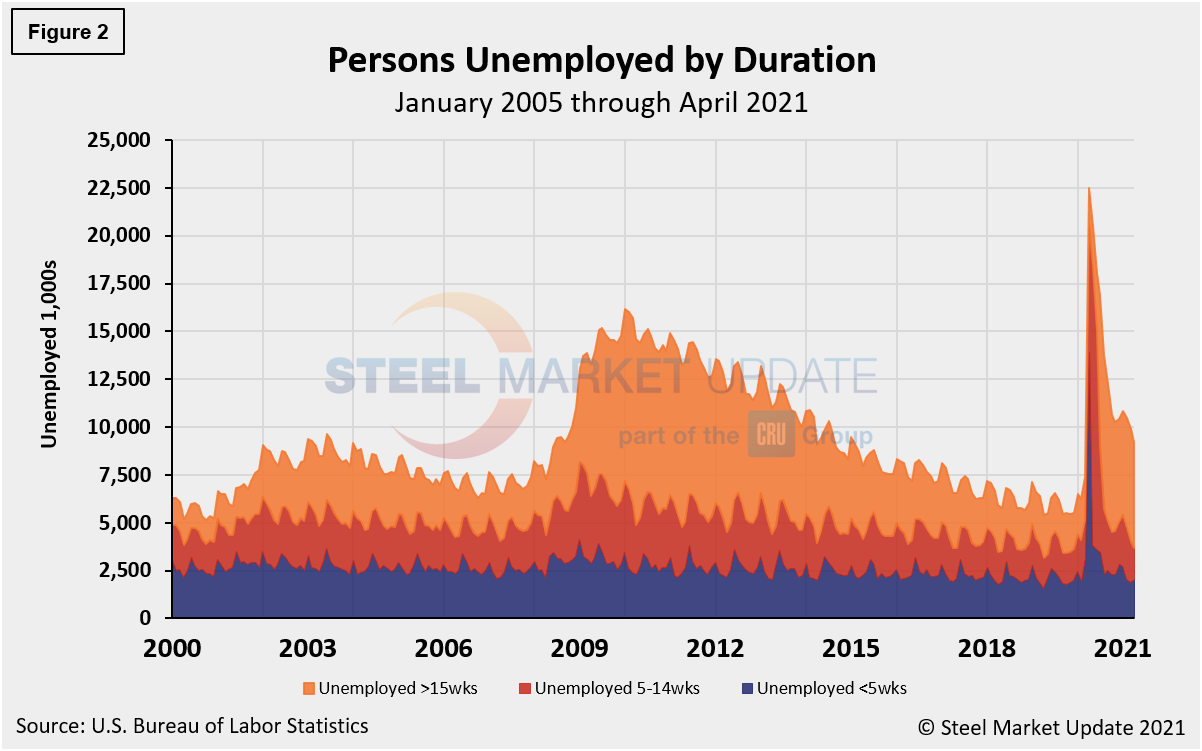
The historical picture for the duration of unemployment since January 2000 is broken down into < 5 weeks, 5 to 14 weeks, and > 15 weeks, noted below in Figure 2. The total number unemployed was 9,220,000 at the end of April, a decrease of 685,000 unemployed persons compared to March. Although unemployment remains above pre-pandemic levels by nearly 3.0 million people, about 11.3 million more people now have jobs compared to the 22.5 million thrown out of work at the worst of the pandemic in the spring of 2020. As of May 10, 59.9% had been unemployed for more than 15 weeks, 18.1% for 5 to 14 weeks and 22% for less than 5 weeks.
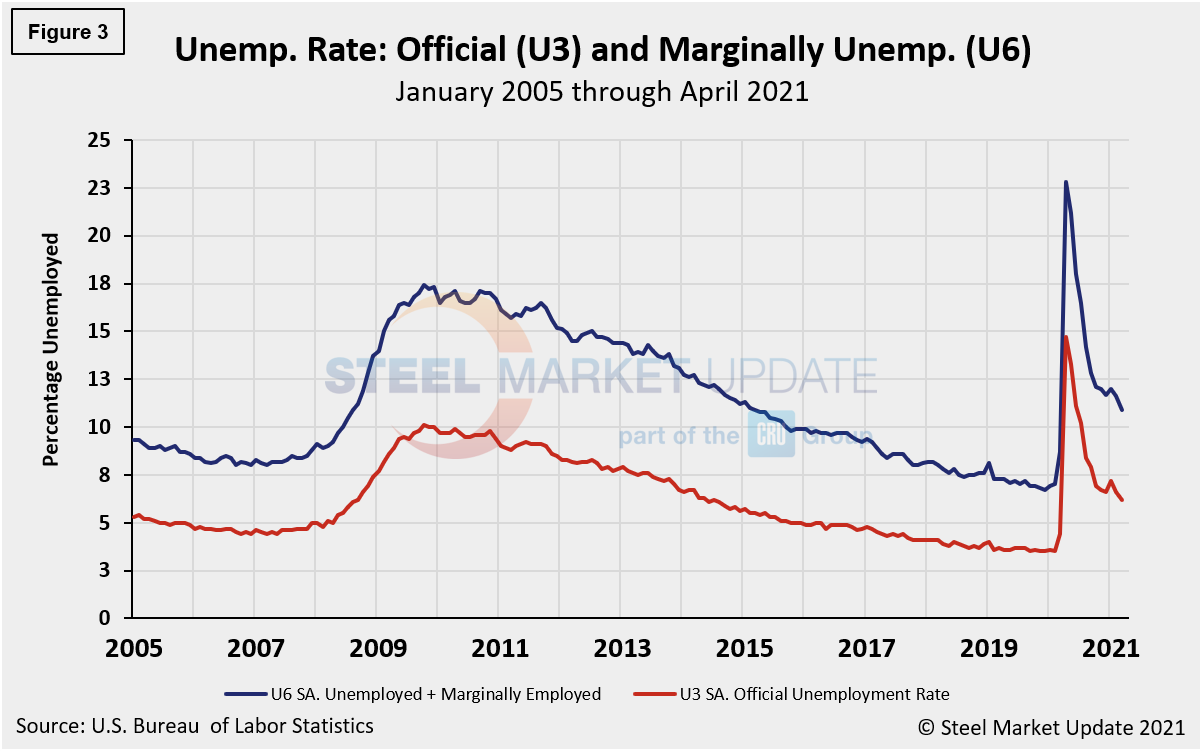
The official unemployment rate, U3, reported in the BLS Household survey (see explanation below) increased from 3.5% in February 2020 to 14.7% in April 2020, but then recovered to 6.1% in April 2021. The more comprehensive U6 unemployment rate, at 10.4% last month, was a big improvement from 22.8% last April (Figure 3). U6 includes individuals working part time who desire full-time work and those who want to work but are so discouraged they have stopped looking.
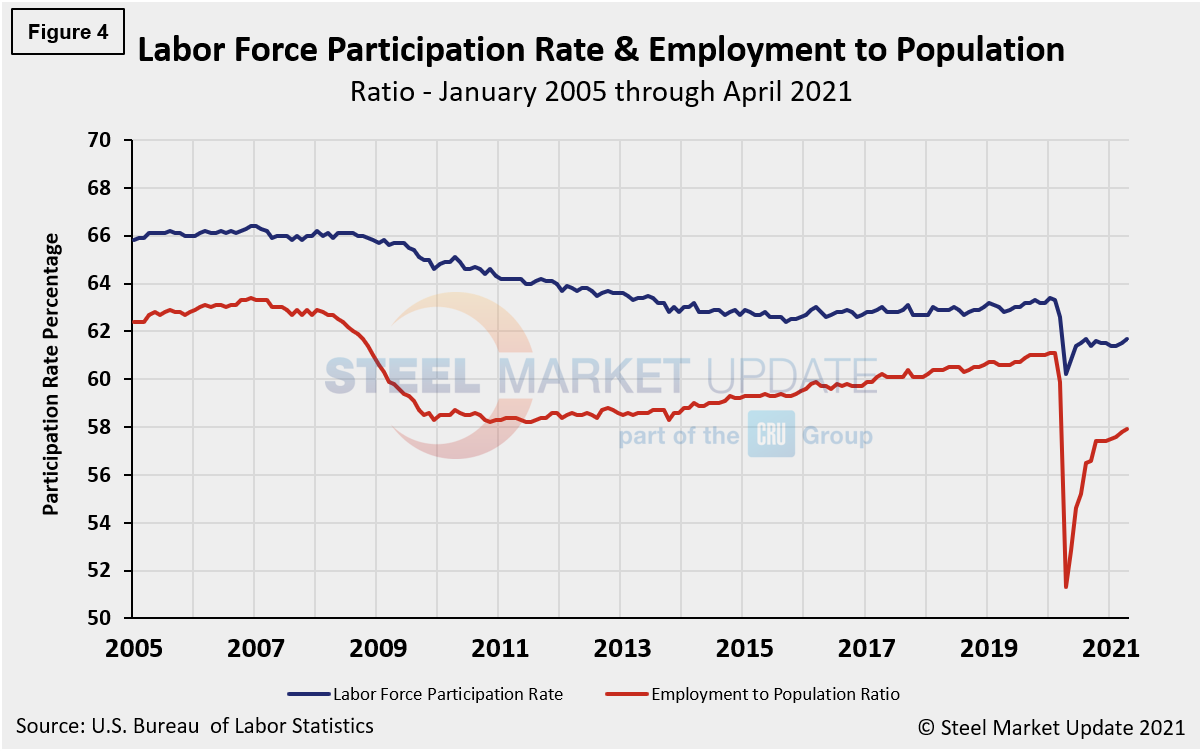
The labor force participation rate is calculated by dividing the number of people actively participating in the labor force by the total number of people eligible to participate. This measure was 61.7% in April, up 0.2% from the month before, and still just marginally up from 60.2% last April shortly after the pandemic drove the economy into a tailspin. The measure still lags the pre-pandemic reading of 63.3% reported in February 2020. Another gauge and more definitive view are the number employed as a percentage of the population. Last month, the employment-to-population ratio was 57.9%, a marginal change of 0.1% higher month on month, but up from the low point of 51.3% last April. Figure 4 shows both measures on one graph.
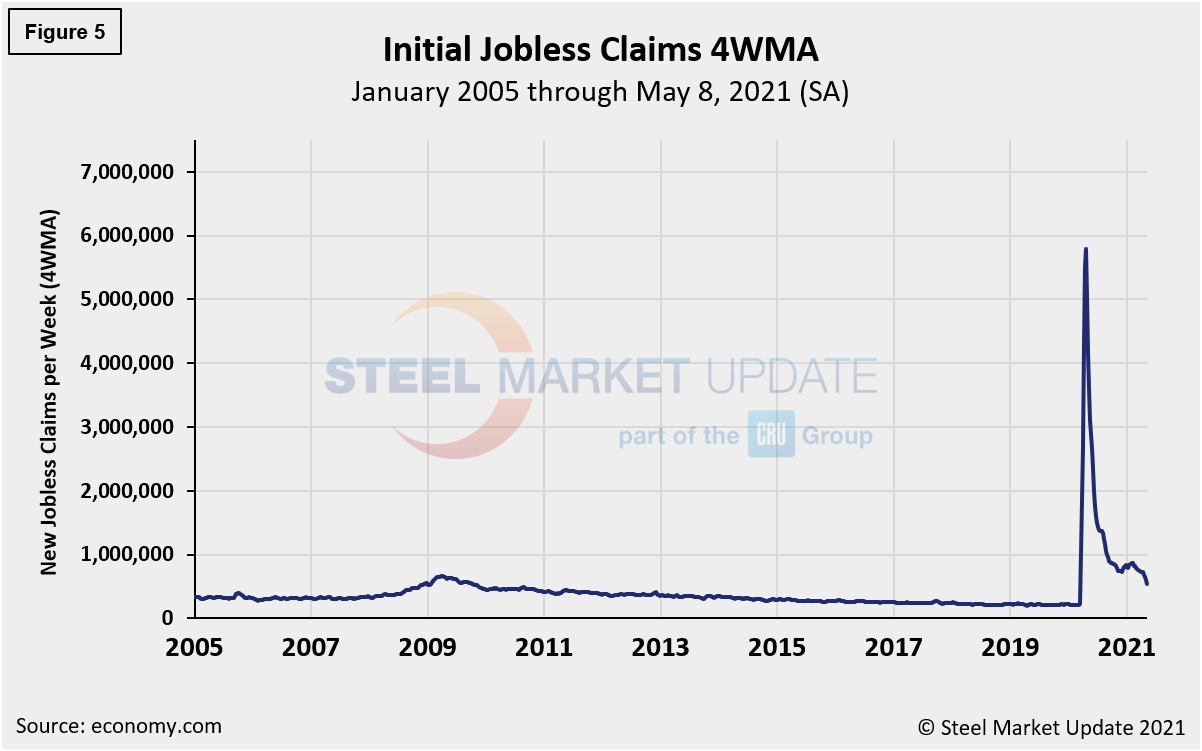
Initial claims for unemployment insurance, which are reported weekly by the Department of Labor, have been on a steady decline in recent weeks, signaling optimism for the labor market. New filings totaled 498,000 in the week ending May 8, down from 744,000 a month ago, and besting consensus expectations for a more modest decline, according to Economy.com. Continuing claims barely budged, rising from 3.65 million to 3.69 million in the week ended April 24. The number of those filing for Pandemic Unemployment Assistance dropped by about 20,000 in the week ended May 1 to 101,214, the lowest total since these benefits were first introduced in April 2020. Total initial claims are now around 600,000, by far the lowest level since the pandemic began, providing additional evidence that the labor market is gaining momentum. Figure 5 shows the four-week moving average of new claims since January 2007.
Human resources consulting firm Challenger, Gray and Christmas Inc. produces a monthly employment update for the U.S. It reported that job cuts in April were 22,913, down 25.0% from 30,630 reported in March. This is the lowest monthly total since July 2000 when 17,241 cuts were recorded. April’s total is down 96.6% from the 671,100 job cuts seen at the peak of the pandemic in April 2020, the highest monthly total on record. Year to date, employers have announced plans to cut 167,599 jobs from their payrolls, down 84% from the 1,017,812 jobs eliminated through the same period last year. The three-month moving average (3MMA) has declined in each of the last 10 months. Figure 6 shows the monthly job cuts reported by Challenger on a 3MMA basis since January 2007.
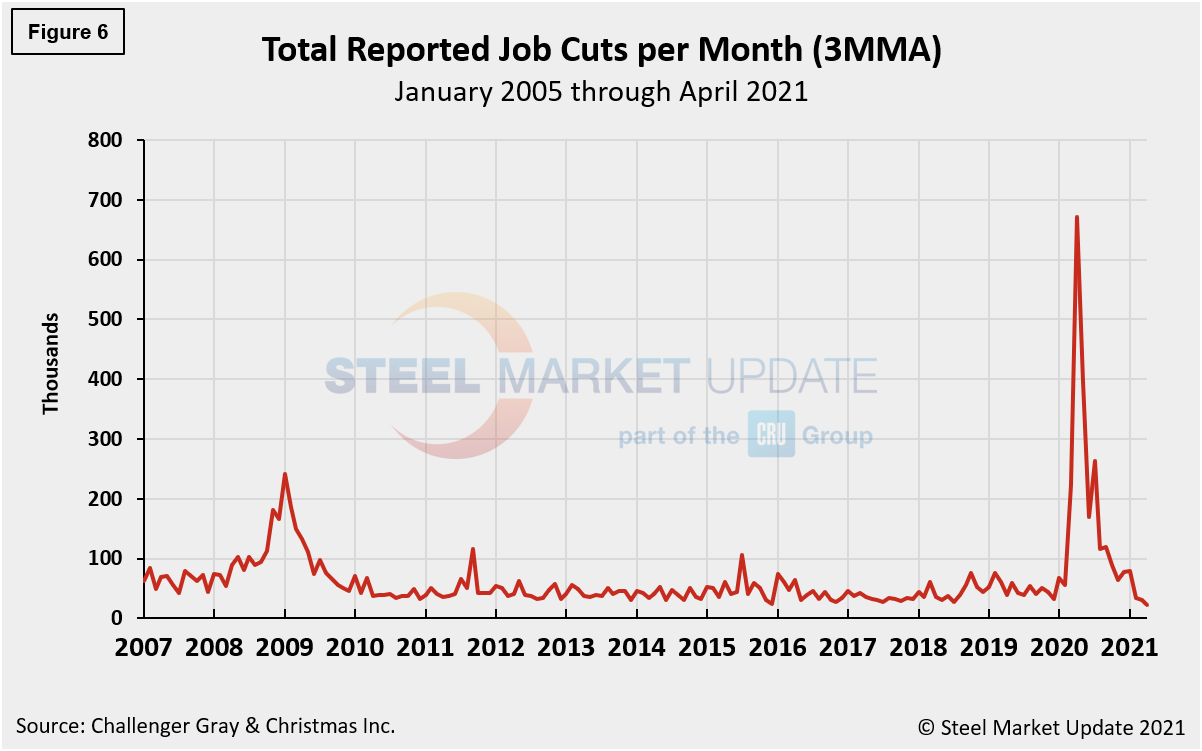
“The good news is that employers are no longer undergoing massive cuts, consumers are beginning to feel safe traveling and spending, and the number of job openings is edging higher,” Challenger reported. “The bad news is we’re experiencing a labor shortage despite the millions of Americans still out of work.”
Explanation: On the first Friday of each month, the Bureau of Labor Statistics releases the employment data for the previous month. Data is available at www.bls.gov. The BLS reports on the results of two surveys. The Establishment survey reports the actual number employed by industry. The Household survey reports on the unemployment rate, participation rate, earnings, average workweek, the breakout into full-time and part-time workers and lots more details describing the age breakdown of the unemployed, reasons for and duration of unemployment.
By David Schollaert, David@SteelMarketUpdate.com


