

Market Data

June 9, 2021
Employment by Industry: May Rebounds After Disappointing April
Written by David Schollaert
The U.S. labor market gained some ground in May following a disappointing performance the month prior. The U.S. Bureau of Labor Statistics (BLS) reported that employers added 559,000 workers to their payrolls in May, a vast improvement from the measly 266,000 new jobs added in April – but still behind the 770,000 new hires in March.
Following the fastest employment gains in more than a year in March, April underperformed with only about a quarter of the nearly 1 million new jobs that had been predicted. May’s workforce rebound was a positive turn and should help to offset persistent worker shortfalls. Despite the additions in May, labor shortages continued to temper hiring. Some economists had estimated that May would bring nearly 700,000 new jobs. Enhanced unemployment benefits have skewed expectations for job creation. Leisure and hospitality, the sector hit hardest by the pandemic, again led the payroll recovery in May, adding 292,000 jobs as restaurants and bars rehired laid-off workers. Public and private education added 144,000 jobs as many schools resumed in-person classes. The employment gains were broad-based. Healthcare and social assistance added 46,000 jobs; professional and business services, 35,000; and transportation and warehousing, 23,000. Yet retail and construction shed workers.
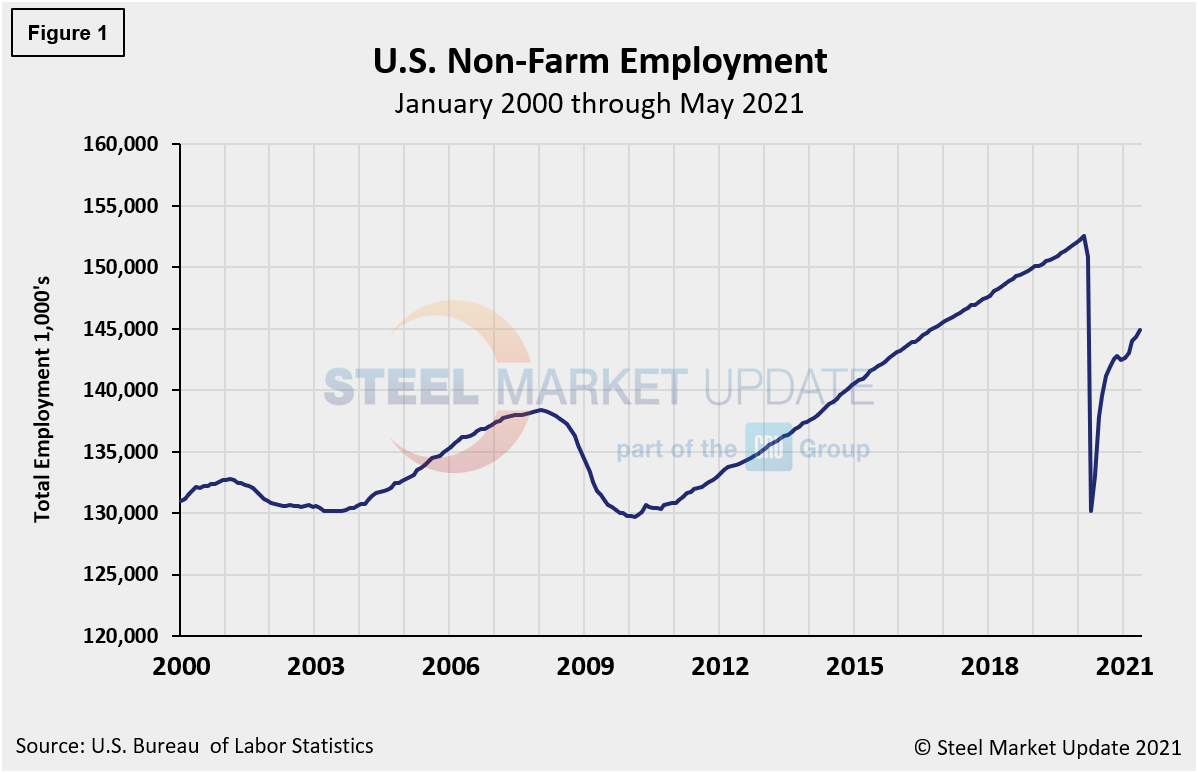
The unemployment rate fell to 5.8% in May, compared to 6.1% the month prior. The number of unemployed persons fell by 496,000 to 9.3 million last month. To date, the U.S. has recovered 14.7 million, or 65%, of the 22.5 million jobs lost last spring, leaving the nation 7.6 million jobs below its pre-pandemic level, when the unemployment rate was a mere 3.5%. Due to the pandemic fallout, the baseline against which future comparisons will be made is February 2020, the all-time high for nonfarm employment at 152,463,000. Figure 1 shows the total number of people employed in the nonfarm economy.
Designed on rolling time periods of 1 month, 3 months, 1 year and 2 years, the table below breaks total employment into service industries and goods-producing industries, and then into private and government employees. Most of the goods-producing employees work in manufacturing and construction. Comparing service and goods-producing industries in May shows service jobs to have increased by 0.5%, while goods-producing jobs fell by 0.1% from April’s result. Note, the subcomponents of both manufacturing and construction shown in this table don’t add up to the total because we have only included those with the most relevance to the steel industry.
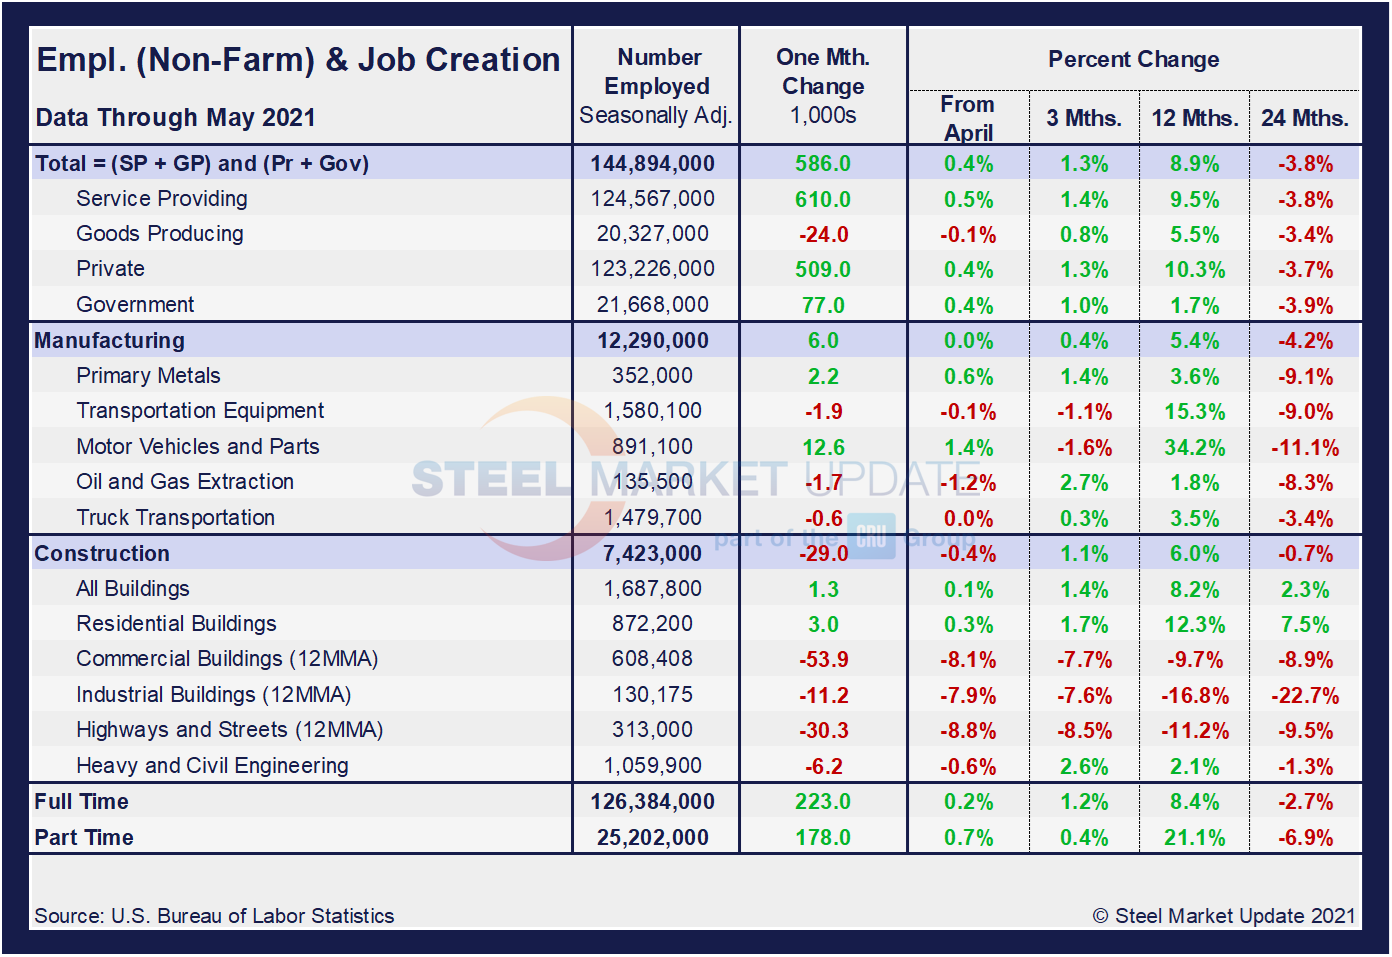
Comparing May to April, manufacturing employment was sideways versus a drop of 0.1% the month prior. Construction was down 0.4% month on month after holding unchanged the in April. The rebound in May aside, the inconsistencies since the beginning of the year point to the significant obstacles facing the U.S. economy and domestic job creation. And 3-month, 12-month and 24-month comparisons remain problematic due to the extensive losses resulting from pandemic. In the year-over-year contrast, manufacturing is up 5.4% and construction is up 6.0%. Further growth is still expected as the marketplace advances from the freefall seen during the second quarter of 2020.
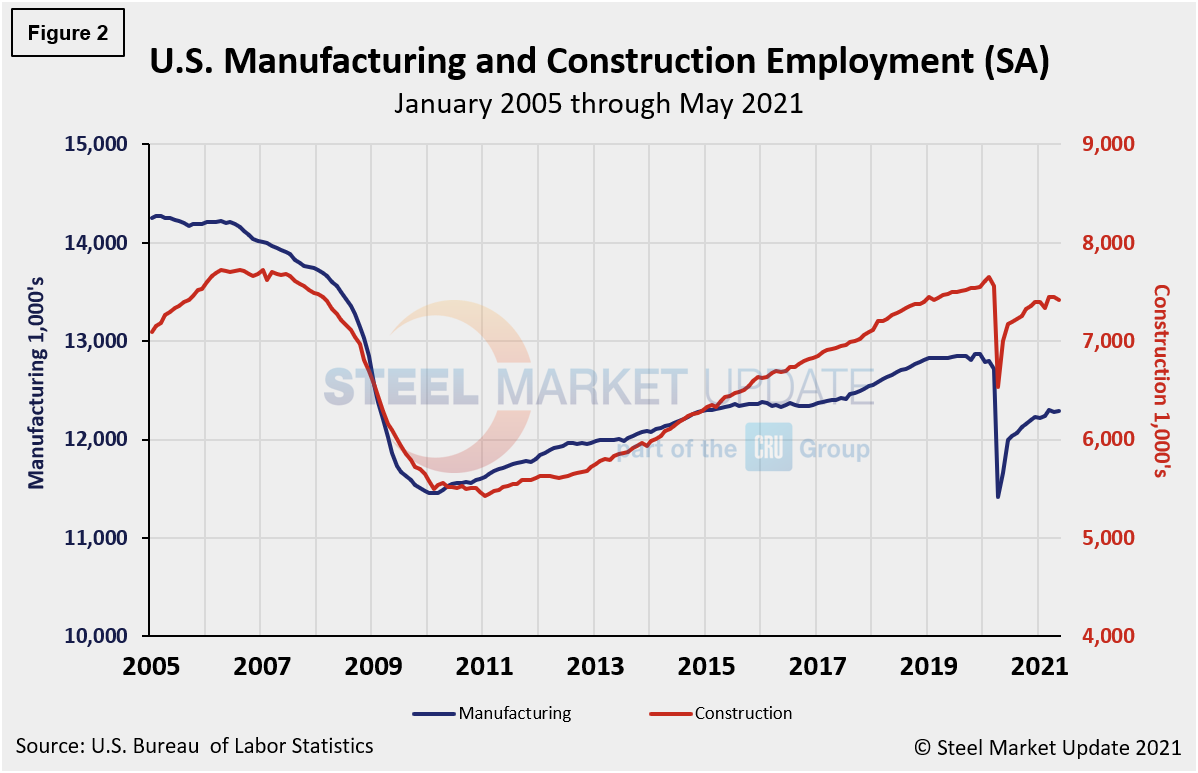
Manufacturing employment increased by 6,000 in May compared to a decreased of 18,000 the month prior, led by an increase of 12,600 from motor vehicles and parts and offset by losses of 1,900, 1,700, and 600 in transportation equipment, oil and gas extraction, and truck transportation, respectively. Construction employment was down by 29,000 month on month, led by extensive losses in commercial buildings as well as in highway and streets jobs. Employment in the construction industry overall is still 225,000 below its February 2020 level, according to the BLS data. Figure 2 shows the history of employment in manufacturing and construction since January 2005.
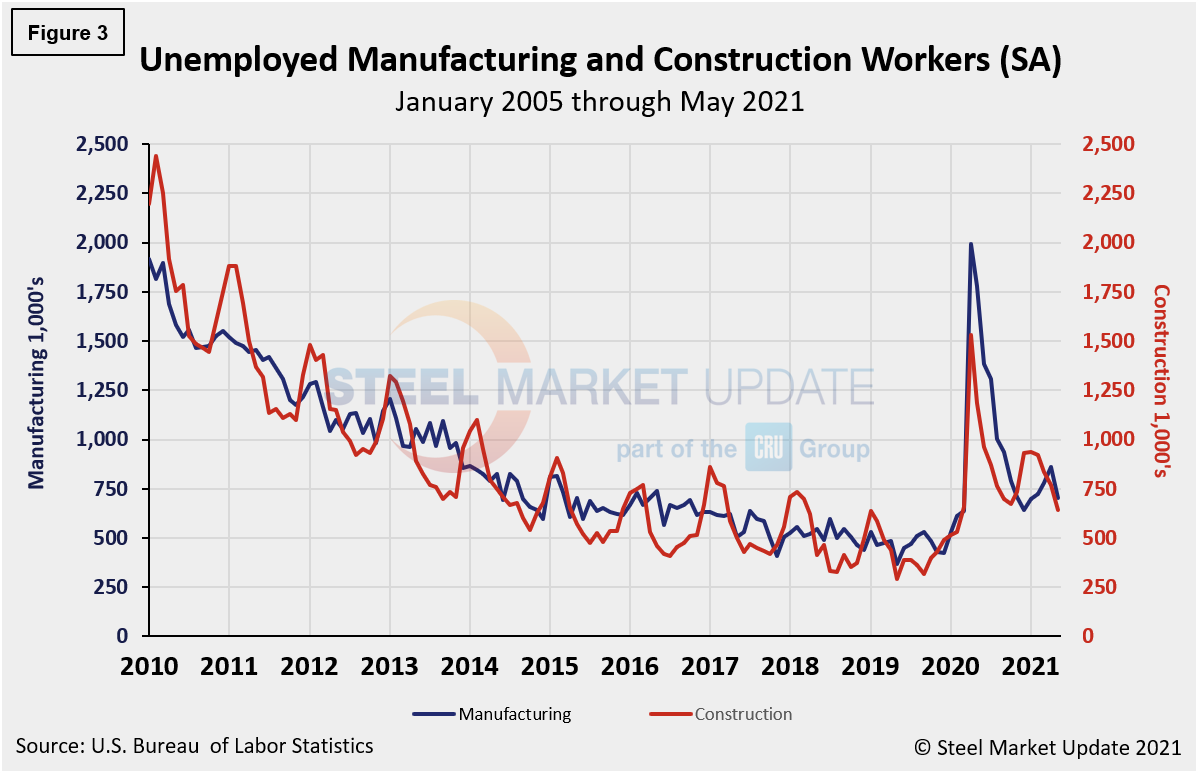
The reported number of unemployed manufacturing and construction workers is shown in Figure 3. Both manufacturing and construction unemployment fell in May. Manufacturing’s unemployed persons decreased from 861,000 in April to 705,000 in May, a 18.1% decrease. Construction unemployment fell by 16.4% month on month, from 768,000 in April to 642,000 in May.
Explanation: On the first or second Friday of each month, the Bureau of Labor Statistics releases the employment data for the previous month. Data is available at www.bls.gov. The BLS employment database is a reality check for other economic data streams such as manufacturing and construction. It is easy to drill down into the BLS database to obtain employment data for many subsectors of the economy. The important point about all these data streams is not necessarily the nominal numbers, but the direction in which they are headed.
By David Schollaert, David@SteelMarketUpdate.com


