

Market Data

June 24, 2021
Mill Lead Times/Negotiations: Flat Rolled Inches Higher Again
Written by Tim Triplett
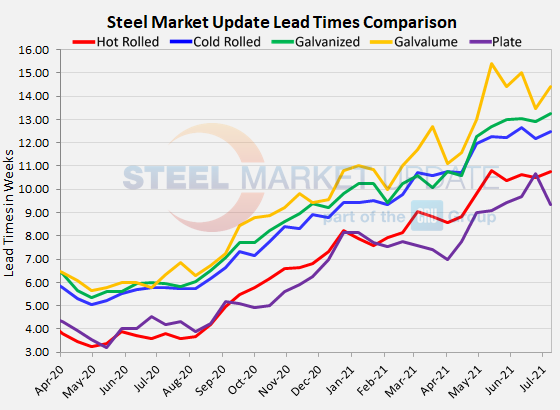
As it turns out, the slight downturn seen in steel mill lead times last month was not the beginning of a trend change. Lead times for all products but plate have inched higher in the last two weeks, indicating no relief yet from the tight supplies that continue to push steel prices higher.
According to SMU’s check of the market this week, lead times for hot rolled now average 10.74 weeks, up slightly from 10.50 weeks in the last survey. Cold rolled lead times rose to 12.46 weeks from 12.18. At 13.26 weeks, lead times for galvanized products bumped up from 12.92 weeks late last month. Lead times for spot orders of Galvalume have stretched to 14.42 weeks from 13.45.
Bucking the trend in flat rolled products, plate lead times shortened by more than a week in the latest survey, declining to an average of 9.33 from 10.67 weeks in SMU’s last check of the market.
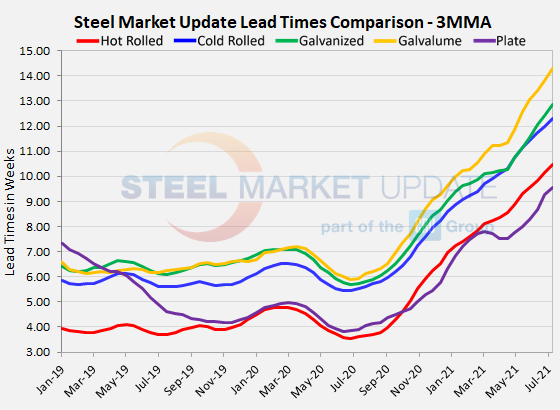
Flat-rolled lead times have been extending for the past year, based on three-month moving averages, which smooth out the weekly volatility. The 3MMA for hot rolled lead times now averages 10.48 weeks, cold rolled 12.29 weeks, galvanized 12.86 weeks, and Galvalume 14.28 weeks. Plate’s 3MMA has risen to 9.54 weeks.
Lead times for deliveries of spot orders from the mills are the longest they have ever been in the history of SMU’s data. To put the 10-week lead times for hot rolled in perspective, in the decade prior to the COVID pandemic last year, hot rolled lead times averaged around 4.0 weeks.
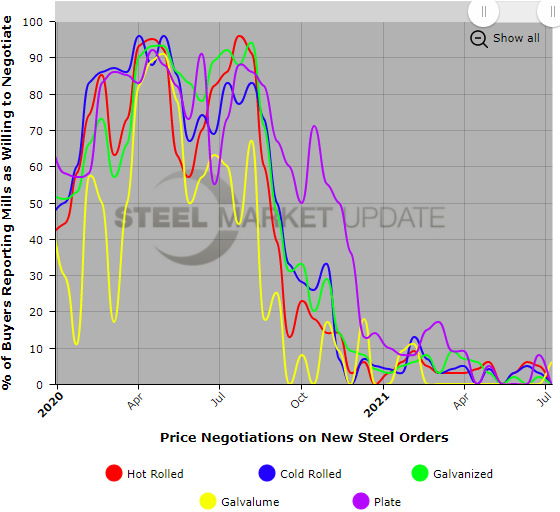
Negotiations
When buyers start reporting that the mills have begun negotiating on price, that will be a sure sign the market is turning. But there is no indication of that yet. Almost all of the respondents to this week’s survey confirmed that the mills are still unwilling to talk price to secure an order. And why should they when they can easily sell everything they make in a market that is short of supply. As one buyer commented: “We still aren’t seeing any spot tons available from the SDIs, Nucors and Cleveland-Cliffs of the world. They don’t have any true availability, so there’s nothing to negotiate on.”
By Tim Triplett, Tim@SteelMarketUpdate.com


