

Market Data

July 6, 2021
BLS: U.S. Job Creation Surges in June
Written by David Schollaert
The U.S. economy continued to push forward in June, the labor market recovery accelerating after a weaker-than-expected showing in April. Employers added a net 850,000 jobs last month, according to the Bureau of Labor Statistics (BLS), the most added in one month since last August and outpacing the consensus expectation from market experts.
Despite the surge in June’s new payroll numbers, the unemployment rate ticked up to 5.9% from 5.8% in May, due largely because approximately 150,000 people re-entered the labor force in June. Even so, the U.S. has now added jobs on net for six straight months, and June’s figure was only outpaced by the 1.5 million jobs created last August. A significant portion of the job gain in the domestic marketplace was concentrated in the leisure and hospitality sector again, with employment in restaurants, bars and entertainment/recreation facilities rising by 343,000 month on month. The education, professional and business services, retail, and social assistance industries also experienced boosts. Construction and motor vehicle manufacturing jobs contracted, however.
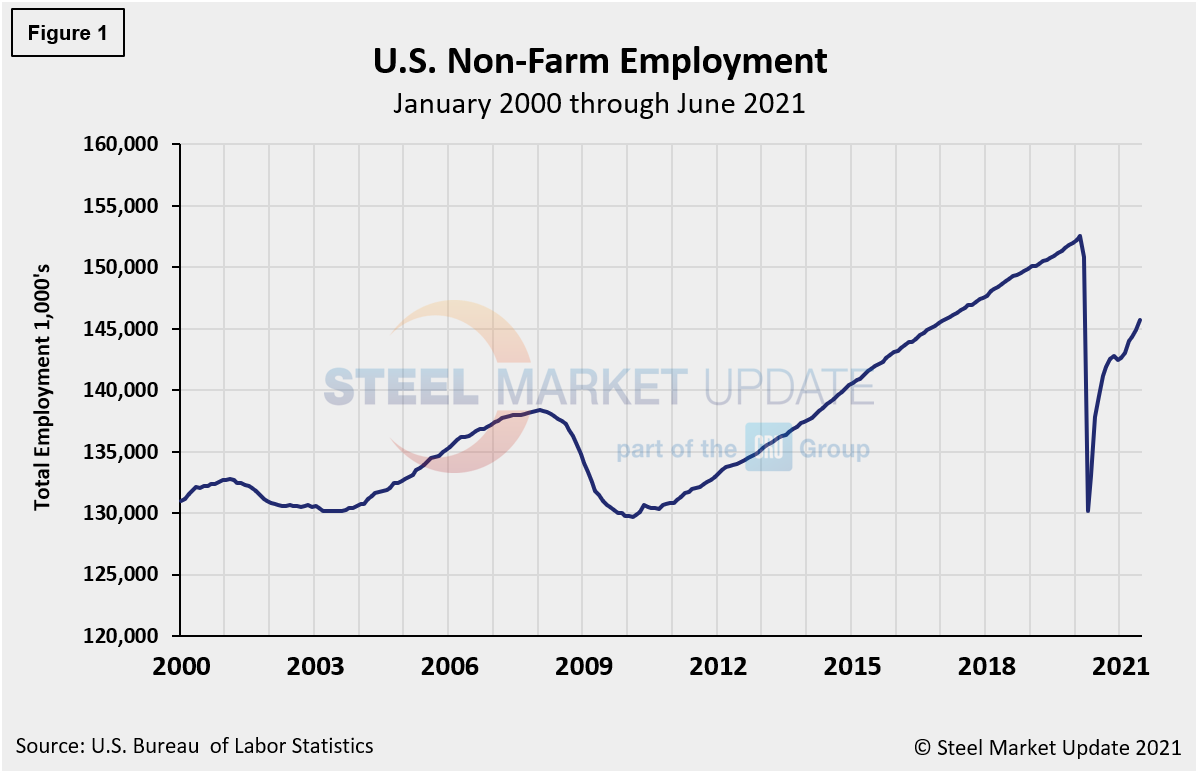
Manufacturing employment rose by 15,000 in June. Although the change was nominal, it was the second consecutive month of job gains after decreasing by 18,000 in April. Manufacturing payrolls remain 481,000 below pre-pandemic totals from February 2020. Employment in construction waned by 7,000 in June, a third such decrease in as many months. Construction employment is 238,000 lower than in February 2020, before the pandemic hit. Figure 1 shows the total number of nonfarm workers employed in the U.S. since 2000.
Beyond the topline numbers, June’s jobs report demonstrated that the current labor market is exceedingly tight. There are still millions of job openings that employers nationwide are struggling to fill, with many job listings including some sort of signing bonus. While the length of an average workweek fell slightly from 34.8 hours to 34.7, average hourly earnings increased another $0.10 to $30.40 from May to June, bringing year-over-year wage growth to 3.6%. The fact that wages have jumped for the third month in a row signals that employers are trying to attract applicants with higher pay while workers are gaining bargaining power.
Despite the added jobs in June, the marketplace still has a long way to go—approximately 6.7 million jobs—before reaching February 2020 levels of employment once again. The number of long-term unemployed (out-of-work for at least 27 consecutive weeks) increased by 233,000 in June, now comprising about 42% of the total unemployed. The labor force grew by about 150,000 last month, but the participation rate held steady at 61.6%, well below the 63.4% in January 2020.
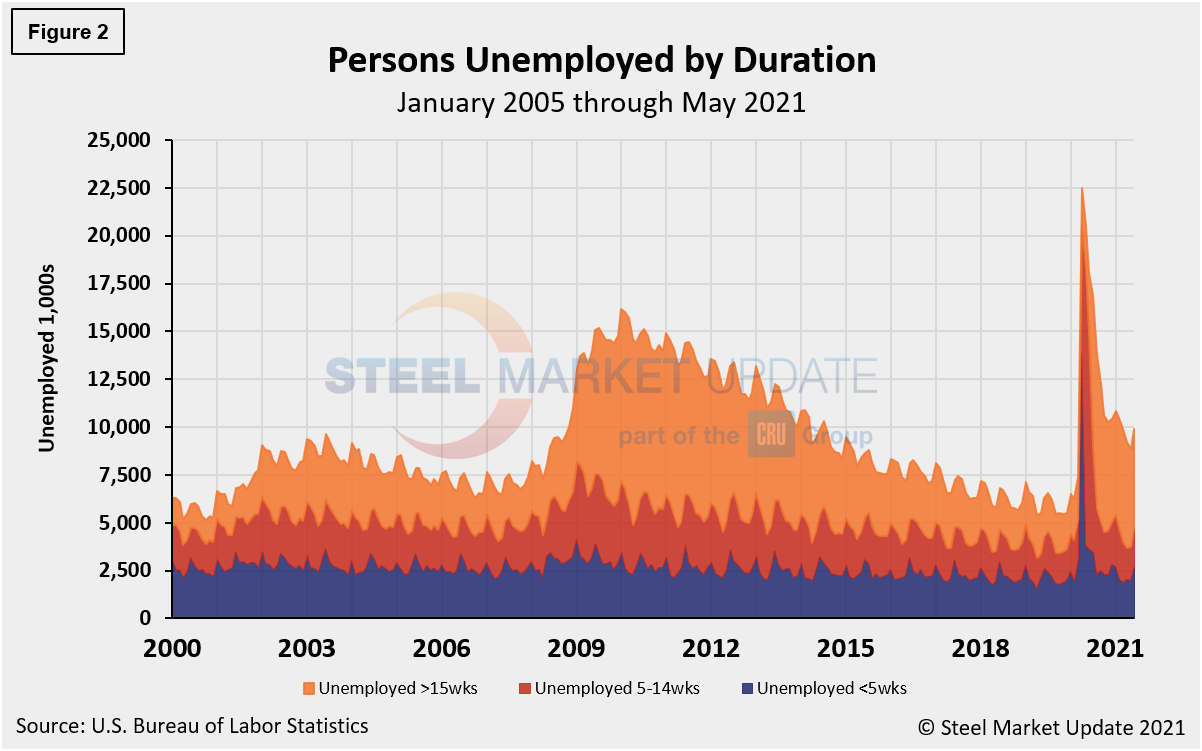
The historical picture for the duration of unemployment since January 2000 is broken down into <5 weeks, 5 to 14 weeks, and >15 weeks, noted below in Figure 2. The total number unemployed was 9,883,000 at the end of June, an increase of 1,054,000 compared to May. Although unemployment remains above pre-pandemic levels by roughly 3.7 million people, about 12.6 million more people now have jobs compared to the 22.5 million thrown out of work during the worst of the pandemic in the spring of 2020. As of July 2, 52.6% had been unemployed for more than 15 weeks, 20.0% for 5 to 14 weeks, and 27.4% for less than 5 weeks.
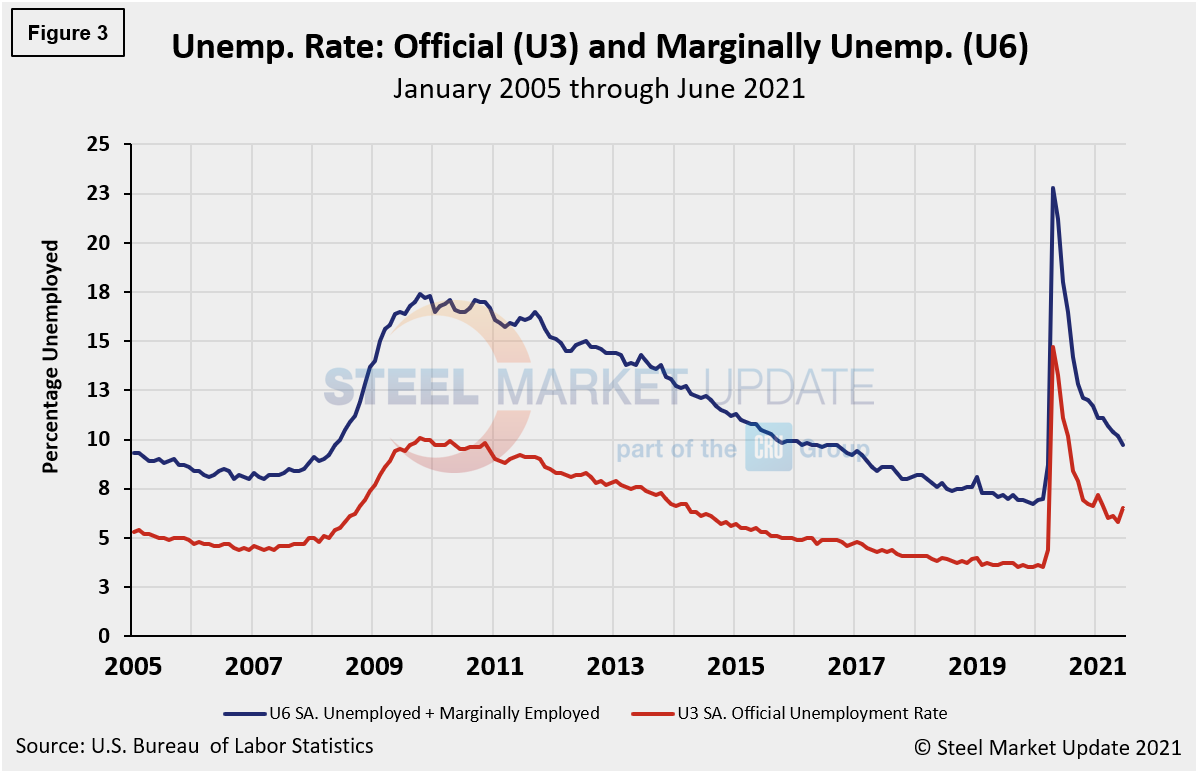
The official unemployment rate, U3, reported in the BLS Household survey (see explanation below) increased from 3.5% in February 2020 to 14.7% in April 2020. It had recovered to 5.8% in May, its best mark in 13 months, but June’s rate rose to 6.5% as approximately 150,000 people re-entered the labor force. The more comprehensive U6 unemployment rate, however, dipped to 9.7% last month from 10.2% in May–a continued improvement from 22.8% in April 2020 (Figure 3). U6 includes individuals working part time who want full-time work and those who want to work but are so discouraged they have stopped looking.
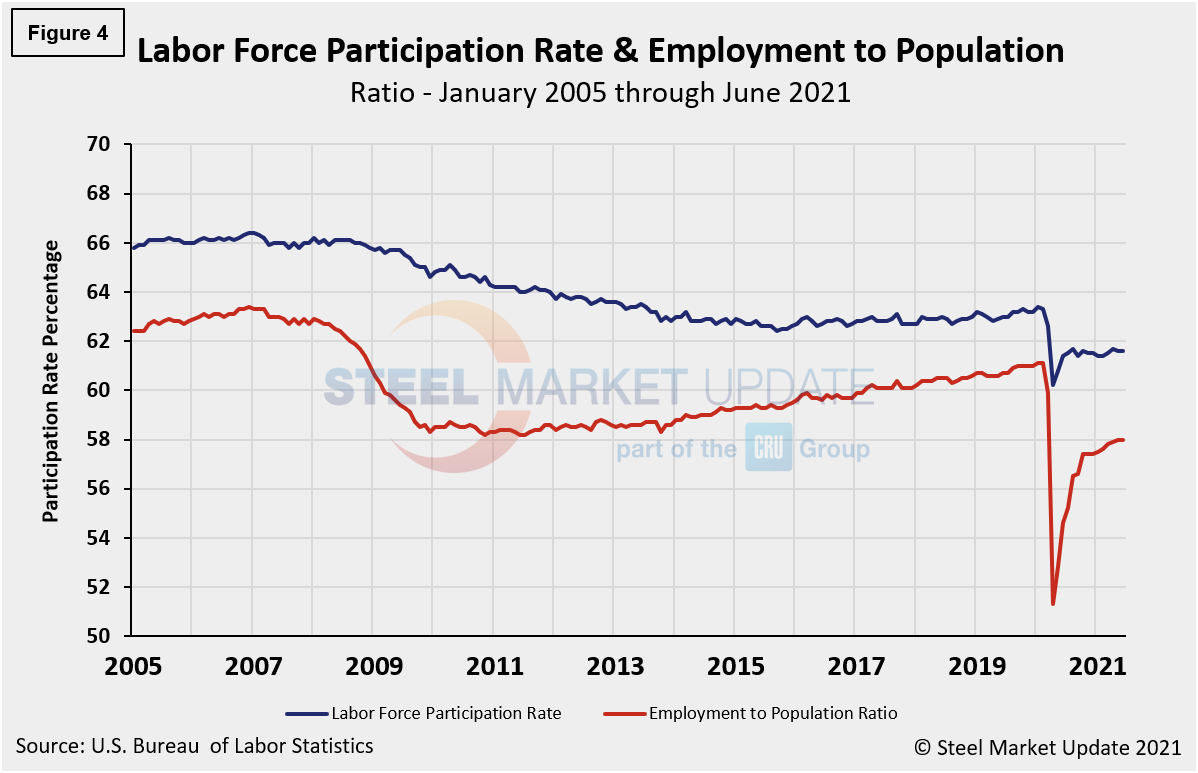
The labor force participation rate is calculated by dividing the number of people actively participating in the labor force by the total number of people eligible to participate. This measure was 61.6% in June, unchanged from the month before. The measure still lags the pre-pandemic reading of 63.3% reported in February 2020. Another gauge, and more definitive view, are the number employed as a percentage of the population. Last month, the employment-to-population ratio was 58.0%, again, no change when compared to the month prior, but up from the low point of 51.3% in April 2020. Figure 4 shows both measures on one graph.
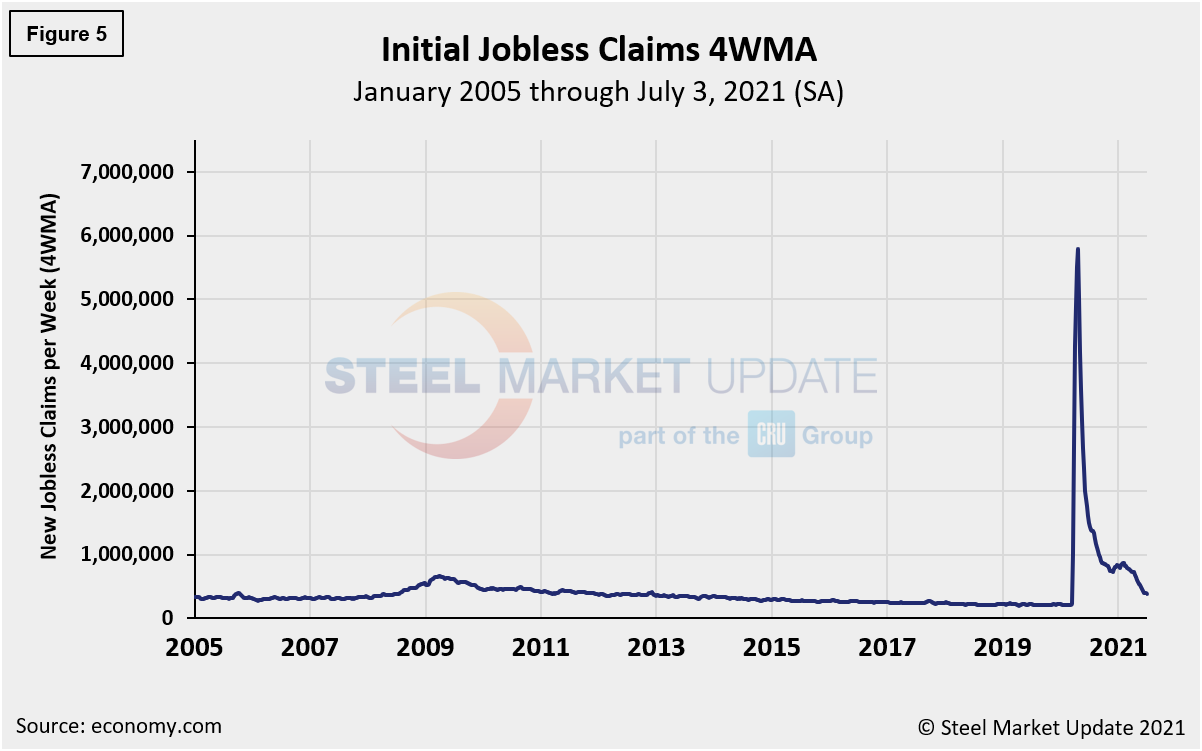
Initial claims for unemployment insurance, which are reported weekly by the Department of Labor, have been on a steady decline since April, building some optimism for the labor market. Filings rose from a low of 376,000 to 415,000 in the week ending June 19. Since then, new filings have retreated, currently totalling 364,000 in the week ending July 3. That’s down from the most recent high of 744,000 just two months ago.
“U.S. initial claims for unemployment insurance are moving in the right direction. New filings fell from 415,000 to 364,000 in the week ended June 26, a decline exceeding consensus expectations,” reported Economy.com. “Continuing claims rose slightly to 3.469 million in the week ended June 19. The number of those filing for Pandemic Unemployment Assistance also moved slightly higher in the week ended June 26 to 115,267. Total initial claims are now back below 500,000, after rising unexpectedly in the last two reports.”
The recent fluctuation in initial claims provides further evidence that the labor market is still recovering from the blows unleashed by the pandemic and that the road ahead looks to be bumpy. Figure 5 shows the four-week moving average of new claims since January 2005.
Human resources consulting firm Challenger, Gray and Christmas Inc. produces a monthly employment update for the U.S. It reported that job cuts in June were 20,476, down 16.7% from the 24,586 reported in May. June’s total is 88% lower than the 170,219 job cuts seen in June 2020 as the marketplace continued to deal with the pandemic. Figure 6 shows the monthly job cuts reported by Challenger on a 3MMA basis since January 2007.
“We’re seeing the rubber band snap back,” said Challenger. “Companies are holding on tight to their workers during a time of record job openings and very high job seeker confidence. We haven’t seen job cuts this low since the dot-com boom.”
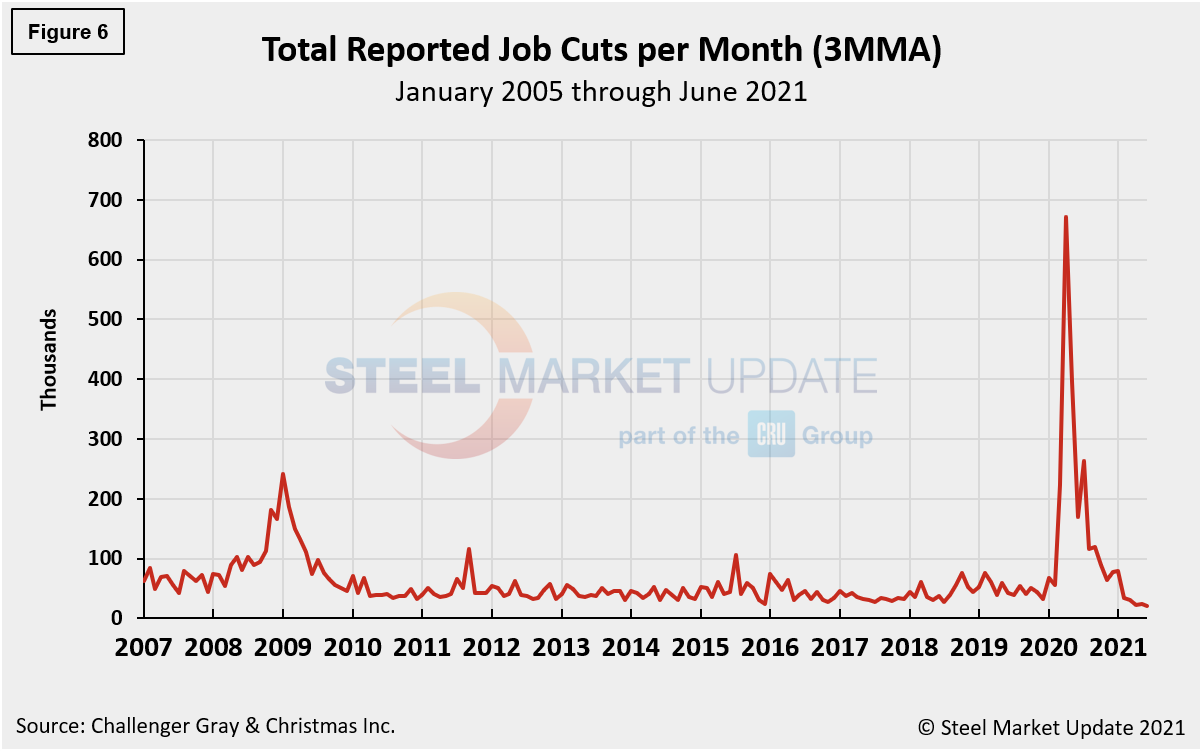
In the second quarter, employers announced 67,975 job cuts, the lowest quarterly total since the second quarter of 1997, when 51,309 cuts were announced. It is down 53% from the first quarter total of 144,686, and 95% lower than the 1,238,364 announced in the same quarter last year.
Year to date, employers have announced plans to cut 212,661 jobs from their payrolls, down 87% from the 1,585,047 jobs eliminated through the same period last year. It is the lowest six-month period total since 1995, when 212,299 job cuts were tracked in the first six months of the year. The three-month moving average (3MMA) has declined in each of the last 13 months.
Explanation: On the first Friday of each month, the Bureau of Labor Statistics releases the employment data for the previous month. Data is available at www.bls.gov. The BLS reports on the results of two surveys. The Establishment survey reports the actual number employed by industry. The Household survey reports on the unemployment rate, participation rate, earnings, average workweek, the breakout into full-time and part-time workers and lots more details describing the age breakdown of the unemployed, reasons for and duration of unemployment.
By David Schollaert, David@SteelMarketUpdate.com


