

Market Data

July 6, 2021
Steel Product Shipments and Inventories through May
Written by David Schollaert
U.S. steel product shipments rebounded in May, up 3.1% following a 7.1% decrease the month prior. Steel product shipments have been irregular from month to month since bottoming out in May 2020.
The seesaw pattern over the past year is attributable to several factors including mill outages, factory curtailments and seasonal disruptions as the marketplace continues to recover from the effects of COVID-19. Shipments of manufactured durable goods have seen a similar trend over the same period.
Manufacturing inventories were largely stable over the past 12- and 24-month periods, according to Census Bureau data on inventories, shipments and new orders for total U.S. manufacturing and steel products. In May, total manufacturing inventories were up 0.9% versus the month prior, but up 4.2% and 4.7% when compared to the same 2020 and 2019 months, respectively. Steel product inventories, by contrast, are noticeably tighter. May’s total is up 2.1% from the month prior, and up 5.2% year on year. When compared to the 2019 pre-pandemic year, however, total steel product inventories are down 2.8%.
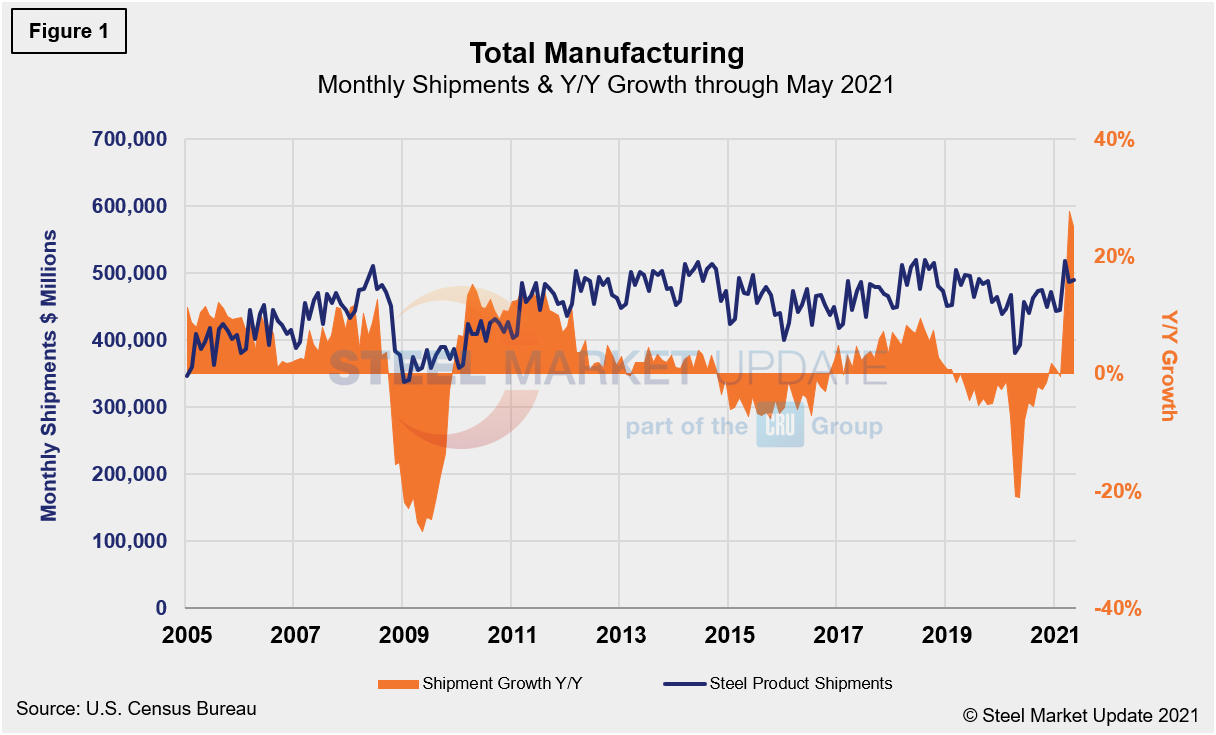
Total shipments and inventories are reported in millions of dollars, seasonally adjusted. Total steel shipments in May were 42.8% higher than in the same year-ago period and 9.4% higher when compared to the same pre-pandemic period in 2019. Year over year through May, total manufactured product shipments rose by 25.0%, but were down 1.4% when compared to the first five months of 2019. During the first wave of the global pandemic last April, total manufacturing shipments plunged by 19.4% and steel product shipments fell by 21.4% compared with the prior year. Both have steadily recovered since. Figure 1 and Figure 2 show the history of both since 2005.
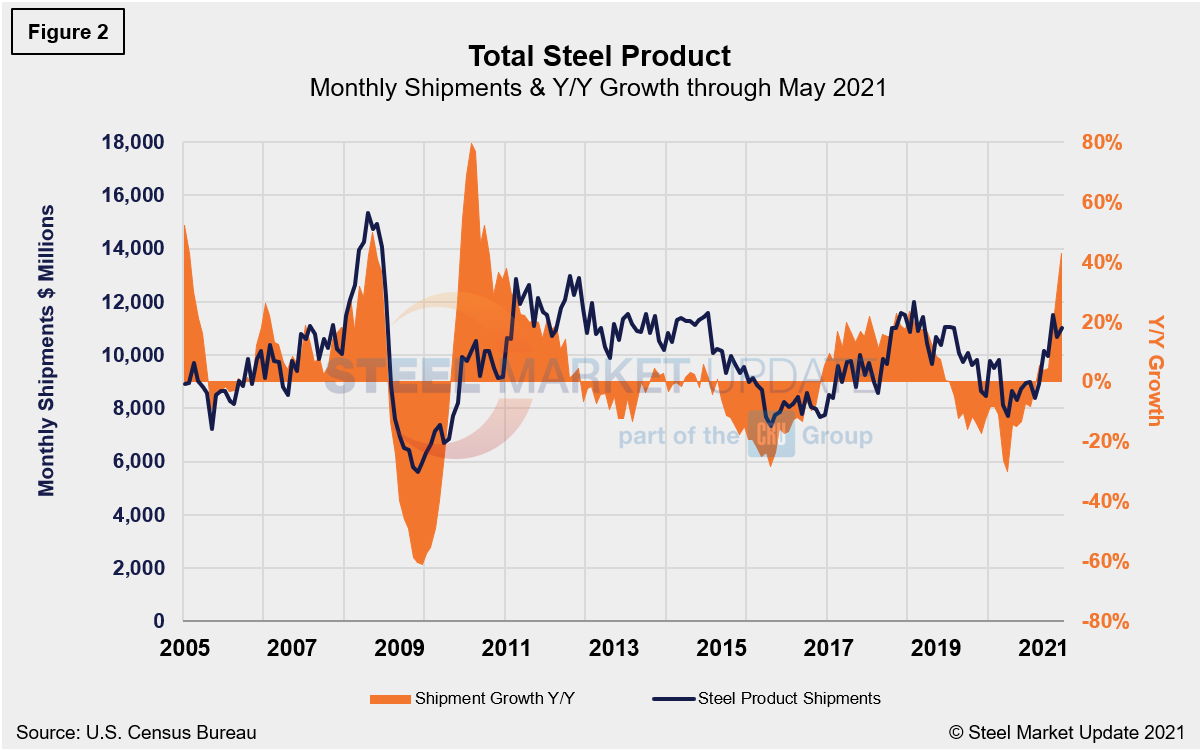
Monthly steel product shipments through May are detailed in Figure 2. Shipments of steel products totaled $11.018 billion in May, up from $10.687 billion in April, and up from year-ago levels when shipments were $7.716 billion. Shipments of steel products most recently peaked in August 2018 at $11.980 billion, then began a 20-month decline through May 2020. Although the growth rate has declined from 23.6% in July 2018 to 3.8% through January 2021, recent gains have pushed shipments of steel products up 42.8% since reaching bottom last May.
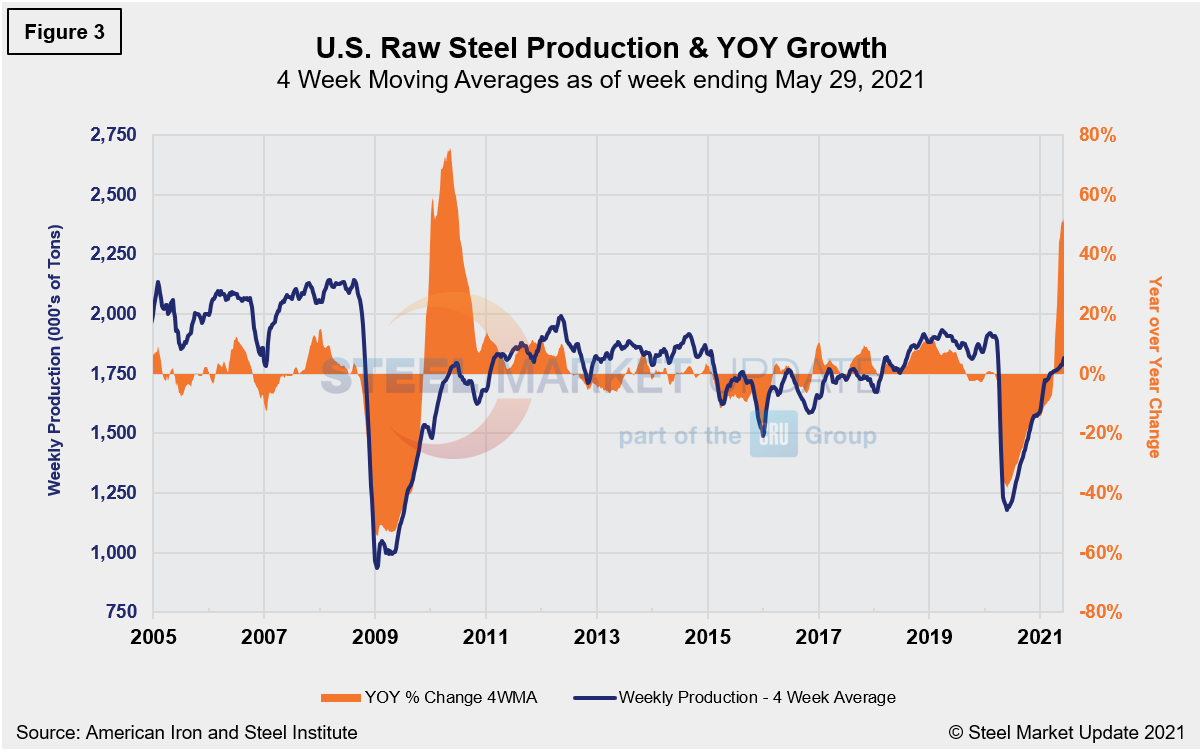
The Census data in Figure 2 compares well over the long term with the American Iron and Steel Institute (AISI) weekly crude steel production shown in Figure 3. Figure 2 is in dollars and Figure 3 is in tons, but they paint a similar picture. Since the freefall following the first wave of the pandemic, steel production has rebounded, according to AISI data shown on a four-week moving average basis. Crude steel production was up 52.2% in the week ending May 29 compared the same period a year ago.
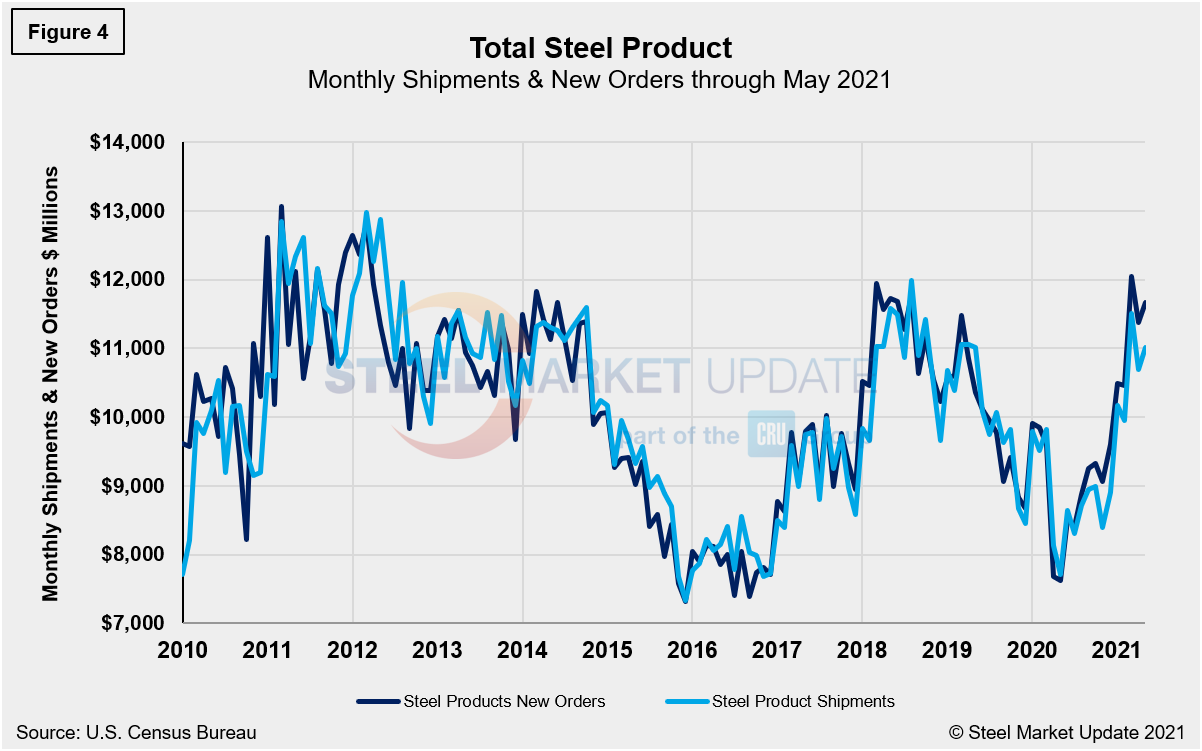
Steel product shipments and new orders on a monthly basis since 2010 are shown in Figure 4. New orders and shipments saw similar declines last April but were back in balance by June. Since, however, new orders have exceeded shipments and continue to steadily outpace them. In May, even though steel product shipments increased at a faster rate month on month than new orders—3.1% versus 2.6%, respectively—shipments were still $643 million less. Thus shipments remain curbed as inventories tighten further and as lead times are pushed out further.
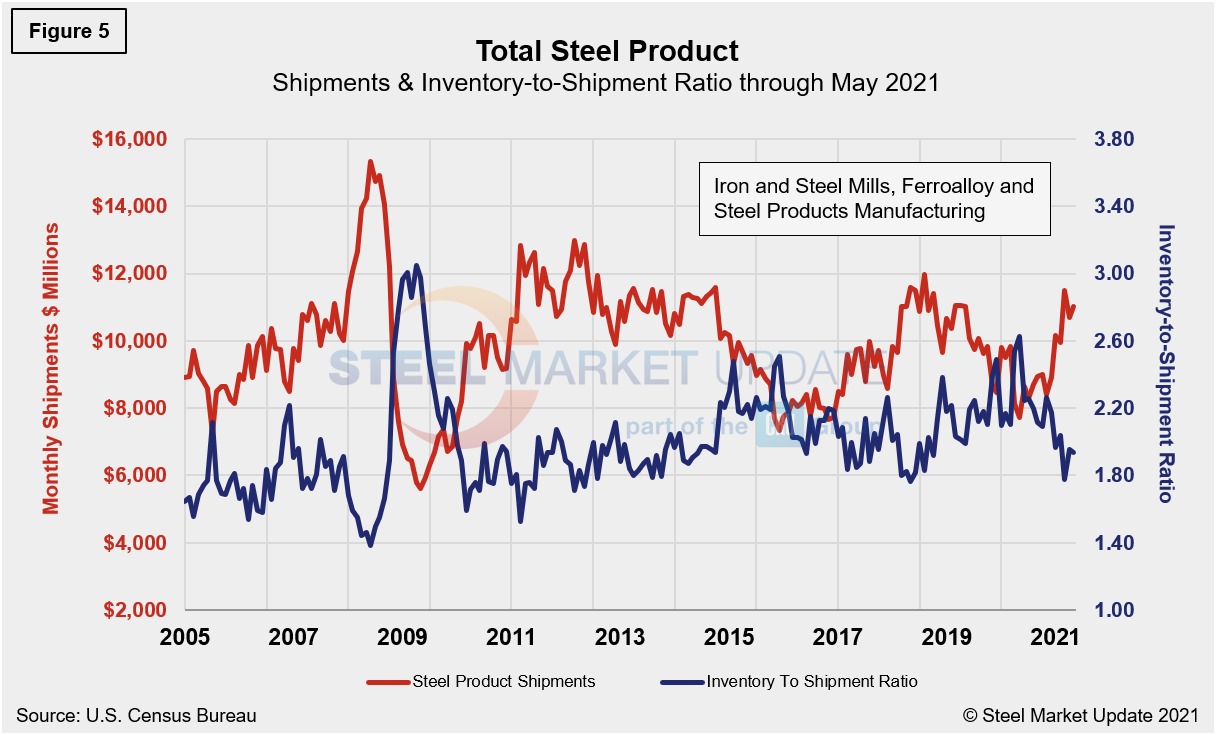
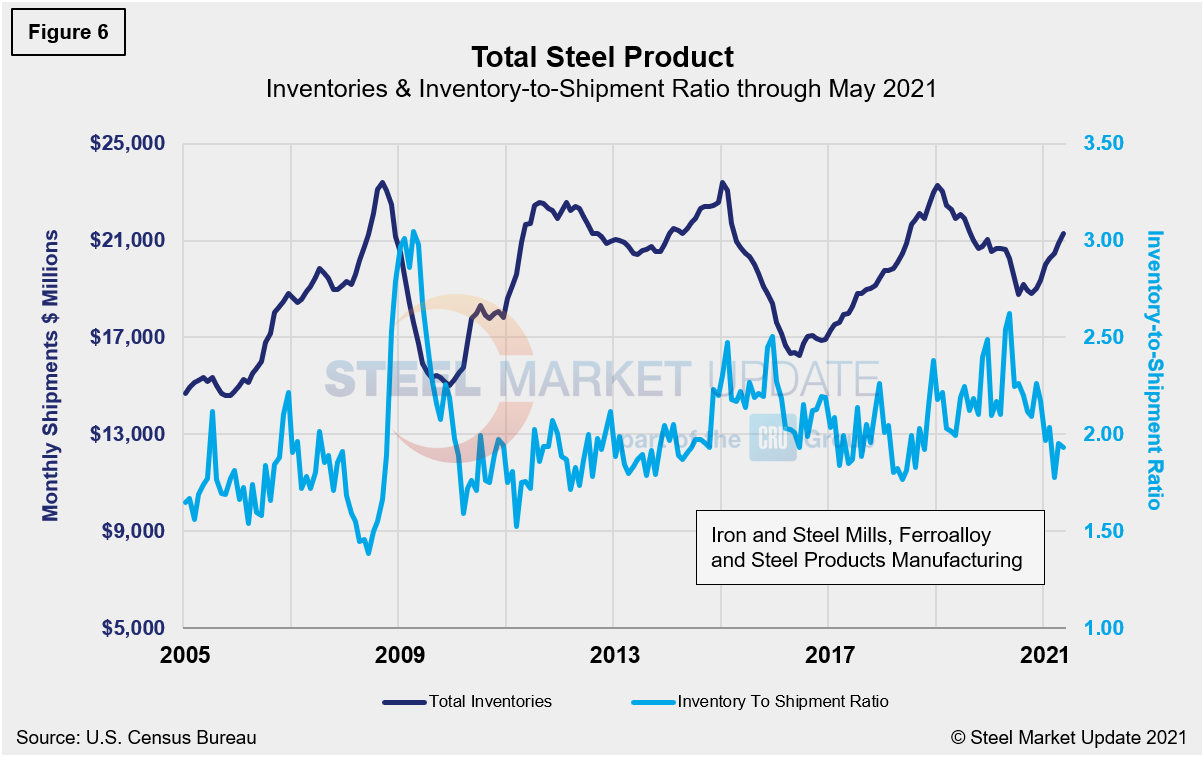
The same total shipment line as in Figure 2 is shown below in Figure 5, but now includes the inventory-to-shipment (IS) ratio. The IS ratio is a measure of how much inventory is necessary to support the level of shipments. Thus the lower the IS ratio, the better. The IS ratio for steel products shot up in May 2020 to 2.62% as shipments declined due to supply-chain disruptions from COVID-19-related mitigation efforts. Now, one year removed, the IS ratio was at 1.93%, down slightly from 1.95% the month prior. The decrease, albeit marginal, indicates demand is still outpacing supply. The IS ratio has been inconsistent in 2021, reflecting weather-related delays, temporary disruptions and maintenance outages. Inventories were up 2.1% in May when compared to April, while shipments were down 3.1% during the same period. These dynamics highlight a continued tight spot market for steel. Overall, steel shipments have improved by nearly 43.0% since May 2020. Total inventory in millions of dollars is displayed in Figure 6 and echoes the inventory-to-shipment ratio shown in Figure 5.
By David Schollaert, David@SteelMarketUpdate.com


