

Analysis

July 13, 2021
CPIP Data: Construction Spending Slows Slightly in May
Written by David Schollaert
The U.S. construction sector lost momentum in May as the industry continues to deal with the effects of the COVID pandemic. Growth remains uneven across sectors as many continue to work through supply chain disruptions, rising materials prices and labor shortages.
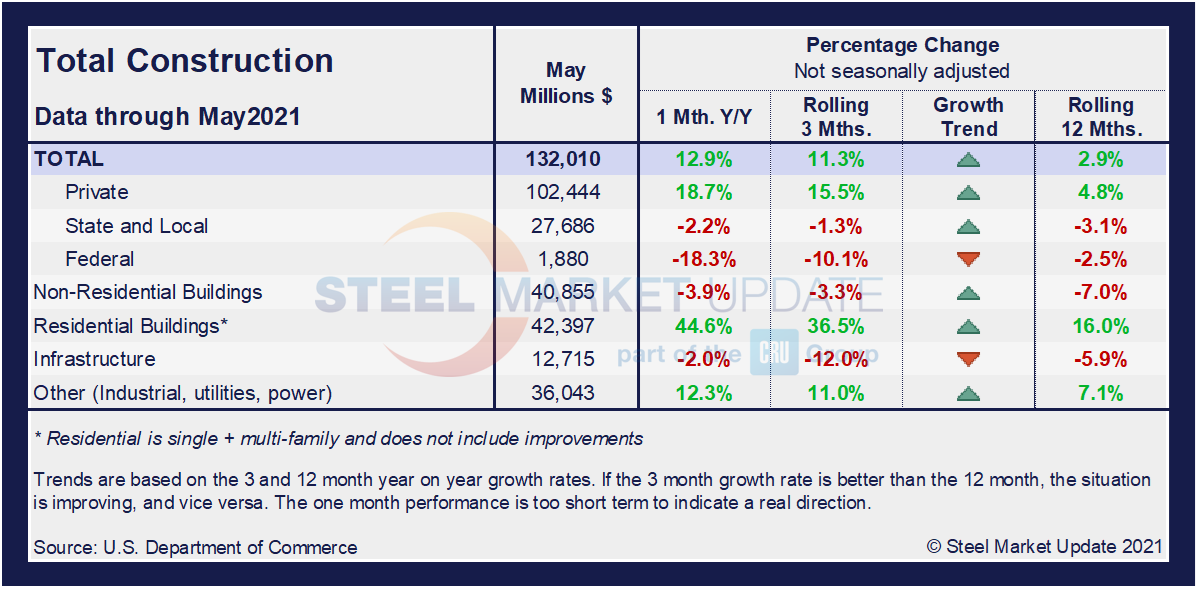
Total construction spending during May, at a seasonally adjusted annual rate, was $1.545 trillion, 0.3% below April’s revised pace of $1.549 trillion, reported the U.S. Census Bureau. Total construction was 7.5% higher than the pandemic-depressed rate last May when spending was $1.438 trillion. Year-to-date construction spending amounted to $594.8 billion, 4.6% above the $568.5 billion for the same period in 2020. May’s report was considered disappointing, however, as the market is still recovering from last year’s downturn.
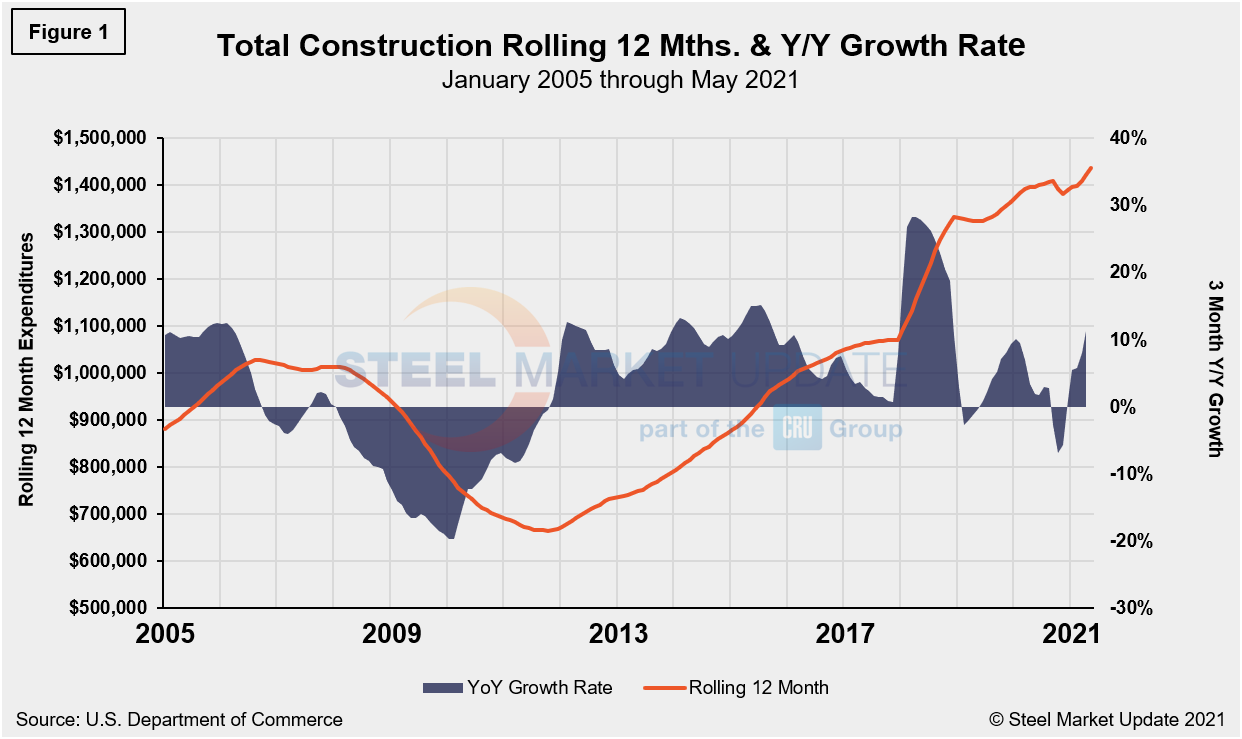
The private sector is the primary driver of growth across the domestic construction industry. Total construction spending is up year on year, driven almost singlehandedly by residential building, which grew by nearly 16.0% over the past 12 months, and is up 36.5% on a rolling three-months basis. Nonresidential spending is down 7.0% over the same period. Total construction expenditures are also shown in Figure 1.
Private Construction
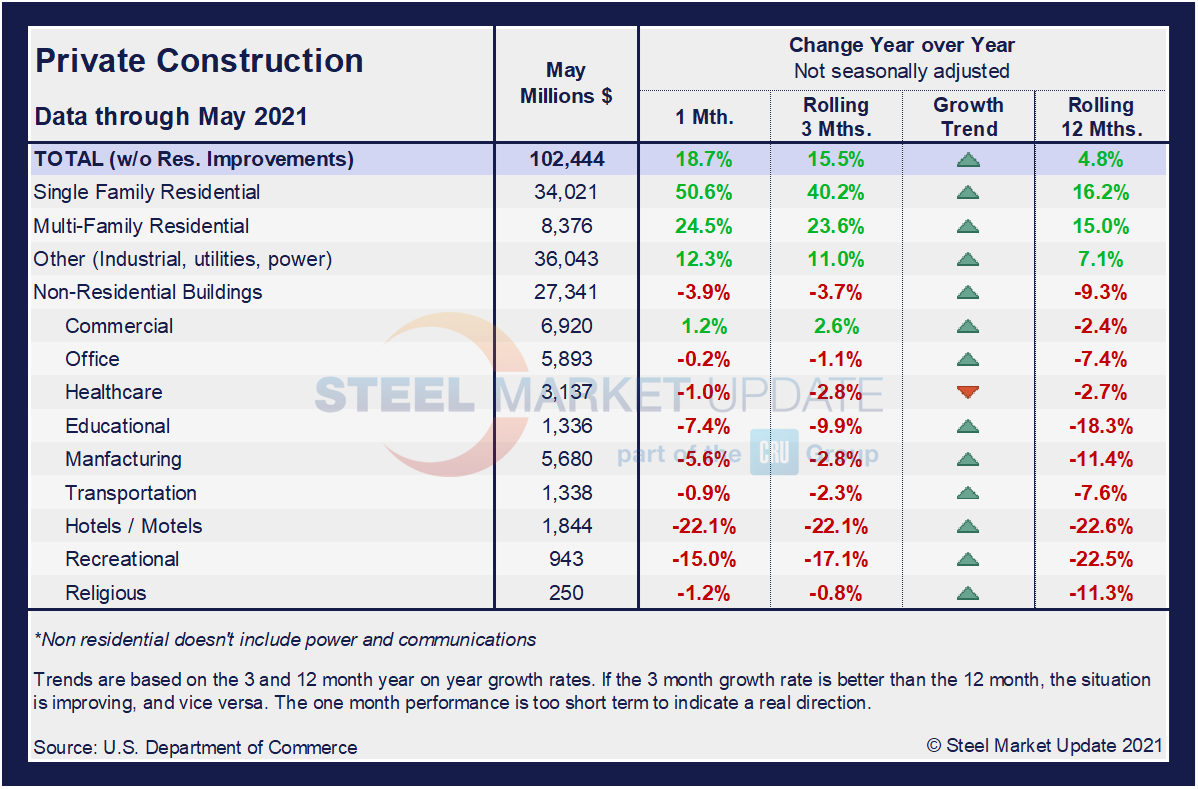
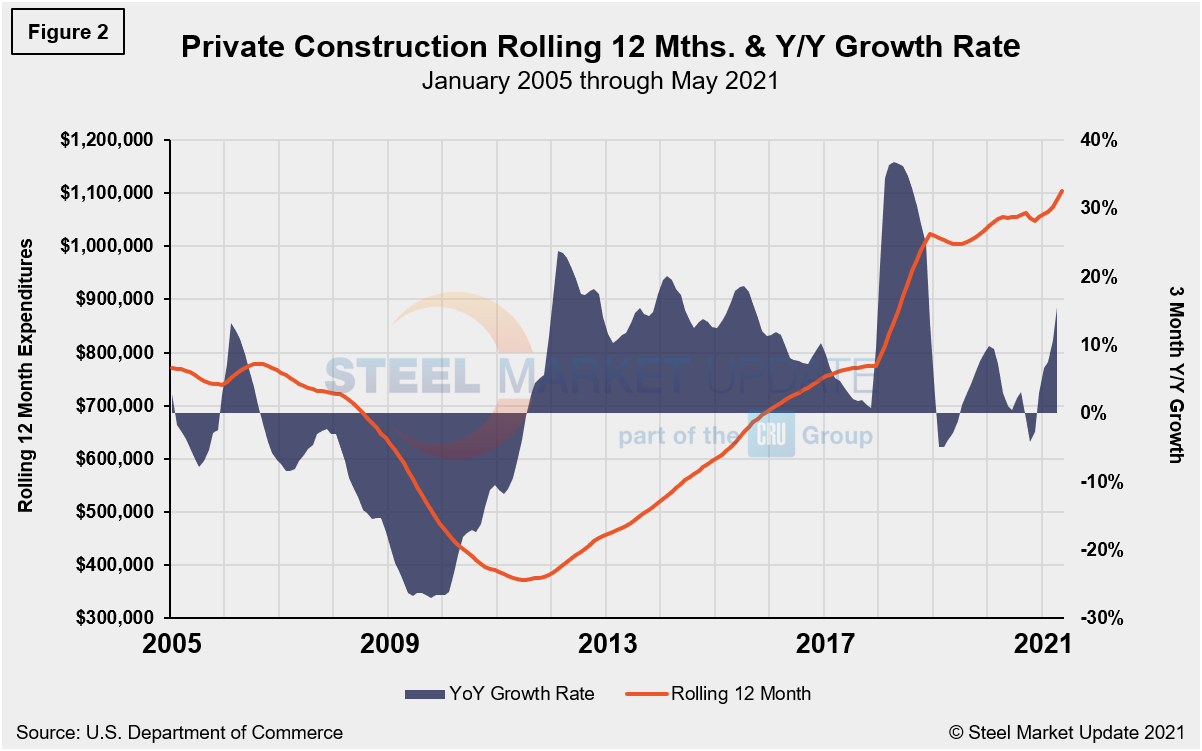
The breakdown of private expenditures into residential and nonresidential and their subsectors are highlighted in the table below. Residential construction has been the driving force in the private construction sector, as only two nonresidential subcategories are reporting any near- or long-term growth. Not surprising are the nonresidential subcategories hit hardest by the pandemic shutdowns, such as recreational, hotels and educational construction, all down by nearly 20.0% or more on a rolling 12-month basis. Single-family and multi-family residential construction are up 16.2% and 15.0%, respectively, on a rolling 12-month basis. Single-family residential construction posted an astonishing 50.6% annual growth rate in May.
Spending on private construction in May was at a seasonally adjusted annual rate of $1.203 trillion, 0.3% below the revised April estimate of $1.207 trillion. Residential construction was at a seasonally adjusted annual rate of $751.7 billion in May, 0.2% above the revised April estimate of $750.3 billion. Nonresidential construction was at a seasonally adjusted annual rate of $451.6 billion in May, 1.1% below the revised April estimate of $456.5 billion.
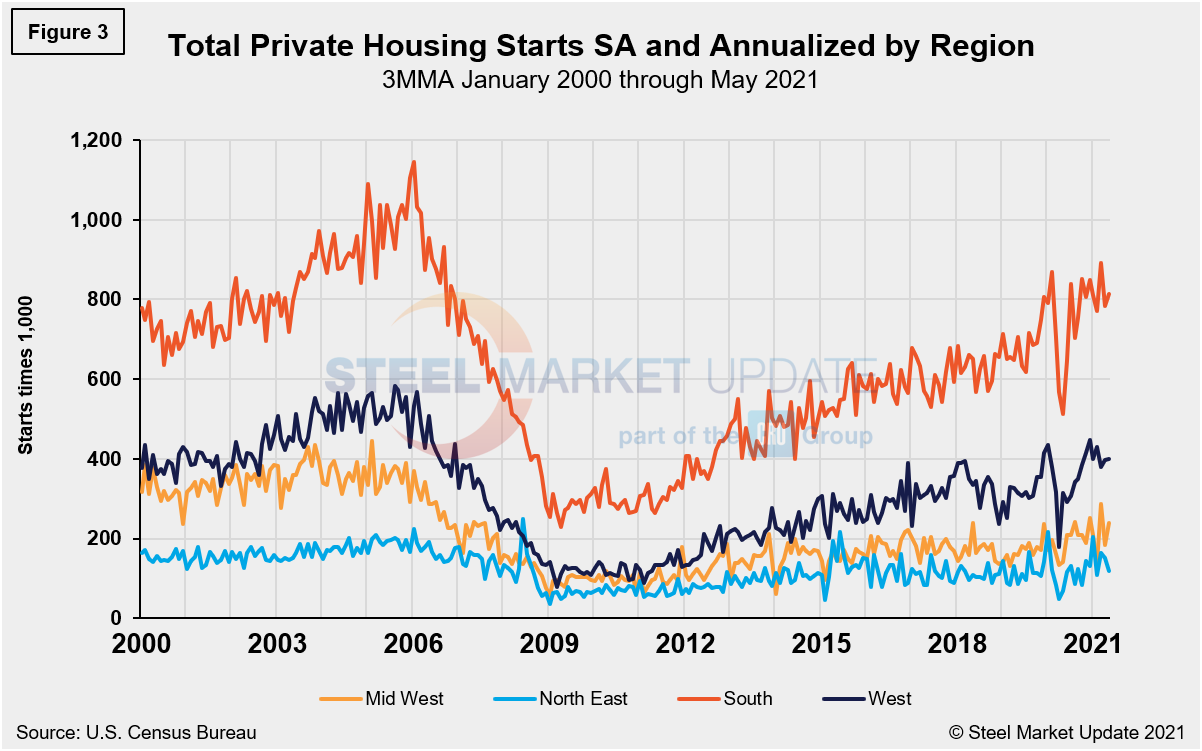
Total housing starts in the four regions are displayed below (Figure 3). Privately‐owned housing starts in May were at a seasonally adjusted annual rate of 1.572 million, up 2.7% from the revised April estimate of 1.517 million. Despite the marginal month-on-month increase, May’s rate is 48.5% above the year-ago rate of 1.038 million. Single‐family housing starts in April were at a rate of 1.098 million, up 0.9% from the revised April figure of 1.054 million. May’s total is down, however, by 39.8% from the peak of 1.823 million seen in January 2006. The May rate for buildings with five units or more was 465,000.
The South region continues to be the strongest for housing starts at 814,000 in May, besting the West—the second-place region—by more than double. The Northeast continues to trail the other three regions with just 118,000 starts in May. All four regions were directly impacted by the widespread COVID-19 shutdowns last year, causing housing starts to fall sharply. Since then, however, they have nearly recovered to pre-pandemic levels. All regions rose month on month, except the Northeast region.
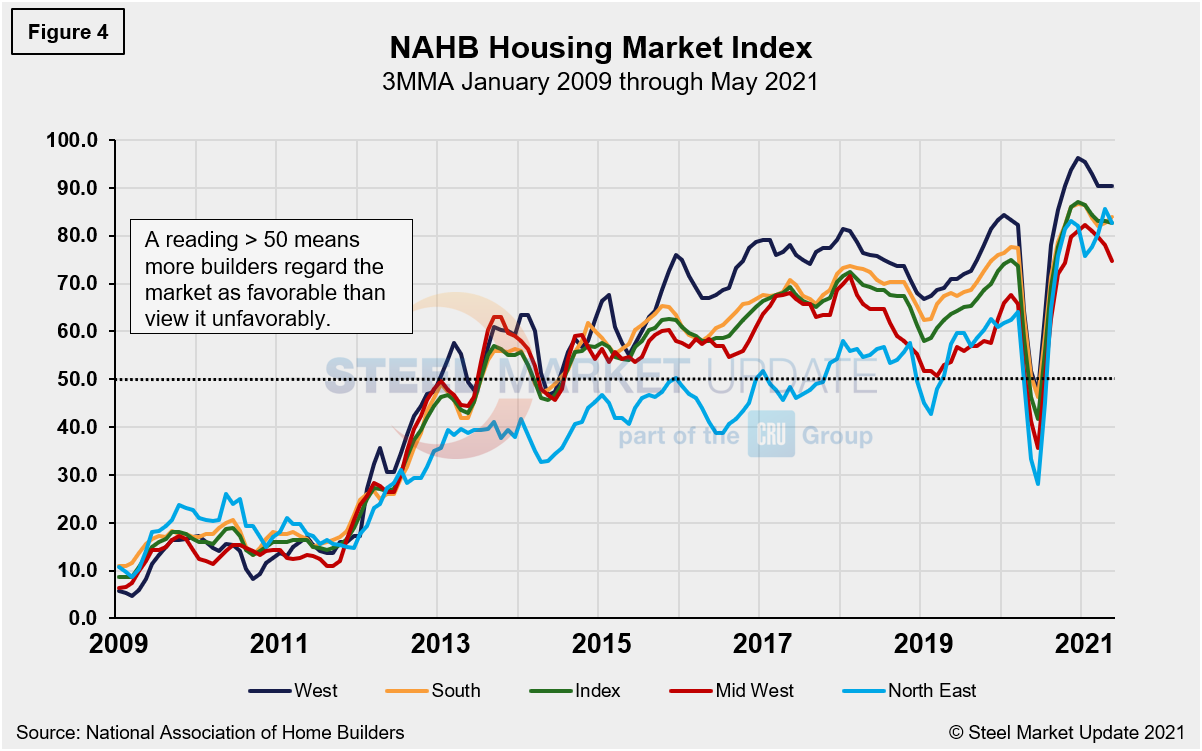
The National Association of Home Builders optimism index plummeted in April 2020 at the onset of COVID-19, but then recovered from May through December last year. Since the beginning of 2021, optimism among home builders has fluctuated up and down within a small range due the high costs of lumber and other building materials and the shortage of skilled labor—but remains in positive territory. The index was unchanged in May at 83, but advanced reports indicate that it might slip in June. (Figure 4).
State and Local Construction
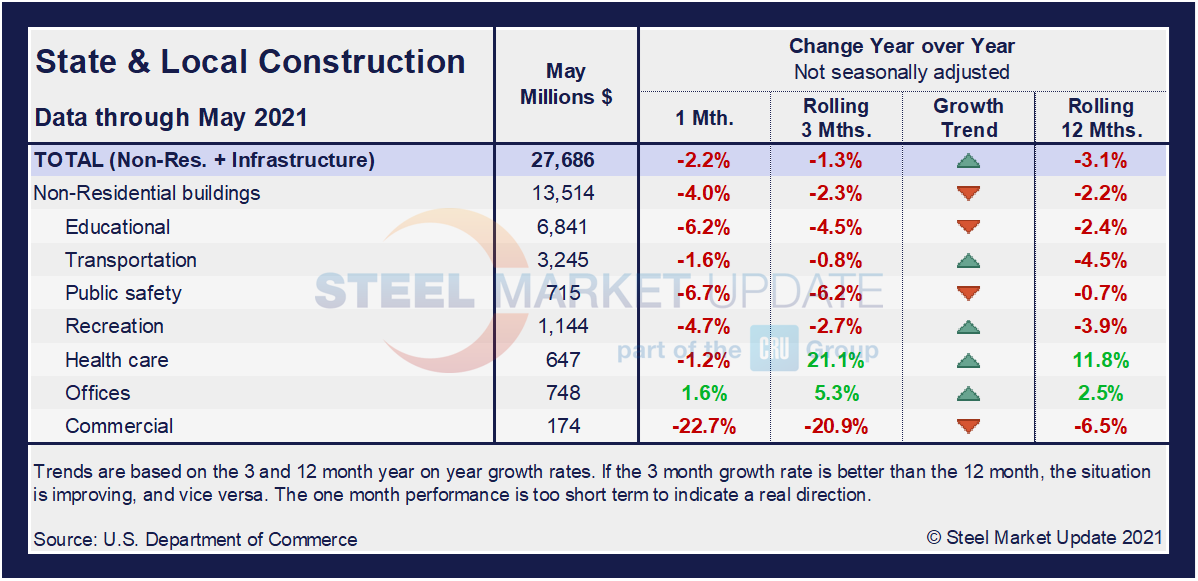
Construction expenditures on a state and local level remain the most impacted by the 15-month-long health crisis. Notably, on a year-on-year and rolling three-month basis, these construction categories and subcategories are still behind pre-pandemic levels. The table below details a split sector where half remain on the decline while half are seeing rising growth rates. Despite some improvement, only health care and office construction are above year-ago levels.
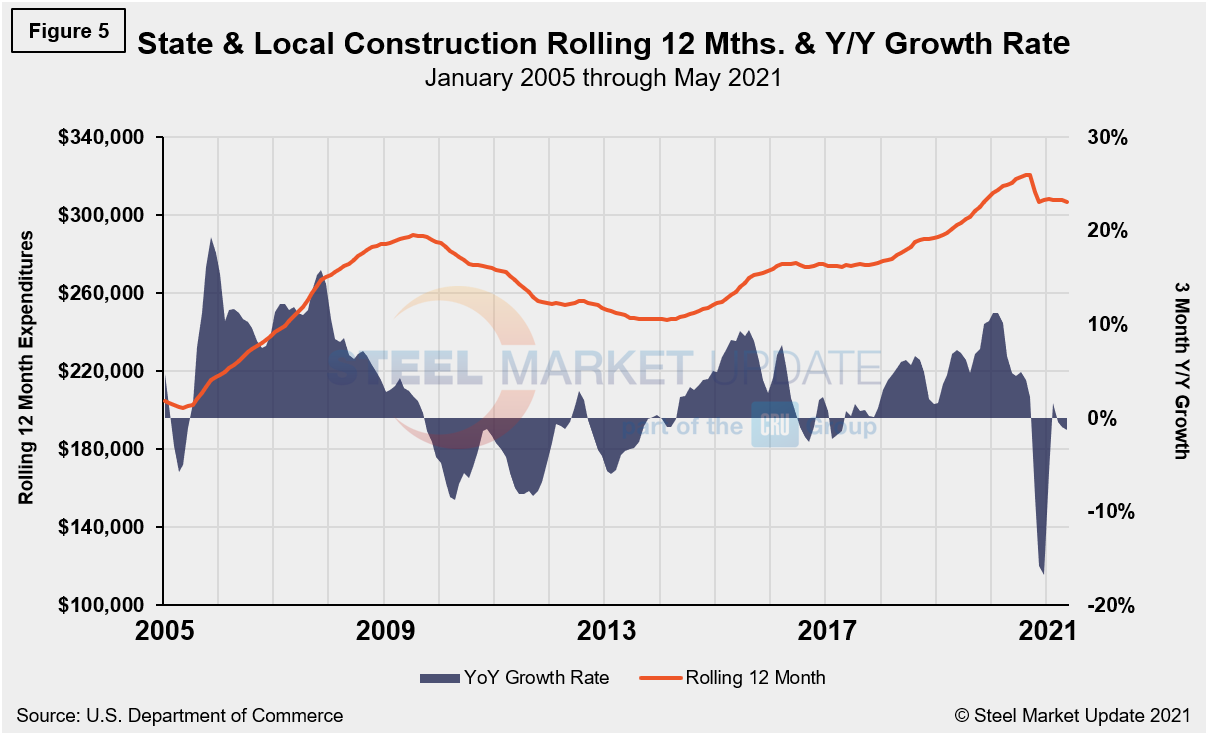
In three months through May, overall state and local construction was down 1.3%, and improvement from the month prior when the sector was down 2.1%, but with half of the subcategories still trending down. In May, the estimated seasonally adjusted annual rate of public construction spending was $342.0 billion, 0.2% below the revised April estimate of $342.7 billion. Educational construction was at a seasonally adjusted annual rate of $82.0 billion, 1.9% below the revised April estimate, yet highway construction was at a seasonally adjusted annual rate of $98.6 billion, 1.4% above the revised April estimate of $97.2 billion. Figure 5 shows the history of total S&L expenditures.
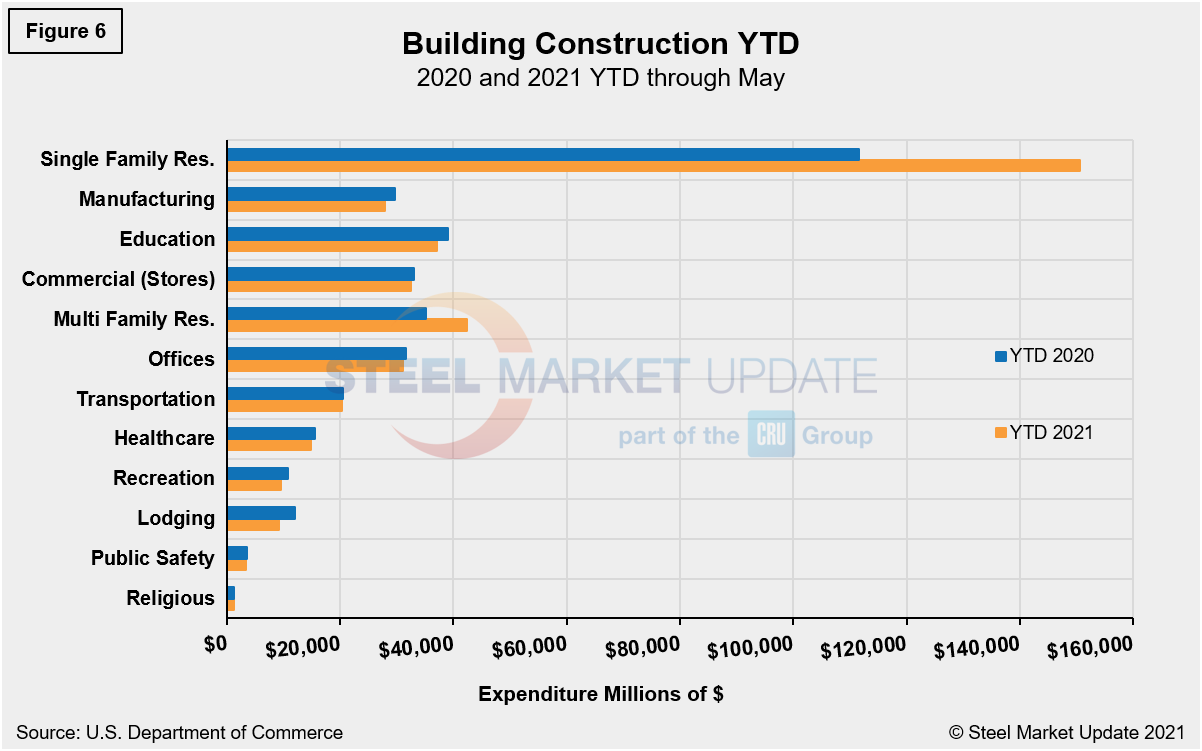
Year-to-date expenditures for construction of the various building sectors for 2020 and 2021 are compared in Figure 6. Single-family residential construction was dominant in 2020 with expenditures totalling $301.9 billion annualized, and it has not let up in 2021. Through May, expenditures for single-family construction were $150.7 billion or 35.0% above year-ago levels when expenditures were $111.6 billion. The only other sector indicating a positive delta year-on-year is multifamily residential with a growth of 20.8%. To underscore the continuing impact of the pandemic, all other sectors are still lagging on a year-to-date basis. Lodging and recreation are behind by double digits, 24.5% and 12.1% respectively.
Explanation: Each month, the Commerce Department issues its Construction Put in Place (CPIP) data, usually on the first working day covering activity one month and one day earlier. There are three major categories based on funding source: private, state and local, and federal. Within these three groups are about 120 subcategories of construction projects. SMU analyzes the expenditures from the three funding categories to provide a concise summary of the steel-consuming sectors.
By David Schollaert, David@SteelMarketUpdate.com


