

Analysis

August 2, 2021
June Construction Spending: Private Up, Public Down
Written by David Schollaert
The U.S. construction sector saw mixed results in June. Overall spending rose by 0.1%, the Commerce Department reported, as an increase in private projects was offset by a decline in the public building segment. Supply chain disruptions, rising materials prices and labor shortages continue to hamper a construction sector trying to rebound from the COVID downturn.
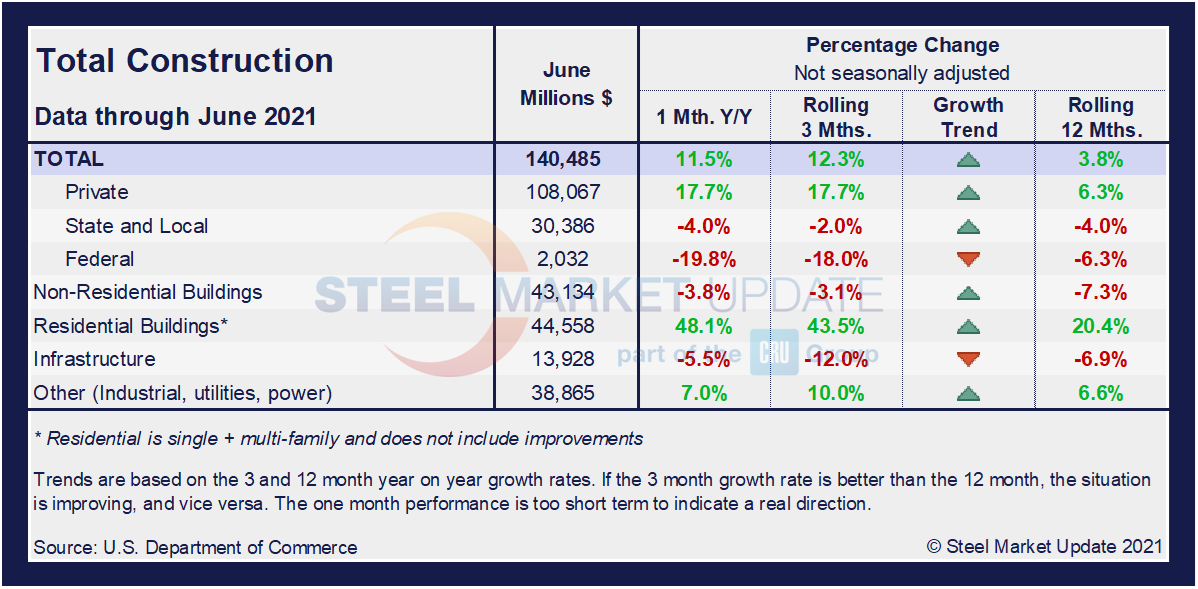
Total construction spending during June, at a seasonally adjusted annual rate, was $1.552 trillion, 0.1% above May’s revised pace of $1.551 trillion, reported the U.S. Census Bureau. Construction spending, which accounts for around 4% of U.S. gross domestic product, rose by 8.2% on a year-on-year basis in June after falling 0.2% in May. Year-to-date construction spending was $736.5 billion, up 5.6% versus 2020, a disappointing result as the marketplace is nearly a year removed from the worst of the pandemic.
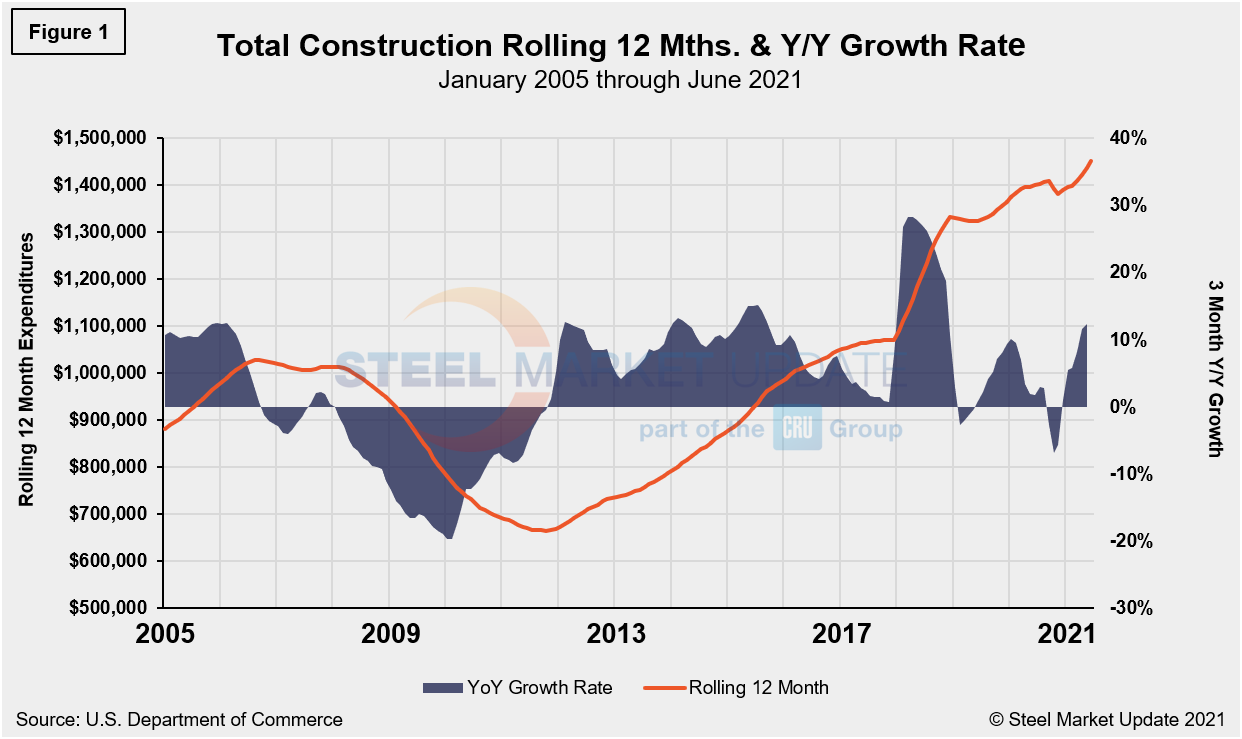
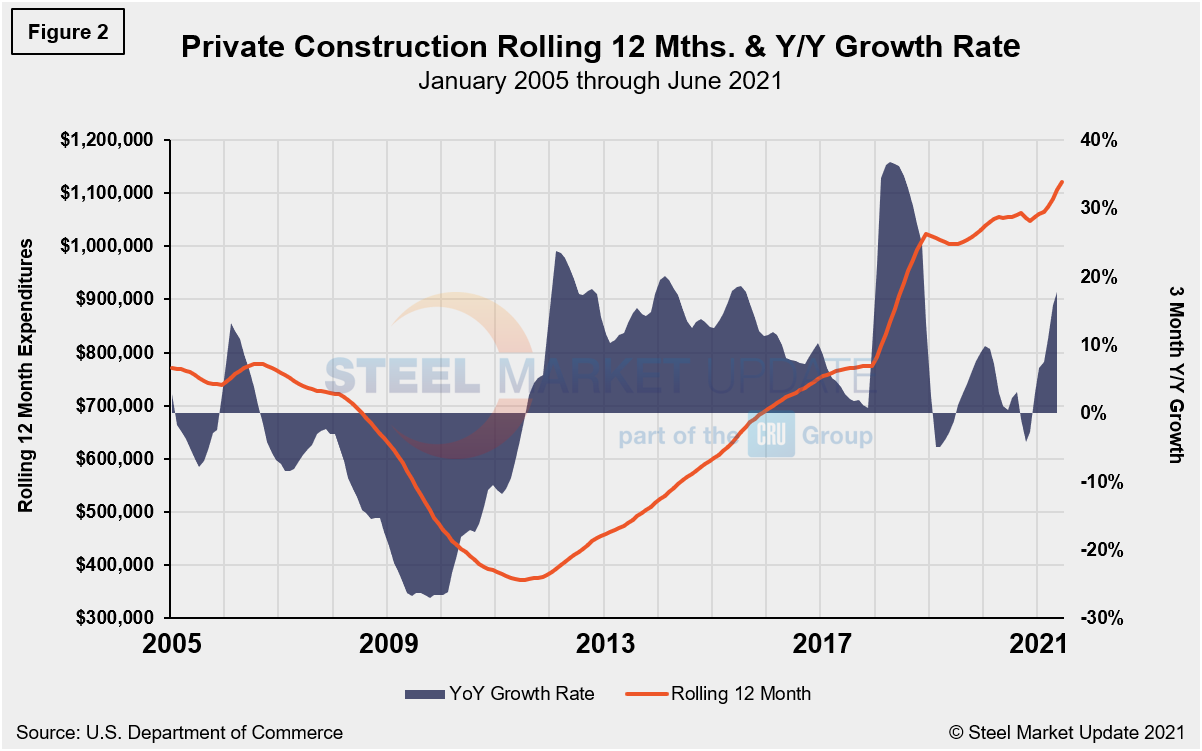
The private sector was just about the sole driver of growth across the domestic construction industry. Total construction spending is up year on year, driven almost singlehandedly by residential building, which grew by nearly 20.4% over the past 12 months, and is up 43.5% on a rolling three-months basis. Nonresidential spending is down 7.3% over the same period. Total construction expenditures are also shown in Figure 1.
Private Construction
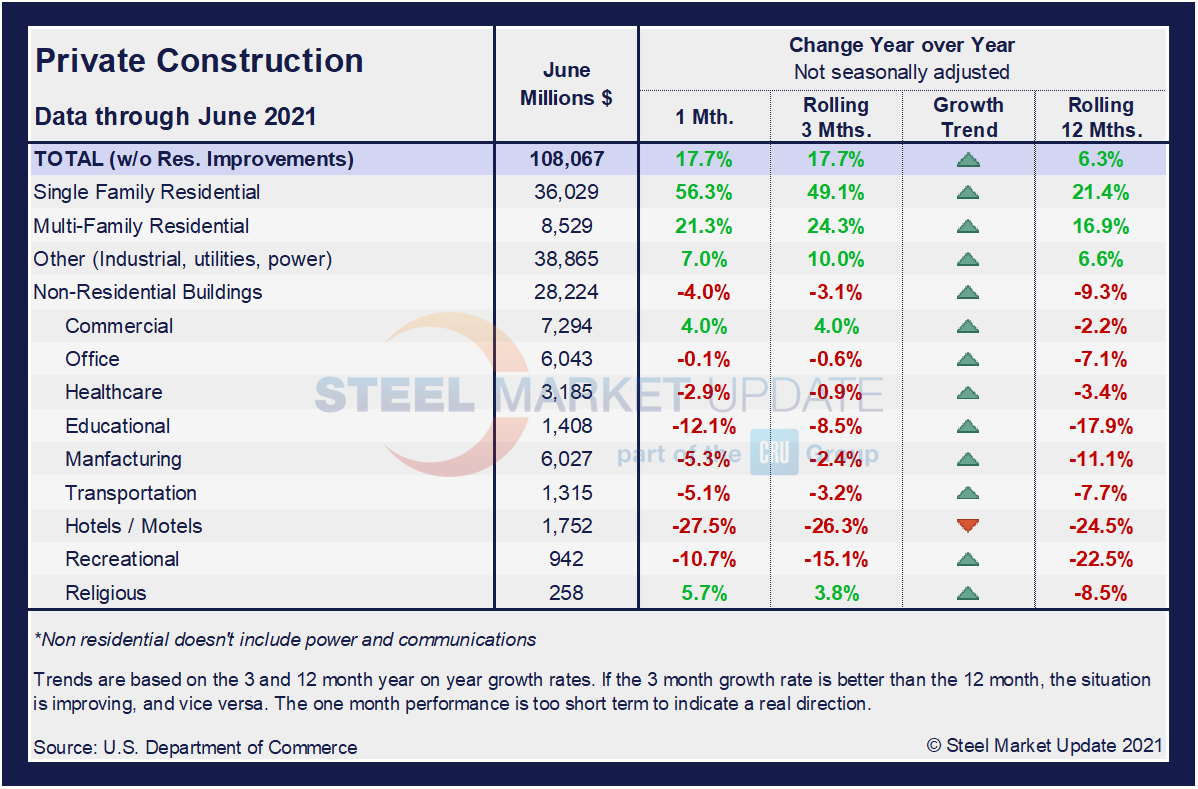
The breakdown of private expenditures into residential and nonresidential and their subsectors are highlighted in the table below. Spending on private construction projects climbed 0.4%, with outlays on residential projects increasing 1.1%. Single-family homebuilding spending was up 1.8%, after outlays on residential projects rose just 0.3% in May.
Residential construction has been the driving force in the private construction sector, as only two nonresidential subcategories are reporting any near- or long-term growth. Not surprising are the nonresidential subcategories hit hardest by the pandemic shutdowns, such as recreational, hotels and educational construction, all down by more than 20.0% on a rolling 12-month basis. Single-family and multifamily residential construction are up 21.4% and 16.9%, respectively, on a rolling 12-month basis. Single-family residential construction posted an astonishing 56.3% annual growth rate in June.
Although demand for housing remains robust, a rise in the cost of building materials, especially framing lumber, are constraining builders’ ability to ramp up construction and close inventory gaps, driving up home prices and crimping sales.
Spending on private construction in June was at a seasonally adjusted annual rate of $1.215 trillion, 0.4% above the revised May estimate of $1.210 trillion. Residential construction was at a seasonally adjusted annual rate of $763.4 billion in June, up 1.1% above the revised May estimate. Nonresidential construction was at a seasonally adjusted annual rate of $451.8 billion in June, down 0.7% from May’s revised estimate.
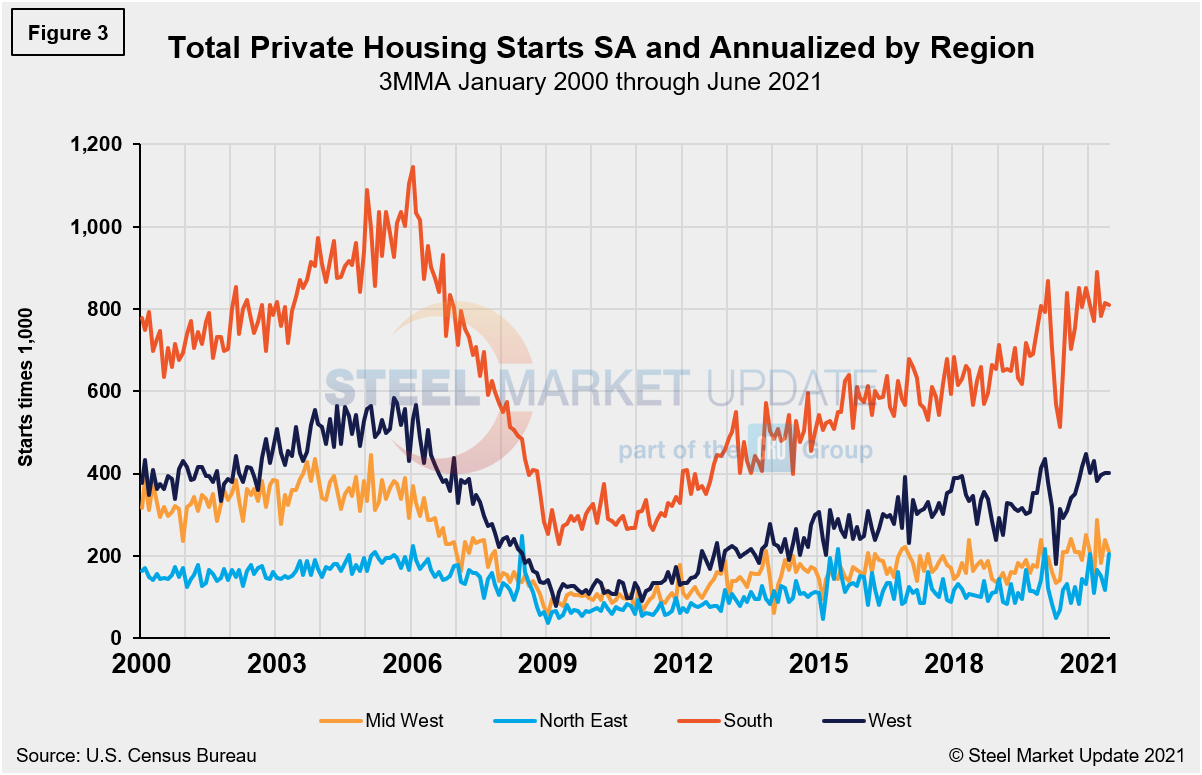
Total housing starts in the four regions are displayed below (Figure 3). Privately‐owned housing starts in June were at a seasonally adjusted annual rate of 1.598 million, down 5.1% from the revised May estimate of 1.683 million. The sharp decrease in June is a direct result of the continued supply chain disruptions, rising materials prices and labor shortages that have been plaguing residential construction. Despite the month-on-month fall, June’s rate is 45.6% above the year-ago rate. Single‐family housing starts in June were at a rate of 1.063 million, down 6.3% from the revised May figure of 1.134 million. June’s total is also down by 37.3% from the peak of 1.823 million seen in January 2006.
The South region continues to be the strongest for housing starts at 811,000 in June, besting the West—the second-place region—by more than double. The Northeast continued to trail the other three regions with 204,000 starts in June, but was the only region to post an increase in June, up 9.0% from the month prior. All four regions were directly impacted by the widespread COVID-19 shutdowns last year, causing housing starts to fall sharply. Since then, however, they have nearly recovered to pre-pandemic levels.
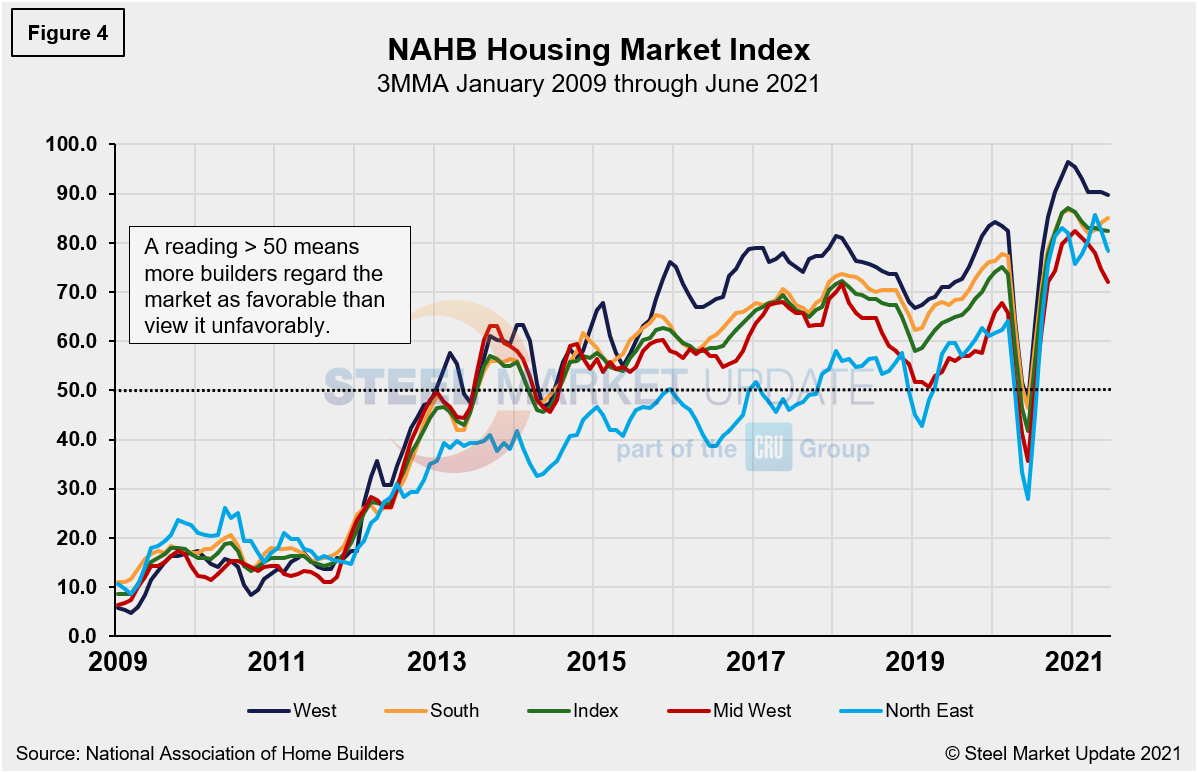
The National Association of Home Builders optimism index plummeted in April 2020 at the onset of COVID-19, but then recovered from May through December last year. Since the beginning of 2021, optimism among home builders has wavered up and down within a small range due to the high costs of lumber and other building materials and the shortage of skilled labor—but remains in positive territory. The index registered 81 in June, down from 83 the month prior. Advanced reports indicate that the index may slip further in July (Figure 4).
State and Local Construction
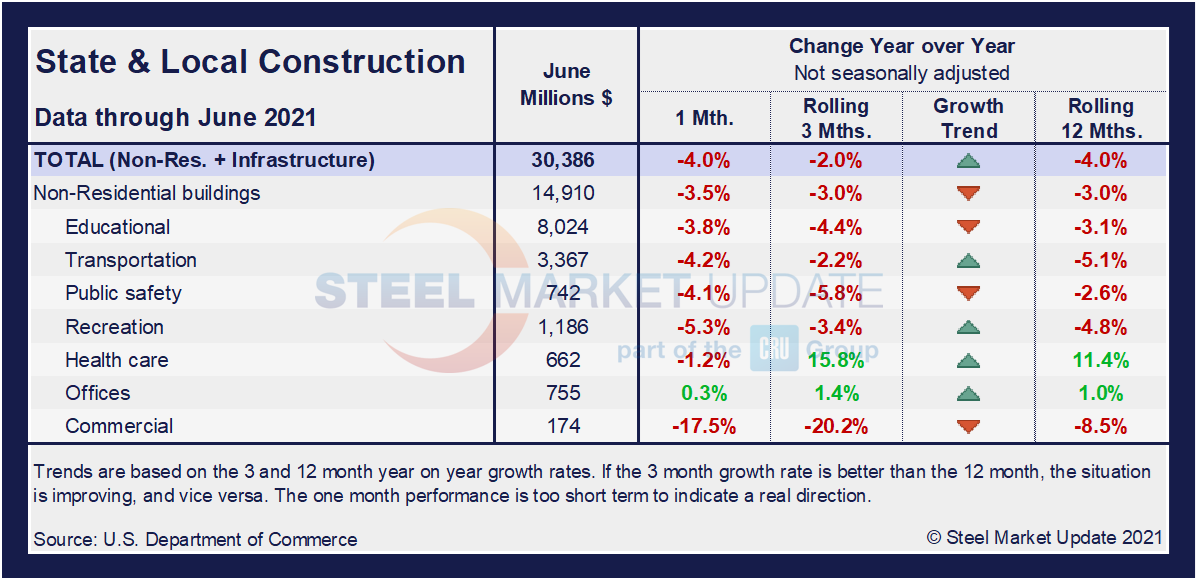
Construction expenditures on a state and local level remain the most impacted by the 16-month-long health crisis. Notably, on a year-on-year and rolling three-month basis, these construction categories and subcategories are still behind pre-pandemic levels. The exception is the offices subcategory that has seen a 1.0% increase from one year ago. The table below details a split sector where half remain on the decline while half are seeing rising growth rates. Despite some improvement, only health care and office construction are above year-ago levels.
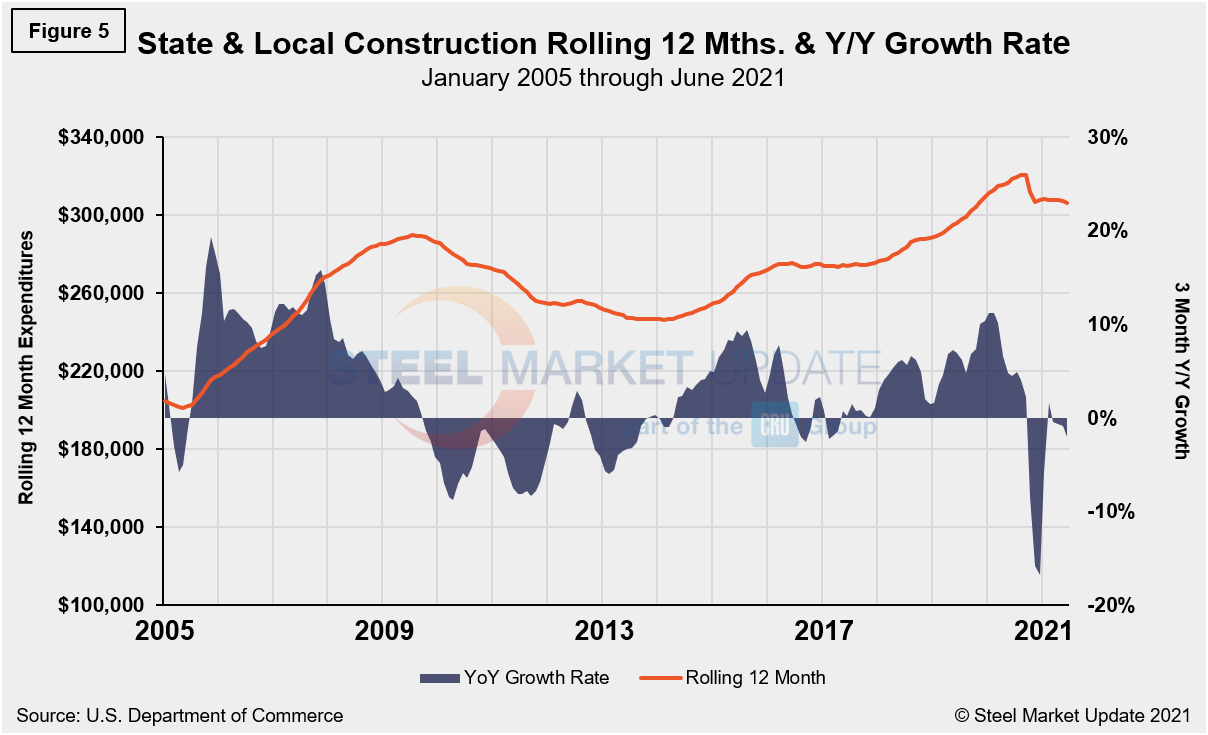
In three months through June, overall state and local construction was down 2.0%, a contraction from the month prior when the sector was down 0.8%, with half of the subcategories still trending down. In June, the estimated seasonally adjusted annual rate of public construction spending was $337.0 billion, 1.2% below the revised May estimate of $340.9 billion. Educational construction was at a seasonally adjusted annual rate of $81.3 billion, 0.8% below May’s revised estimate, and highway construction was at a seasonally adjusted annual rate of $92.4 billion, 5.3% below the May estimate of $97.5 billion. Figure 5 shows the history of total S&L expenditures.
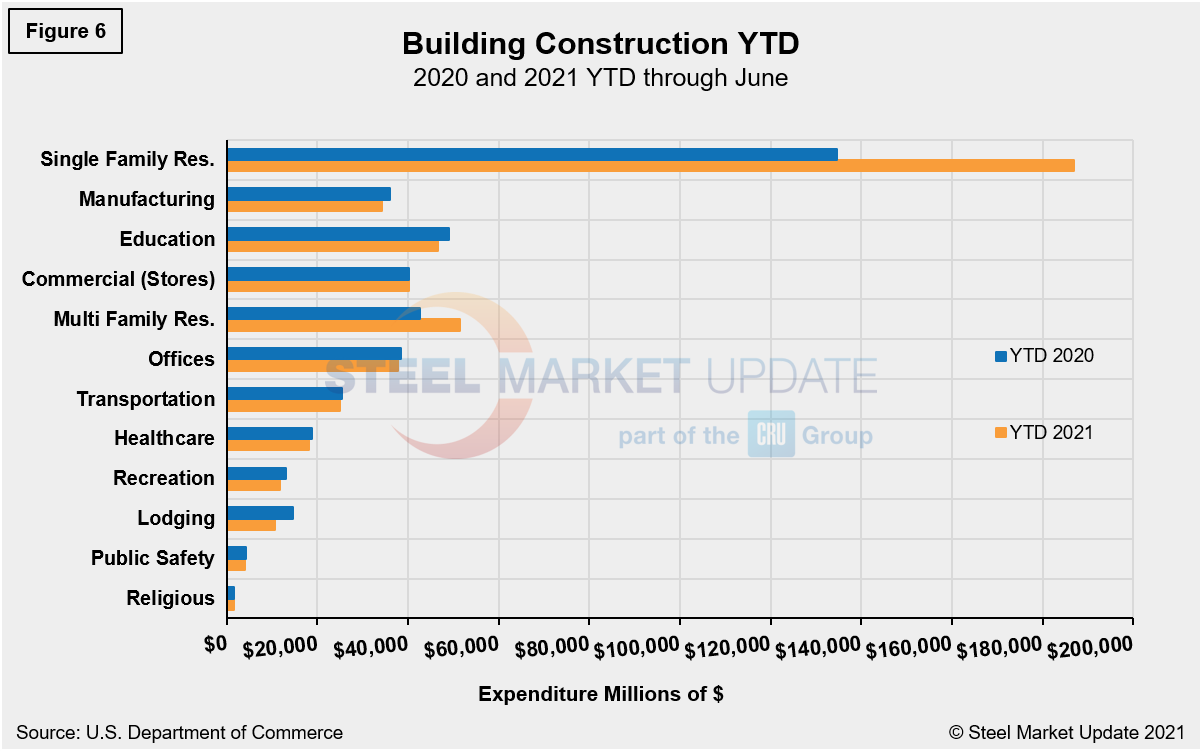
Year-to-date expenditures for construction of the various building sectors for 2020 and 2021 are compared in Figure 6. Single-family residential construction was dominant in 2020 with expenditures totaling an annualized $301.9 billion. To date, 2021 has been the same. Through June, expenditures for single-family construction were $186.8 billion or 38.7% above year-ago levels when expenditures were $134.7 billion. The only other sector seeing a positive delta year-on-year is multifamily residential with a growth of 20.7%. To underscore the continuing impact of the pandemic, all other sectors are still lagging on a year-to-date basis. Lodging and recreation are behind by double digits, 26.4% and 11.5%, respectively.
Explanation: Each month, the Commerce Department issues its Construction Put in Place (CPIP) data, usually on the first working day covering activity one month and one day earlier. There are three major categories based on funding source: private, state and local, and federal. Within these three groups are about 120 subcategories of construction projects. SMU analyzes the expenditures from the three funding categories to provide a concise summary of the steel-consuming sectors.
By David Schollaert, David@SteelMarketUpdate.com


