

Market Data

August 10, 2021
Employment by Industry: Nearly a Million Workers Added to Payrolls in July
Written by David Schollaert
The U.S. labor market saw its best monthly performance in nearly a year in July, reported the U.S. Bureau of Labor Statistics (BLS). The latest data shows a flood of 943,000 new workers added to payrolls in July, as the American economy roared into midsummer.
With just under 3 million new jobs added from May through July, the U.S. labor market report was accompanied by a sharp drop in the unemployment rate to 5.4% – the lowest since the pandemic began – from 5.9% in June. Leisure and hospitality, the sector hit hardest by the pandemic, once again led the payroll recovery in July, adding 380,000 jobs, with two-thirds of the job gains in food services. Also seeing strong job growth in July were local government education, and professional and business services.
The unemployment rate slid by 0.5% in July, to 5.4%, the lowest mark in 16 months. Despite the strong showing in July, some hesitation lingers as much of the data was collected in the first half of last month, before the Delta variant of the coronavirus exploded in many parts of the country. There are concerns that a sustained outbreak could pose a threat to industries just regaining their footing.
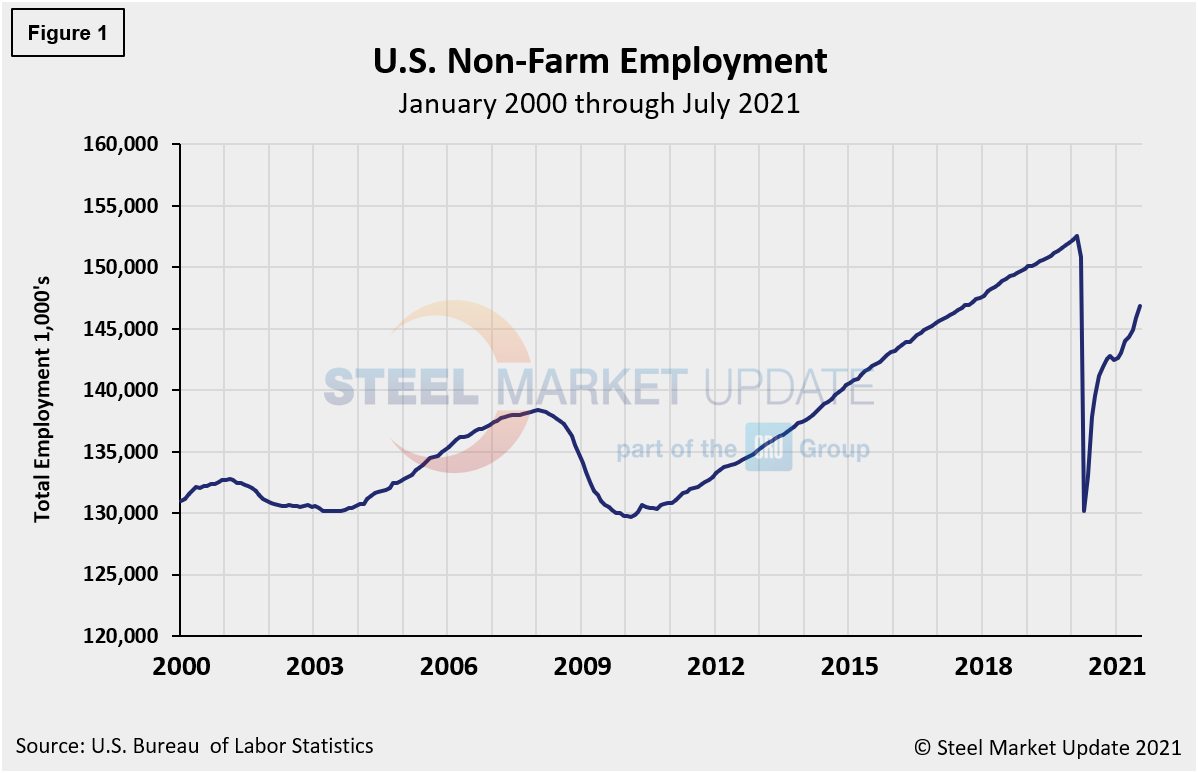
The number of unemployed persons fell by 662,000 to 9.2 million last month. To date, the U.S. has recovered 13.3 million, or 59%, of the 22.5 million jobs lost last spring, leaving the nation approximately 3.0 million jobs below its pre-pandemic level, when the unemployment rate was just 3.5%. Figure 1 shows the total number of people employed in the nonfarm economy.
Designed on rolling time periods of 1 month, 3 months, 1 year and 2 years, the table below breaks total employment into service industries and goods-producing industries, and then into private and government employees. Most of the goods-producing employees work in manufacturing and construction. Comparing service and goods-producing industries in July shows service jobs to have increased by 0.7%, while goods-producing jobs rose by 0.2% from June’s result. Note, the subcomponents of both manufacturing and construction shown in this table don’t add up to the total because we have only included those with the most relevance to the steel industry.
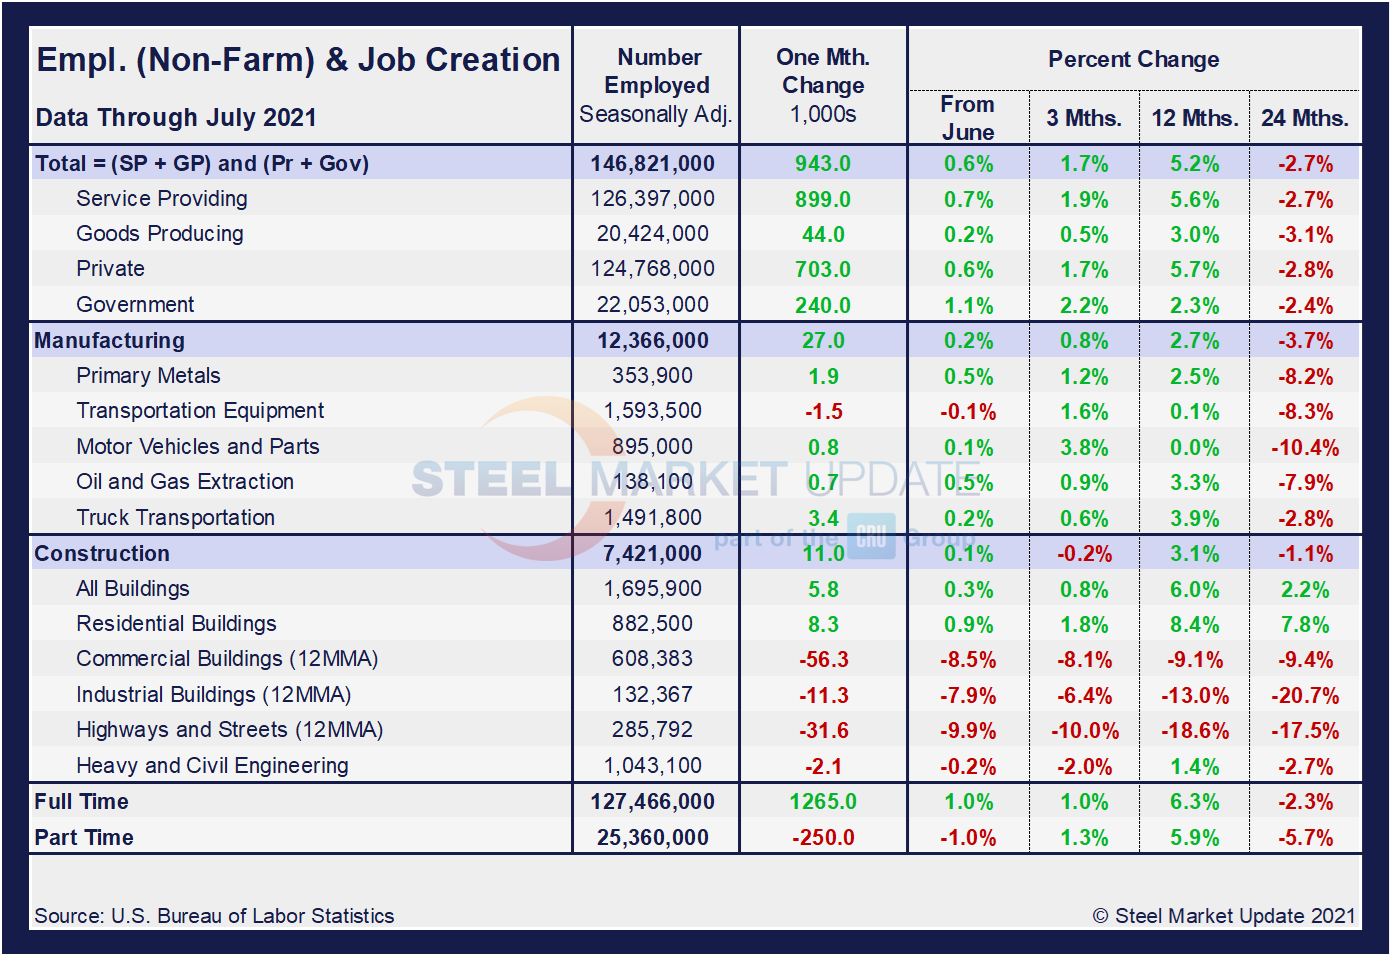
Comparing July to June, manufacturing employment was up 0.2% versus a gain 0.1% the month prior. Construction was up 0.1% month on month after dipping 0.1% in June. Despite the repeated gains in June and July, the inconsistencies and struggles across some subcomponents since the beginning of the year – especially in the construction sector – still point to significant obstacles facing the U.S. economy and domestic job creation. And three-month, 12-month and 24-month comparisons remain problematic due to the extensive losses resulting from pandemic. In the year-over-year contrast, manufacturing is up just 2.7% and construction is up 3.1%. Further growth is still expected as the marketplace advances from the freefall seen during the second quarter of 2020.
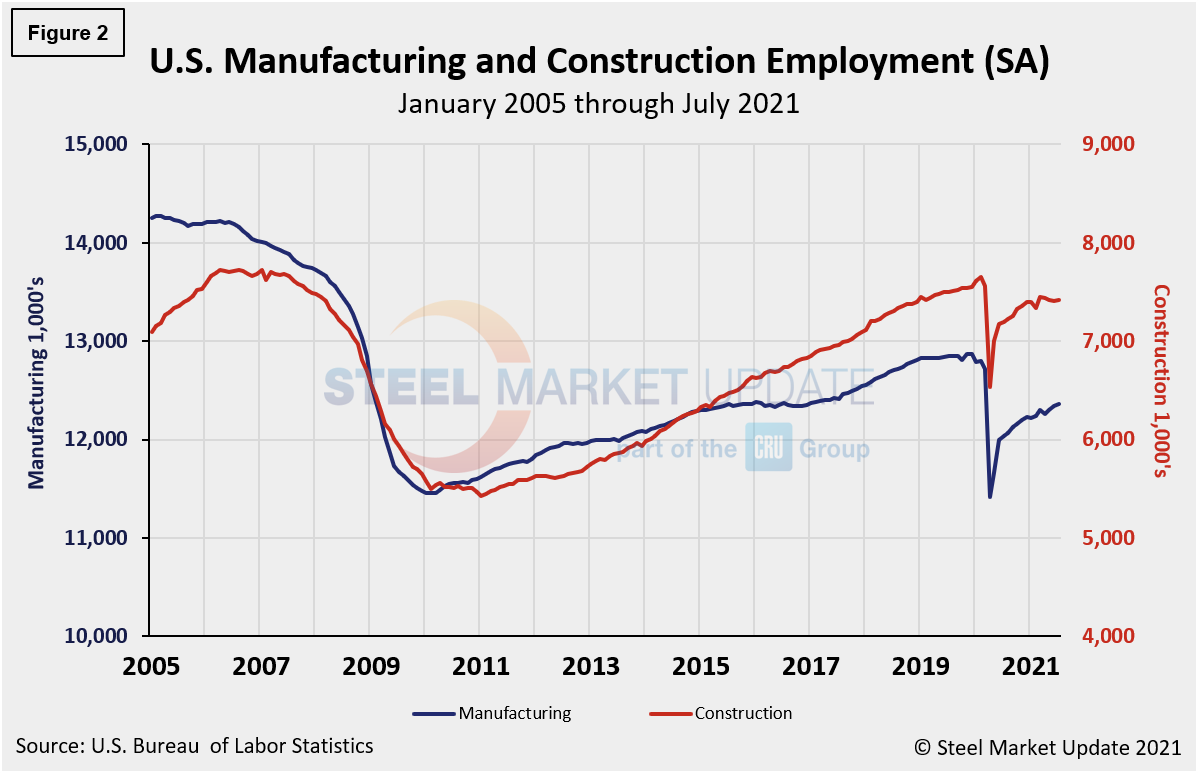
Manufacturing employment increased by 27,000 jobs in June compared to an increase of 15,000 the month prior, led by an increase in durable goods, specifically 7,000 jobs in machinery and 6,000 in miscellaneous durable goods manufacturing. Employment in manufacturing is down by 433,000 from its level in February 2020. Construction employment was largely unchanged month on month, up by a slight 6,000 in July. Employment in the construction industry overall is still 227,000 below its February 2020 level, according to the BLS data. Figure 2 shows the history of employment in manufacturing and construction since January 2005, seasonally adjusted.
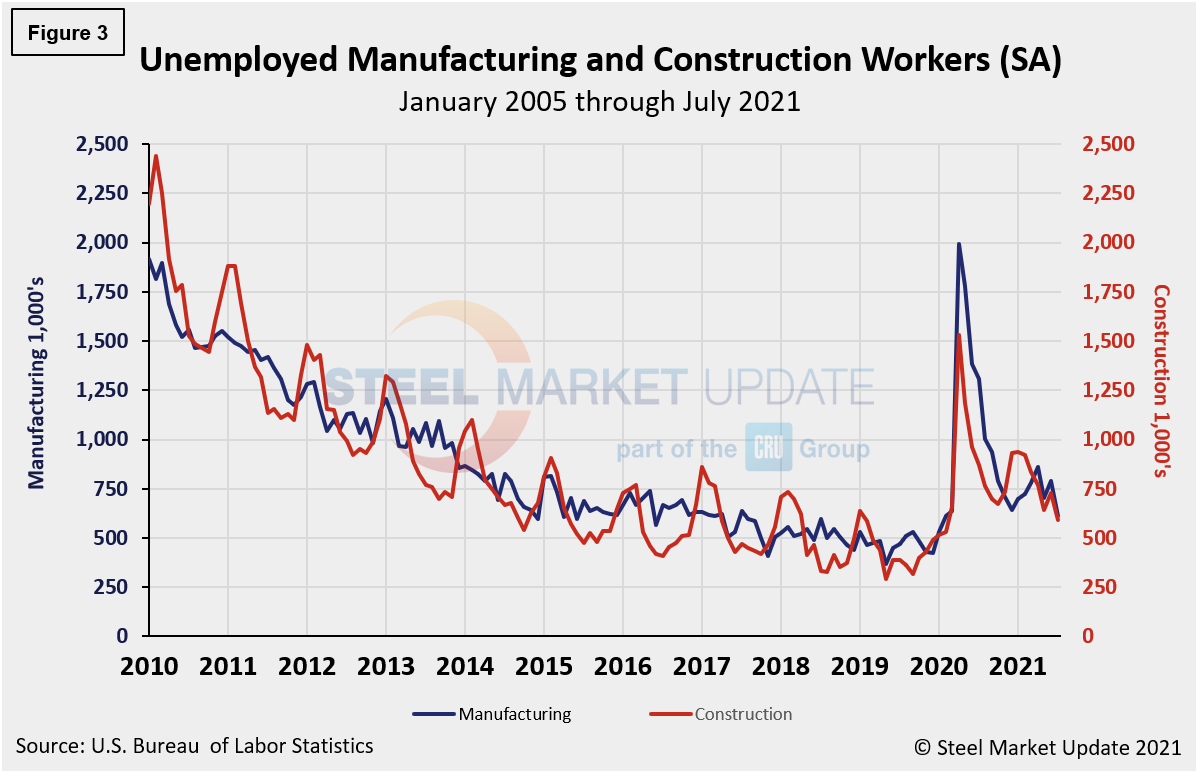
The reported number of unemployed manufacturing and construction workers is shown in Figure 3. Both manufacturing and construction unemployment decreased in July. Manufacturing’s unemployed persons fell from 792,000 in June to 613,000 in July, a 22.6% decrease month on month. Construction unemployment was down by 18.9% month on month, from 730,000 in June to 592,000 in July.
Explanation: On the first or second Friday of each month, the Bureau of Labor Statistics releases the employment data for the previous month. Data is available at www.bls.gov. The BLS employment database is a reality check for other economic data streams such as manufacturing and construction. It is easy to drill down into the BLS database to obtain employment data for many subsectors of the economy. The important point about all these data streams is not necessarily the nominal numbers, but the direction in which they are headed.
By David Schollaert, David@SteelMarketUpdate.com


