

Market Data

August 10, 2021
U.S. Job Creation: Hiring Accelerates in July
Written by David Schollaert
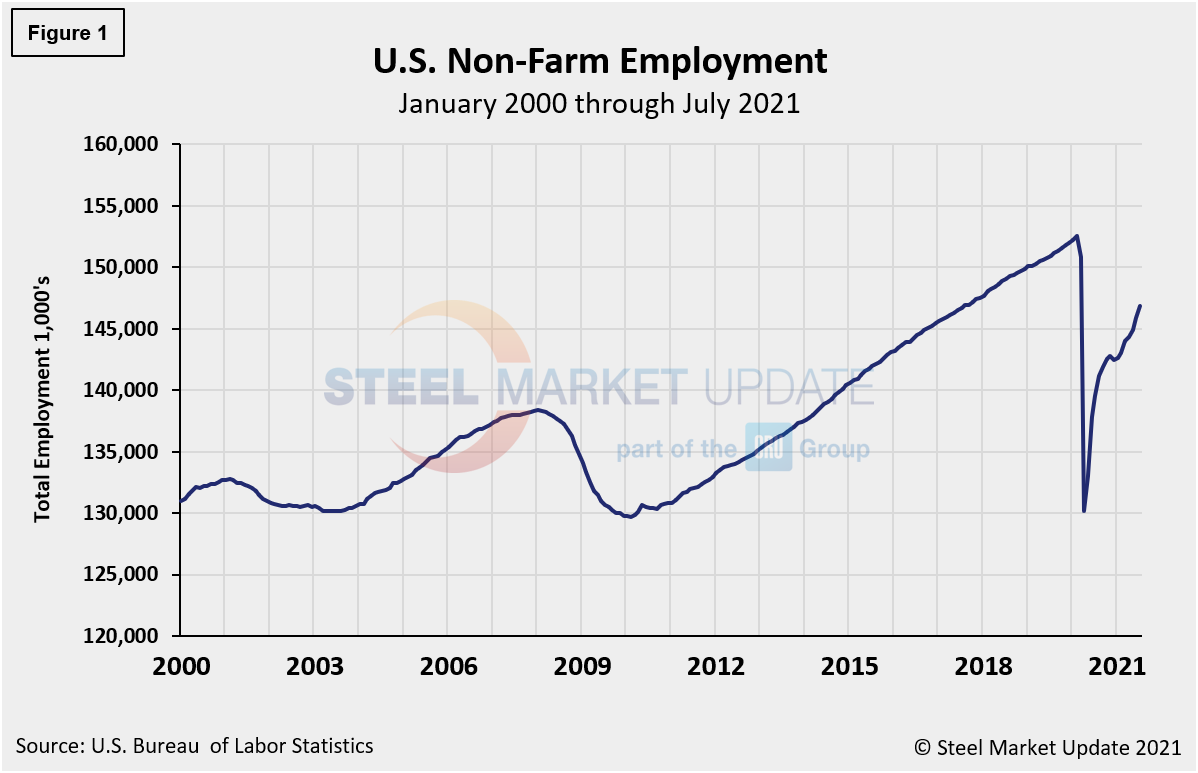
The U.S. economy continued to accelerate in July, as hiring rose at its fastest pace in nearly a year. Nonfarm payrolls increased by 943,000 for the month, while the unemployment rate dropped to 5.4%, according to the Bureau of Labor Statistics (BLS). The payroll increase was the best since August 2020.
Following sizable jumps in employment in May and June, July’s showing reinforced the case that the recovery is proceeding, helped by healthy consumer spending, trillions of dollars in government support and a pickup in business investment. Upward revisions to May and June figures show that more than 2.5 million jobs have been added in the last three months, putting the economy three-quarters of the way toward restoring the 22.4 million positions wiped out at the pandemic’s start last year.
Job gains came fastest in leisure and hospitality, followed by education and professional and business services. Leisure and hospitality added 380,000 positions, of which 253,000 came in bars and restaurants. The sector took the hardest hit during the pandemic, but has been showing consistent gains during the economic reopening. The unemployment rate for leisure and hospitality tumbled to 9% in July from 10.9% in June, compared to 25% a year earlier. There are still about 1.8 million fewer workers overall, however, than prior to the pandemic.
Local governments added 221,000 education jobs in July, after a jump in June, and private institutions tacked on 40,000. Manufacturing and construction showed more modest increases, hampered by higher prices for goods, supply chain disruptions, and a shortage of components like semiconductors. Retail jobs declined slightly after two months of big gains. But employment in professional and business services jumped by 60,000, a sign that the white-collar sector is on the upswing. Figure 1 shows the total number of nonfarm workers employed in the U.S. since 2000.
For much of the year, companies have reported challenges in filling openings and complained that the current labor market is exceedingly tight. The July report offered signs that some workers are coming off the sidelines, however, a welcomed sight as employers have tried to rebuild their staffs to keep up with consumer demand.
The number of long-term unemployed (out-of-work for at least 27 consecutive weeks) increased by 560,000 in July, now comprising about 39.3% of the total unemployed. The participation rate rose marginally to 61.7% from 61.6% in June, still below the 63.4% in January 2020.
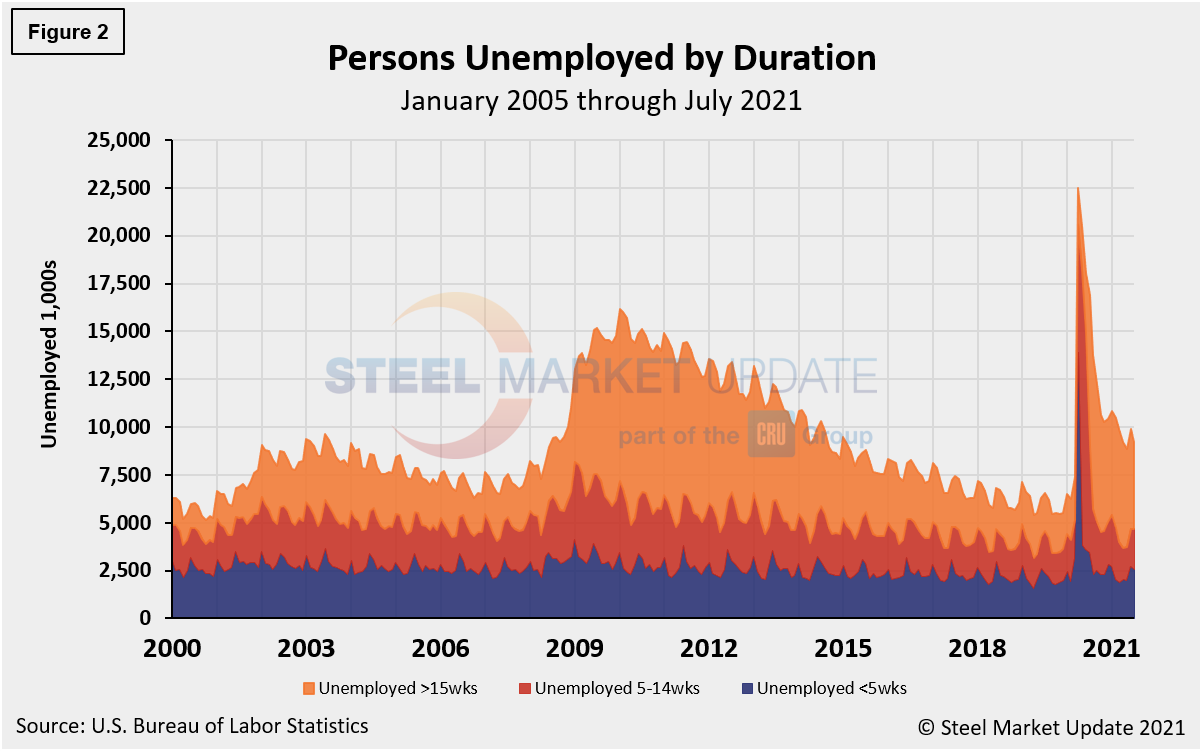
The historical picture for the duration of unemployment since January 2000 is broken down into <5 weeks, 5 to 14 weeks, and >15 weeks, noted below in Figure 2. The total number unemployed was 9,221,000 at the end of July, a decrease of 662,000 compared to June. Although unemployment remains above pre-pandemic levels by roughly 1.8 million people, about 13.3 million more people now have jobs compared to the 22.5 million thrown out of work during the worst of the pandemic in the spring of 2020. As of Aug. 6, 49.0% had been unemployed for more than 15 weeks, 23.5% for 5 to 14 weeks, and 27.5% for less than 5 weeks.
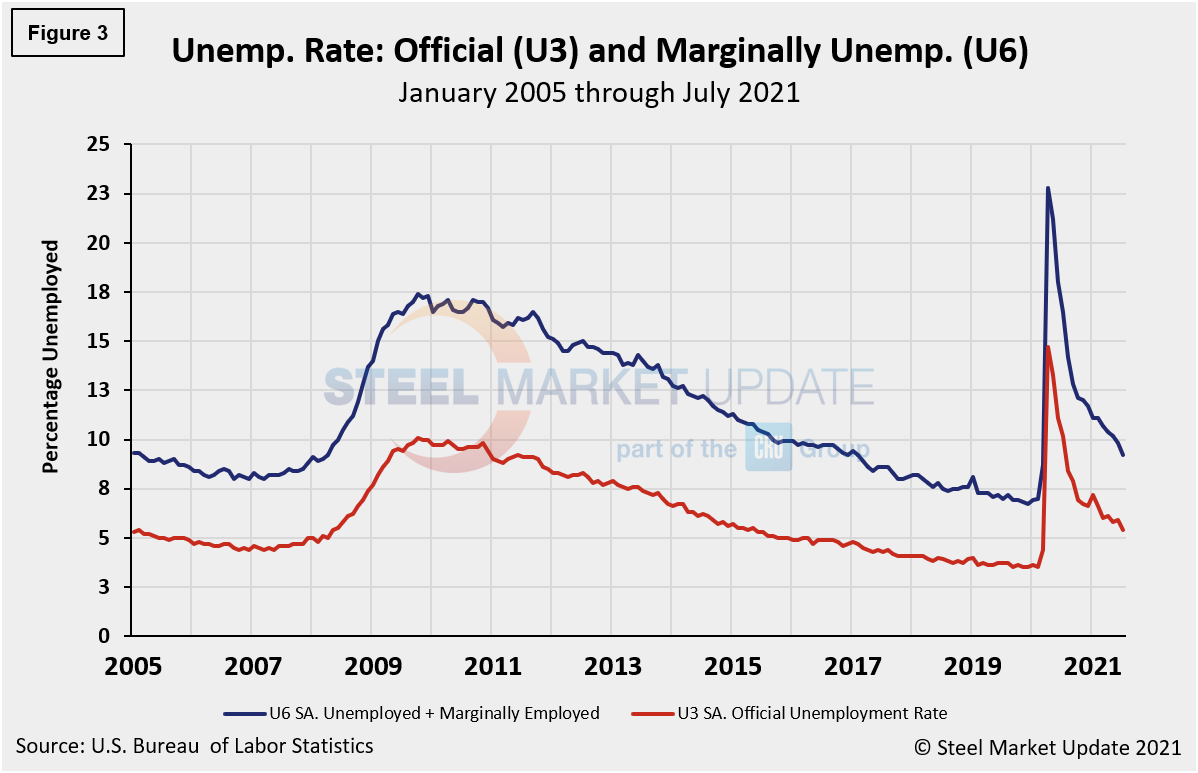
The official unemployment rate, U3, reported in the BLS Household survey (see explanation below) increased from 3.5% in February 2020 to 14.7% in April 2020. After rising to 6.5%, July’s fall to 5.4% was the lowest mark in 15 months as approximately 261,000 people re-entered the labor force. The more comprehensive U6 unemployment rate also dipped last month to 9.2% from 9.8% in June – a continued improvement from 22.8% in April 2020 (Figure 3). U6 includes individuals working part time who want full-time work and those who want to work but are so discouraged they have stopped looking.
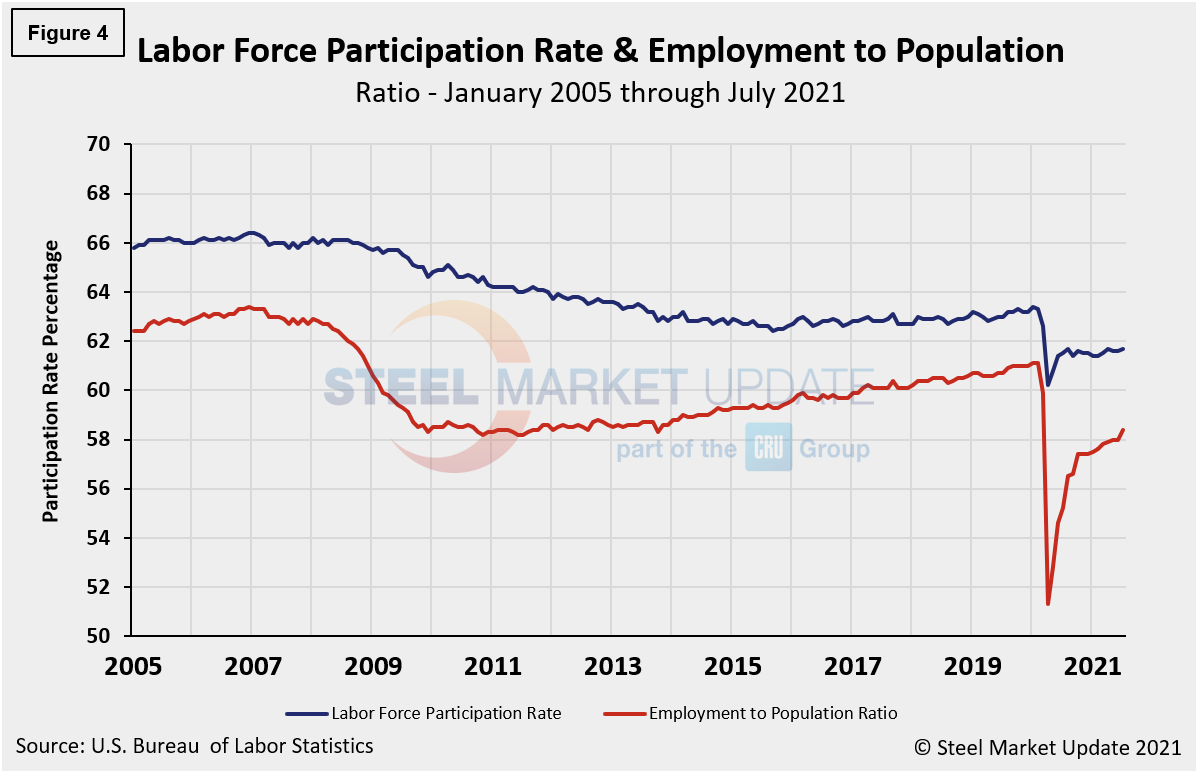
The drop in the headline unemployment rate looked even stronger considering that the labor force participation rate ticked up to 61.7%, tied for the highest level since the pandemic hit last March, but still well below the 63.4% in January 2020. A separate calculation that includes discouraged workers and those holding jobs part-time for economic reasons fell even further, to 9.2% from 9.8% in June.
Another gauge, and more definitive view, are the number employed as a percentage of the population. Last month, the employment-to-population ratio was 58.1%, a marginal increase from June when the ratio was 58.0%, highlighting the challenges many companies have reported in filling openings. Figure 4 shows both measures on one graph.
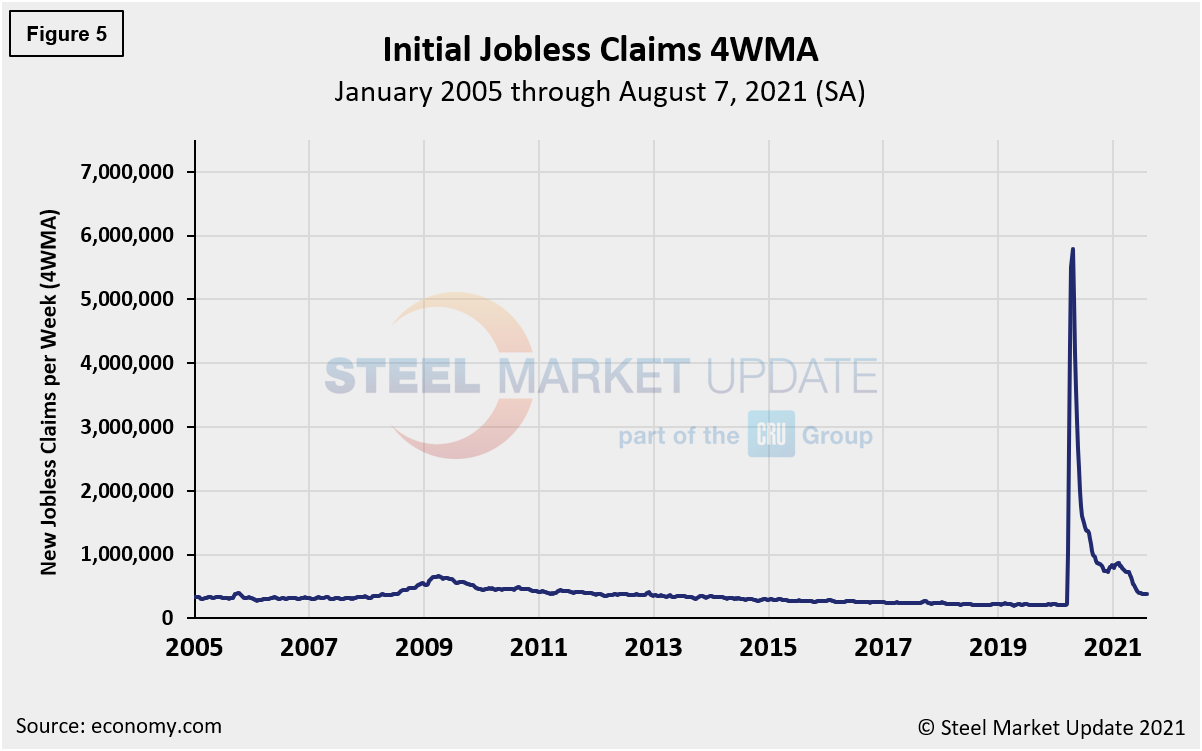
Initial claims for unemployment insurance, which are reported weekly by the Department of Labor, declined by 14,000 to 385,000 in the week ended July 31, but the decline reverses only some of the 56,000 increase seen in the previous weeks.
“New filings came in slightly better than our forecast for 387,000. Initial claims in the prior week were revised lower by 1,000 to 399,000,” reported Economy.com. “The number of those filing for Pandemic Unemployment Assistance rose from 93,060 to 94,476 in the week ended July 31. Continuing claims dropped from 3.296 million to 2.93 million in the week ended July 24, while the insured unemployment rate fell 0.3 percentage point to 2.1%. All told, the claims data may still be affected by the seasonal adjustment issues around the annual auto retooling and states ending expanded unemployment insurance benefits early.”
The recent change in initial claims continues to point to a recovering labor market. Figure 5 shows the four-week moving average of new claims since January 2005, seasonally adjusted.
Human resources consulting firm Challenger, Gray and Christmas Inc. produces a monthly employment update for the U.S. It reported that job cuts in July were 18,942, down 7.5% from the 20,476 reported in June. July’s total is 93% lower than the 262,649 job cuts seen in July 2020 because of the pandemic. Figure 6 shows the monthly job cuts reported by Challenger on a 3MMA basis since January 2007.
“In a healthy economy, there’s a good amount of churn,” said Challenger. “Right now, things appear to be stalling. It remains to be seen what the Delta variant may do to job cuts, if anything. At this point, companies are trying to attract and retain talent, not let them go.”
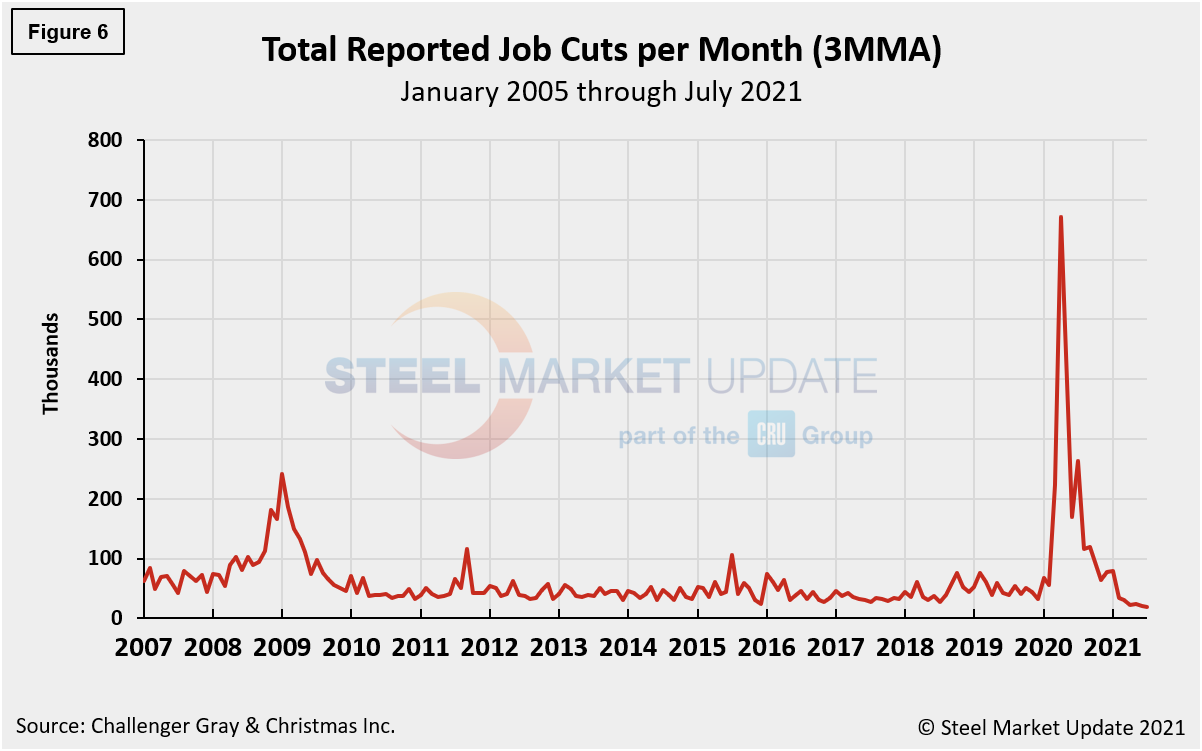
Last month’s job cuts total was the lowest since June 2000, when 17,241 cuts were announced. Year-to-date, employers have announced plans to cut 231,603 jobs from their payrolls, down 87.5% from the 1,847,696 jobs eliminated through the same period last year. That is the lowest January-July total on record. The second lowest occurred in 1997, when 233,915 cuts were tracked. The three-month moving average (3MMA) has declined in each of the last 14 months.
Explanation: On the first Friday of each month, the Bureau of Labor Statistics releases the employment data for the previous month. Data is available at www.bls.gov. The BLS reports on the results of two surveys. The Establishment survey reports the actual number employed by industry. The Household survey reports on the unemployment rate, participation rate, earnings, average workweek, the breakout into full-time and part-time workers and lots more details describing the age breakdown of the unemployed, reasons for and duration of unemployment.
By David Schollaert, David@SteelMarketUpdate.com


