Analysis

September 7, 2021
CPIP Data: Construction Spending Rises in July
Written by David Schollaert
Steel Market Update is pleased to share this Premium content with Executive members. For information on upgrading to a Premium-level subscription, email Info@SteelMarketUpdate.com.
The U.S. construction sector rose in July, lifted by gains in both the private and public sectors. Overall spending rose by 0.3% following a sideways revision for the month prior, the Commerce Department reported. Supply chain disruptions, rising materials prices and labor shortages continue to limit a construction sector trying to rebound from the COVID downturn, however.
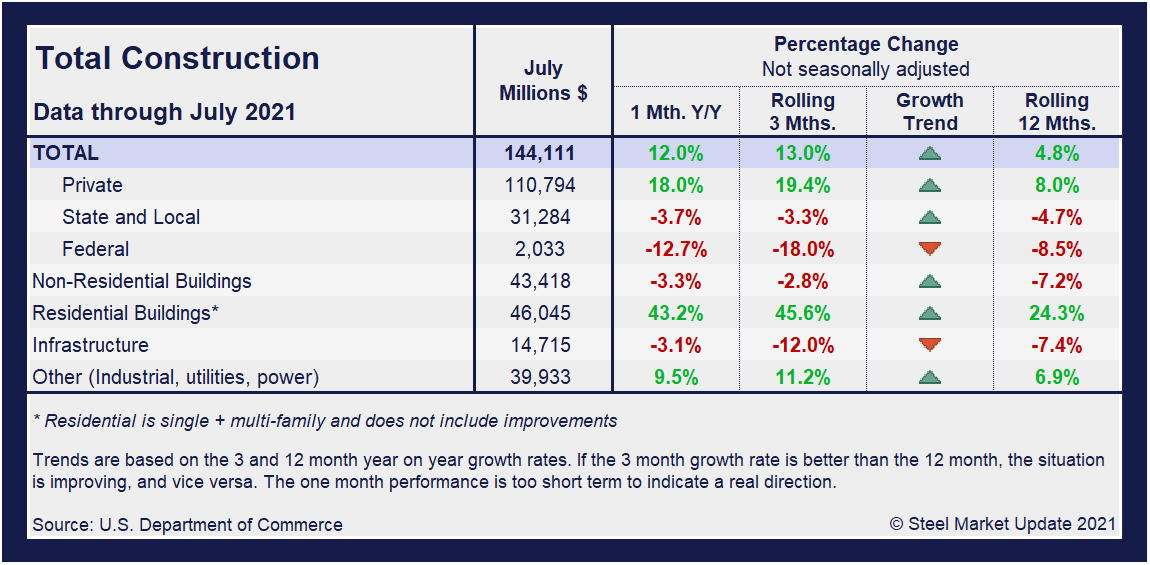
Total construction spending during July, at a seasonally adjusted annual rate, was $1.569 trillion, 0.3% above June’s revised pace of $1.563 trillion, reported the U.S. Census Bureau. Construction spending, which accounts for around 4% of U.S. gross domestic product, rose by 9.0% on a year-on-year basis in July following an 8.2% jump in June. Year-to-date, construction spending was $883.2 billion, up 6.2% versus 2020, a disappointing result as the marketplace is nearly a year removed from the worst of the pandemic.
The private sector was just about the sole driver of growth across the domestic construction industry. The bulk came in residential construction spending, which jumped 26.5%, while nonresidential construction spending dropped 4.2%. Risks from the resurgence of the coronavirus and supply chain difficulties could torpedo gains, however, according to the Associated General Contractors of America.
“The rapid spread of the delta variant of Covid-19 is causing a pullback in re-openings and travel that may lead some owners to postpone new projects,” said Ken Simonson, AGC’s chief economist. “Meanwhile, materials price increases, limited supplies of key materials, and long or uncertain delivery times are impeding the industry’s recovery.”
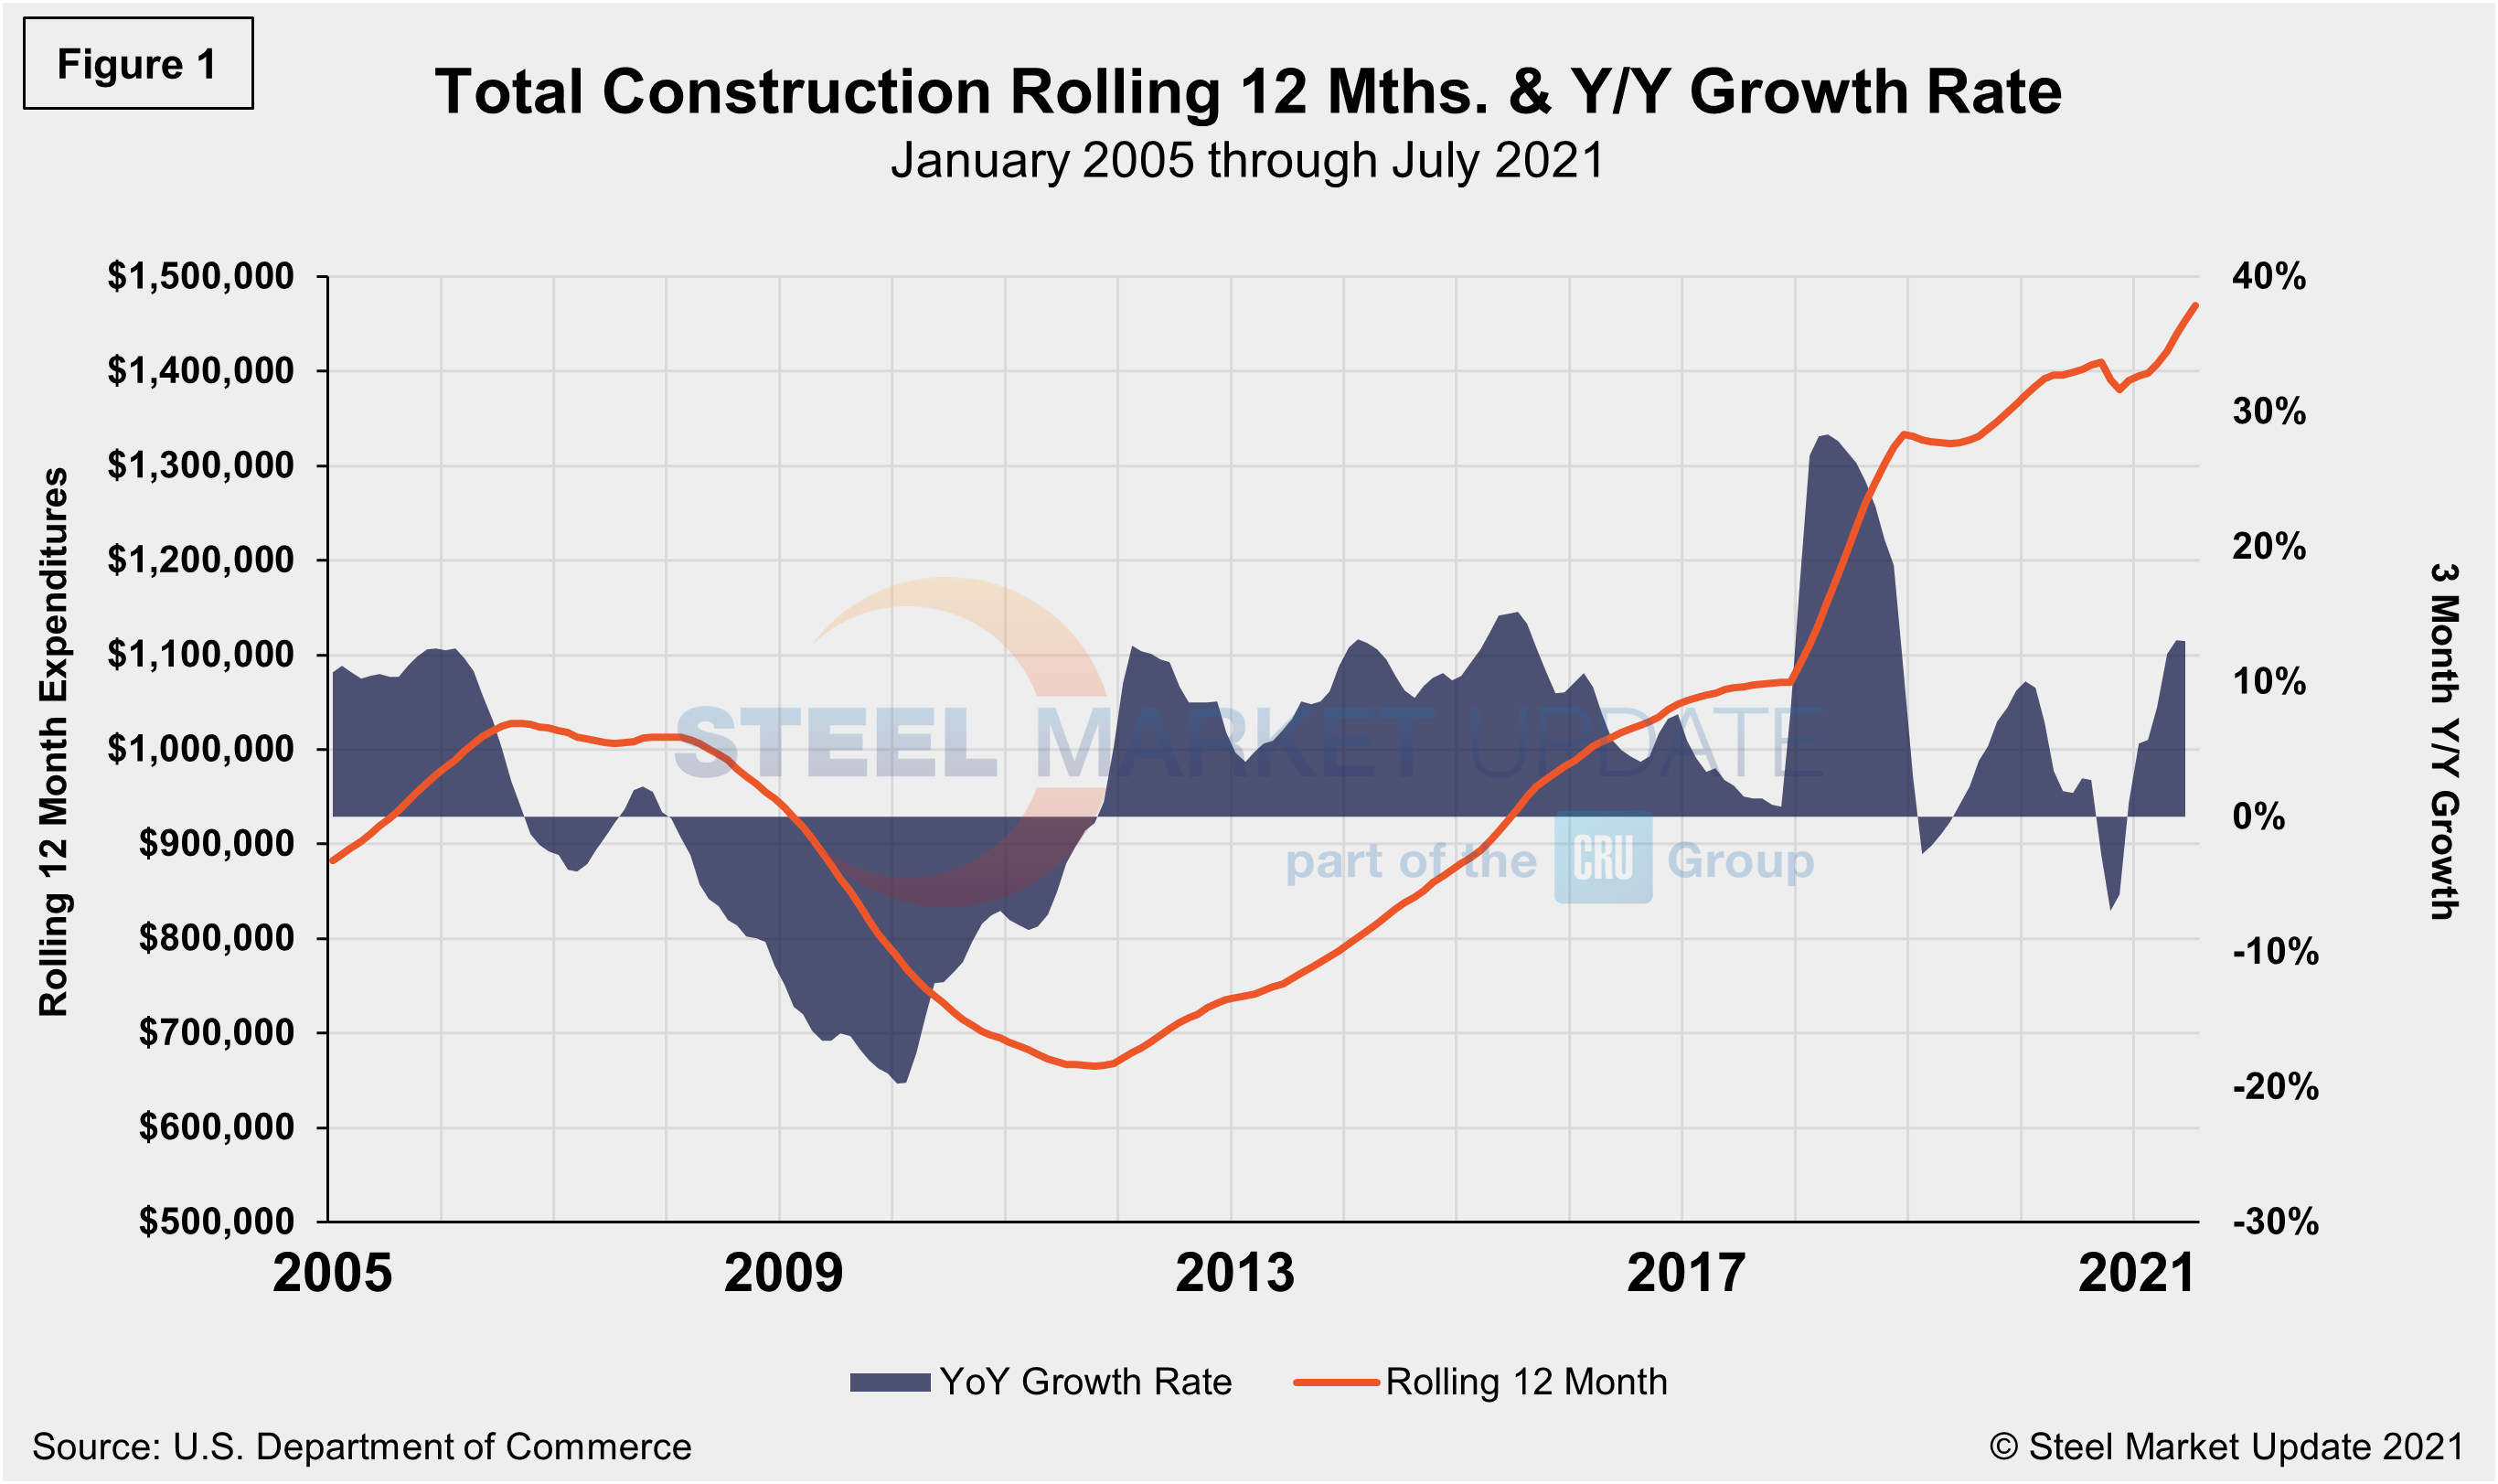
Total construction expenditures and its major categories are shown in the table and chart (Figure 1) below.
Private Construction
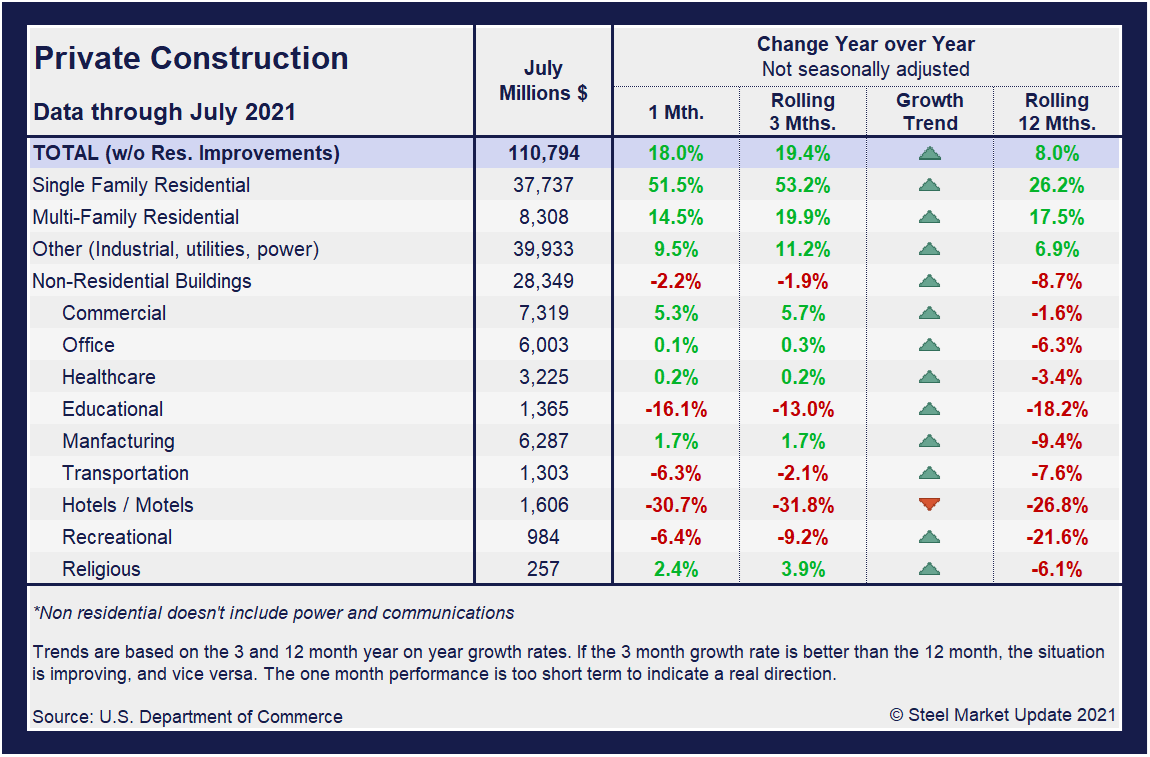
The breakdown of private expenditures into residential and nonresidential and their subsectors are highlighted in the table below. Private construction spending increased 13.6% year over year to an annual rate of $1.231 trillion. Within that category, private residential construction spending rose 27% annually while private nonresidential spending fell 3.6%.
Spending on private construction projects rose 0.3% after increasing 0.4% in June. Outlays on residential projects advanced 0.5%, with single-family homebuilding spending increasing 0.9%, driven by robust demand for housing. Spending on residential projects increased 0.8% in July. The pace is slowing, however, because of expensive building materials as well as land and labor shortages.
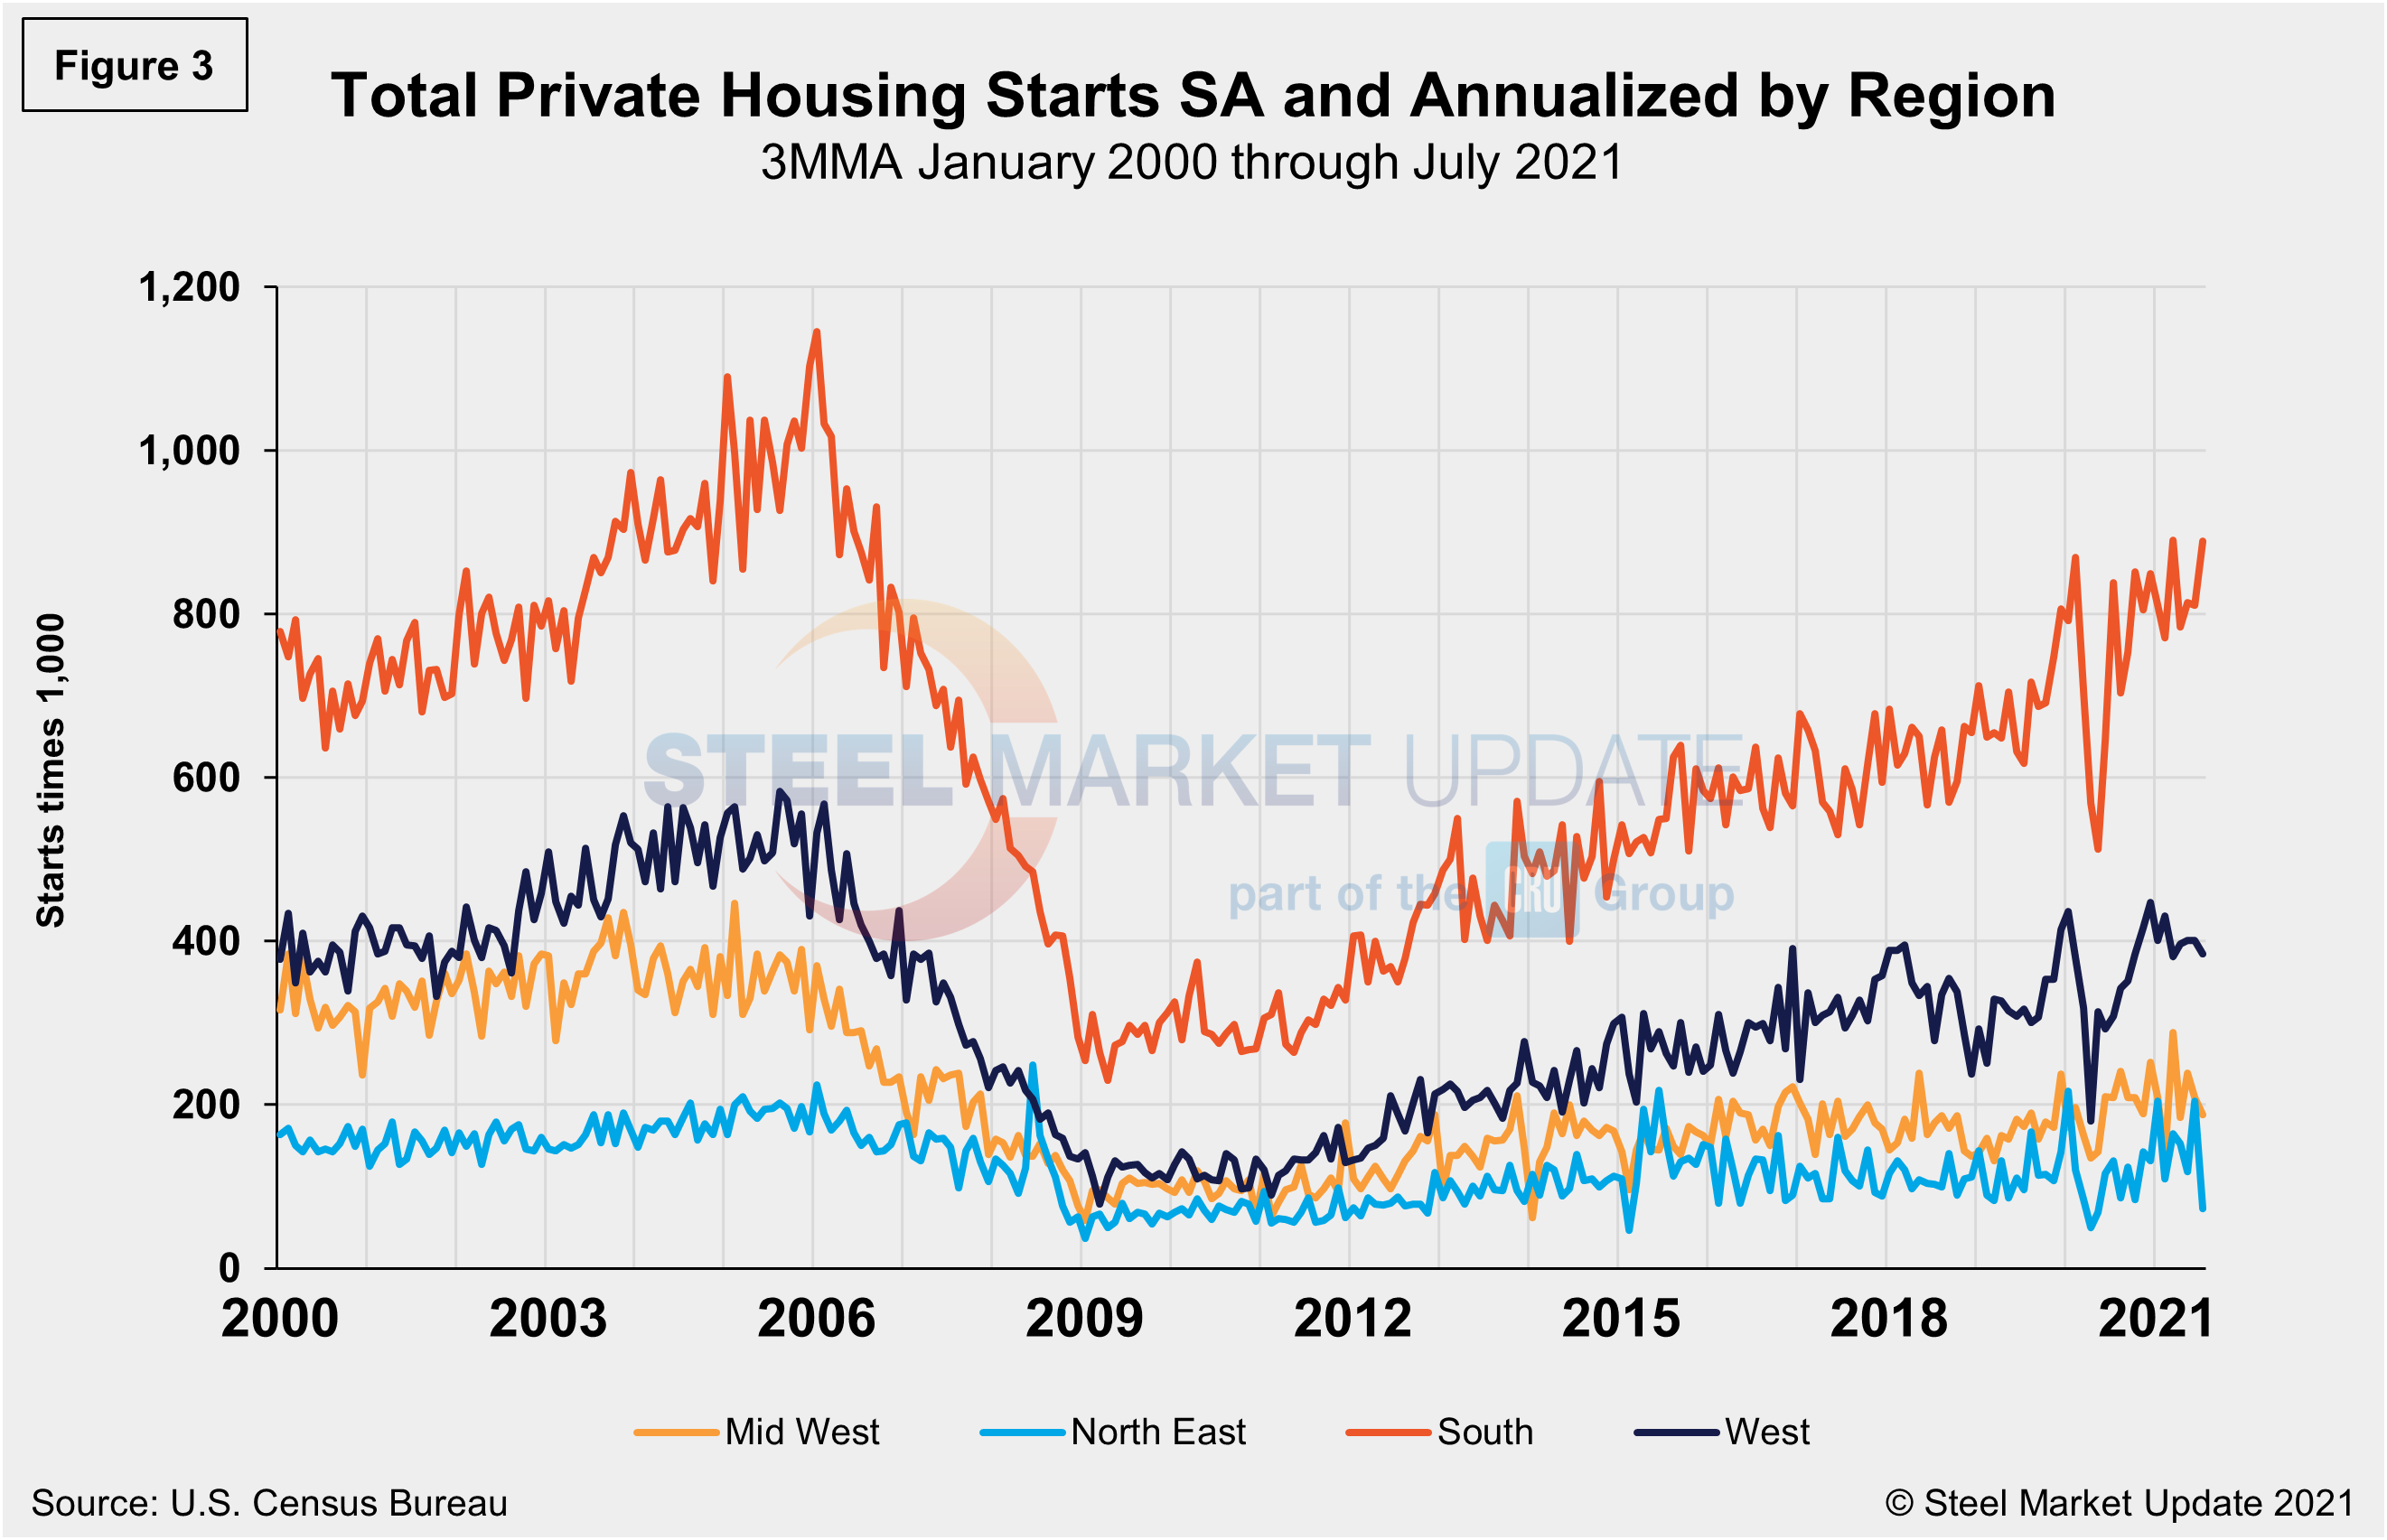
Total housing starts in the four regions are displayed below (Figure 3). Privately‐owned housing starts in July were at a seasonally adjusted annual rate of 1.534 million, down 7.0% from the revised June estimate of 1.650 million. The sharp decrease in July is a direct result of the continued supply chain disruptions, rising materials prices and labor shortages that have been limiting residential construction. Despite the month-on-month fall, June’s rate is 24.8% above the year-ago rate. Single‐family housing starts in July were at a rate of 1.111 million, down marginally from the revised June figure of 1.143 million. July’s total is also down by 39.1% from the peak of 1.823 million seen in January 2006.
The South region continues to be the strongest for housing starts at 889,000 in July, besting the West—the second-place region—by more than double. The Northeast continued to trail the other three regions with just 73,000 starts in July, its lowest market since May 2020. All four regions were directly impacted by the widespread COVID-19 shutdowns last year, causing housing starts to fall sharply. Since then, they had recovered to pre-pandemic levels, but have seen recent decreases due to supply-side limitations and rising material costs.
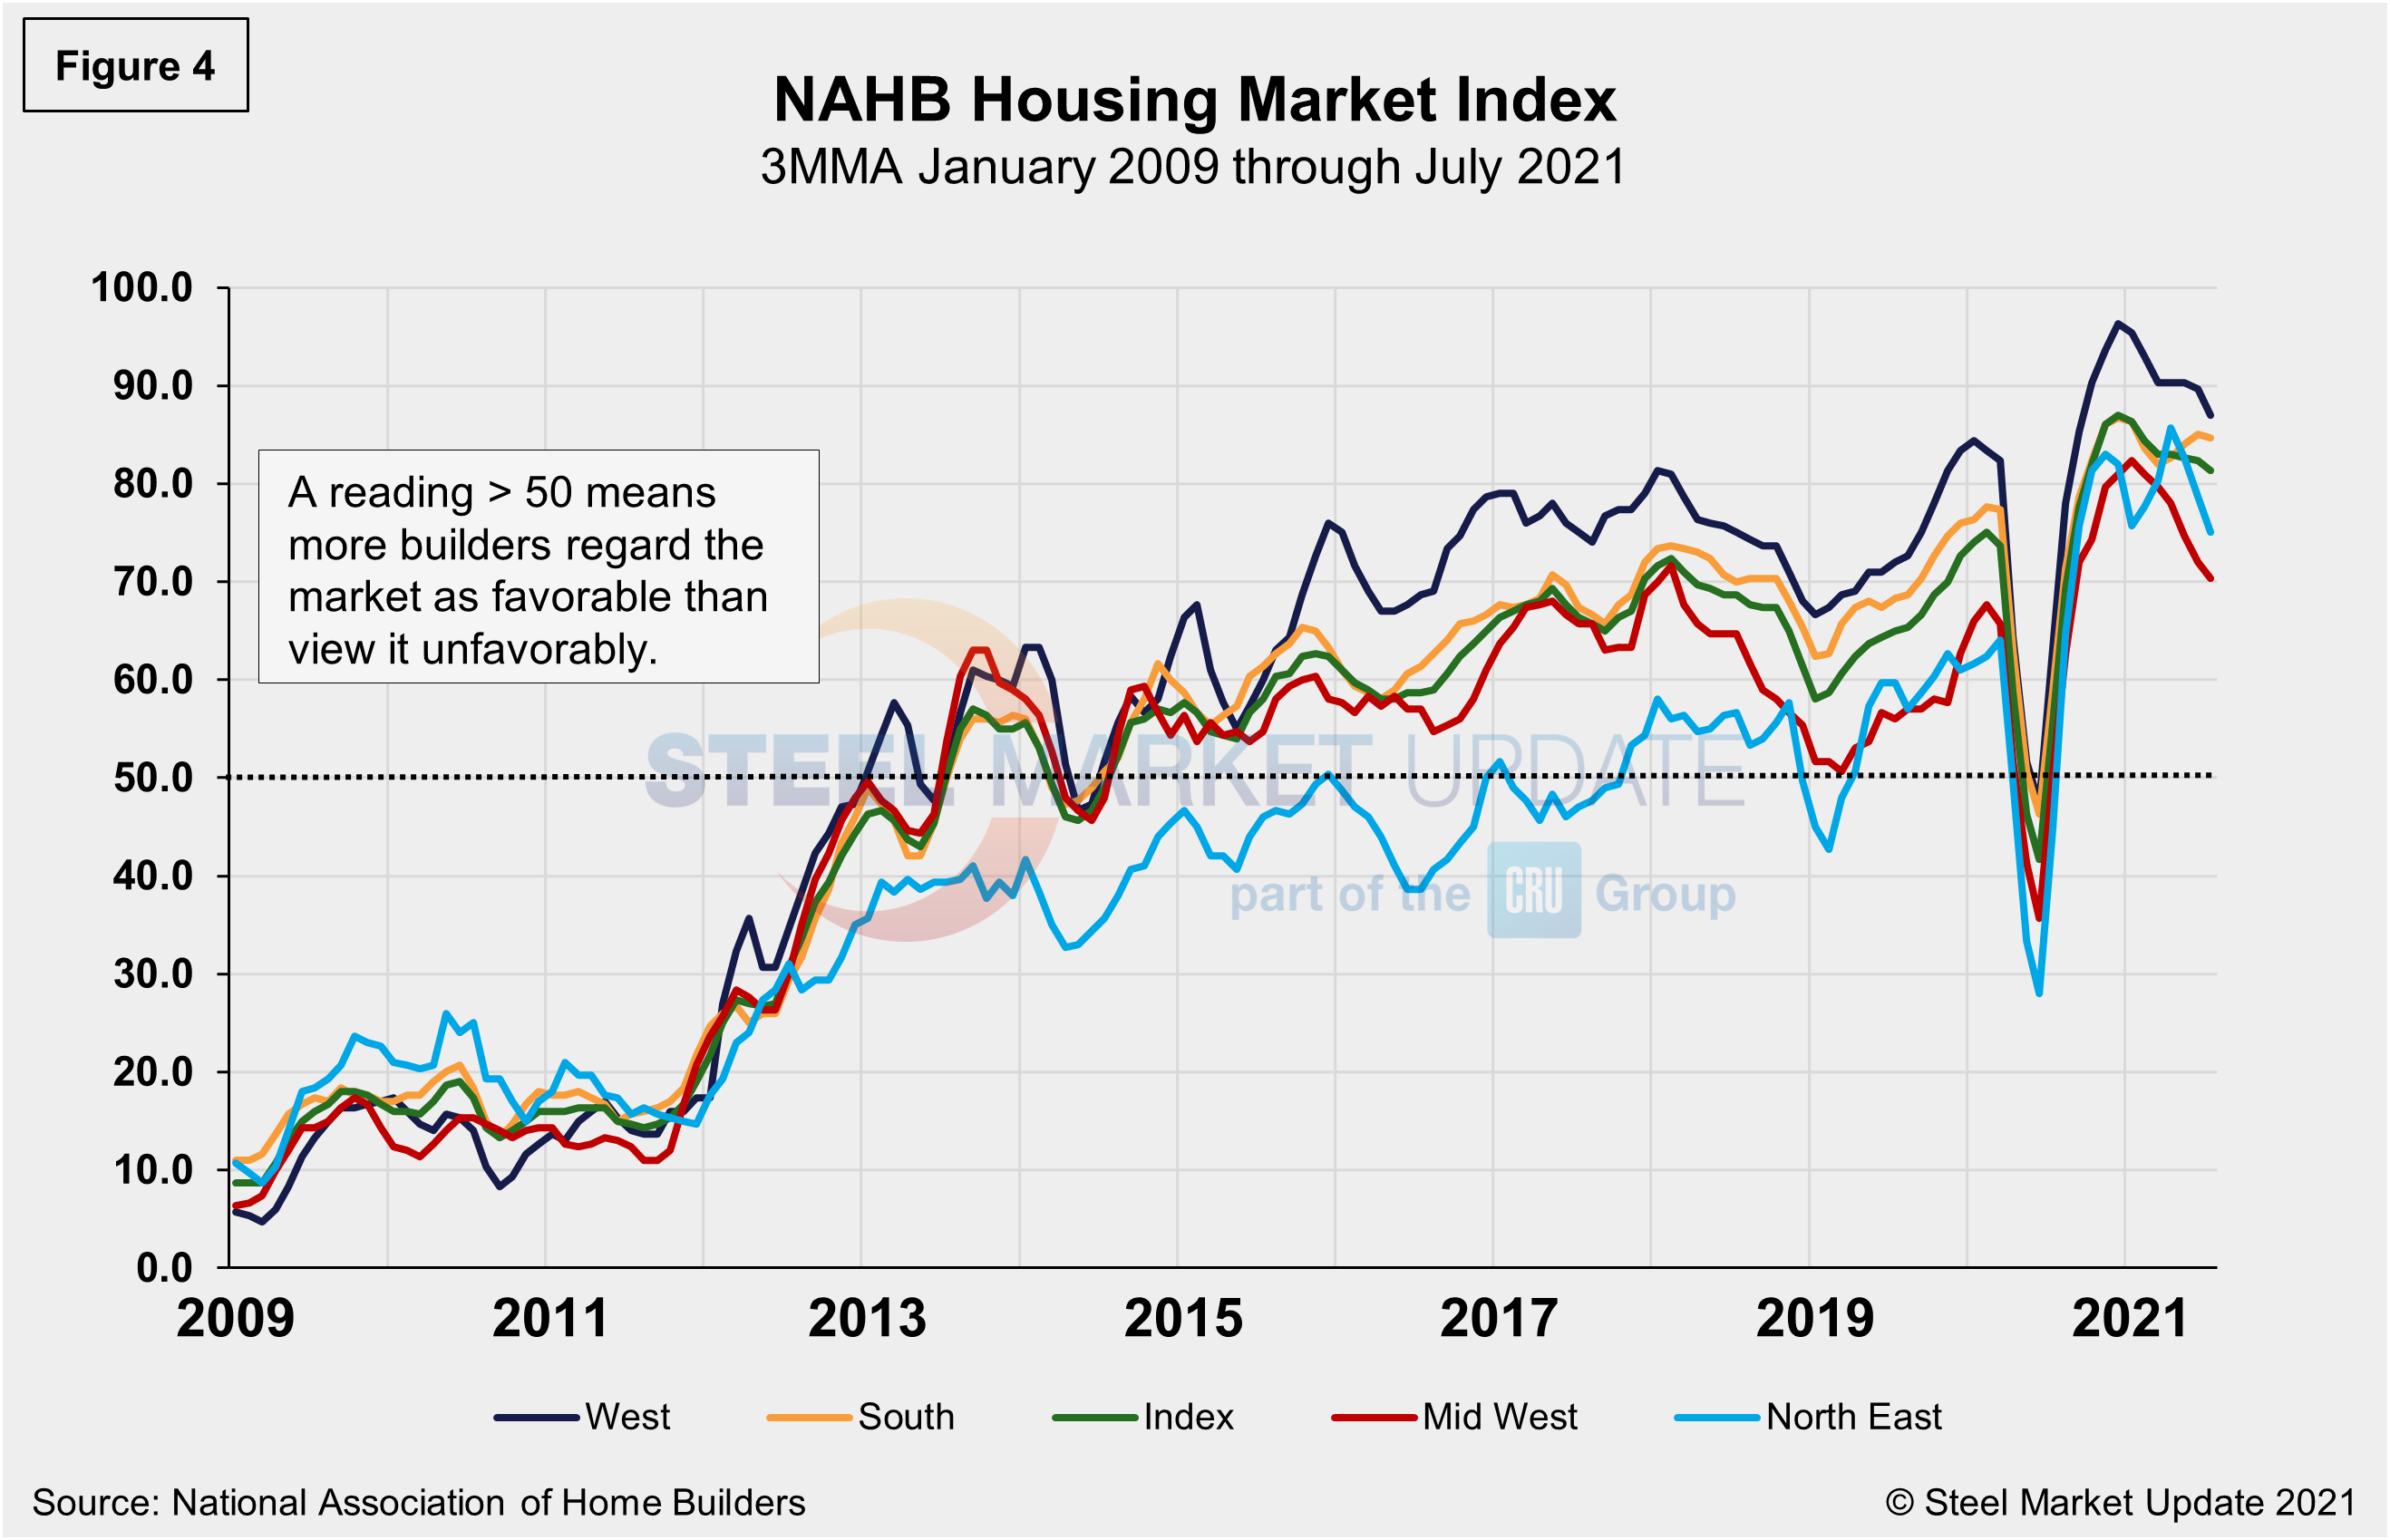
The National Association of Home Builders Optimism Index plummeted in April 2020 at the onset of COVID-19, but then recovered from May through December last year. Since the beginning of 2021, optimism among home builders has wavered up and down within a small range due to the high costs of lumber and other building materials and the shortage of skilled labor—but remains in positive territory. The index registered 80 in July, down from 81 the month prior. Advanced reports indicate that the index may slip further in August (Figure 4).
State and Local Construction
Public construction spending fell at an annual rate of 5.1% to $337.8 billion as highway construction slipped to $94.5 billion and education fell to $79.7 billion. Public residential spending dropped 4.0%, while public nonresidential spending dropped 5.0%. Spending on public construction projects rebounded 0.7% in July after dropping 1.6% in June. Outlays on state and local government construction projects rose, but federal government spending dropped 1.1%.
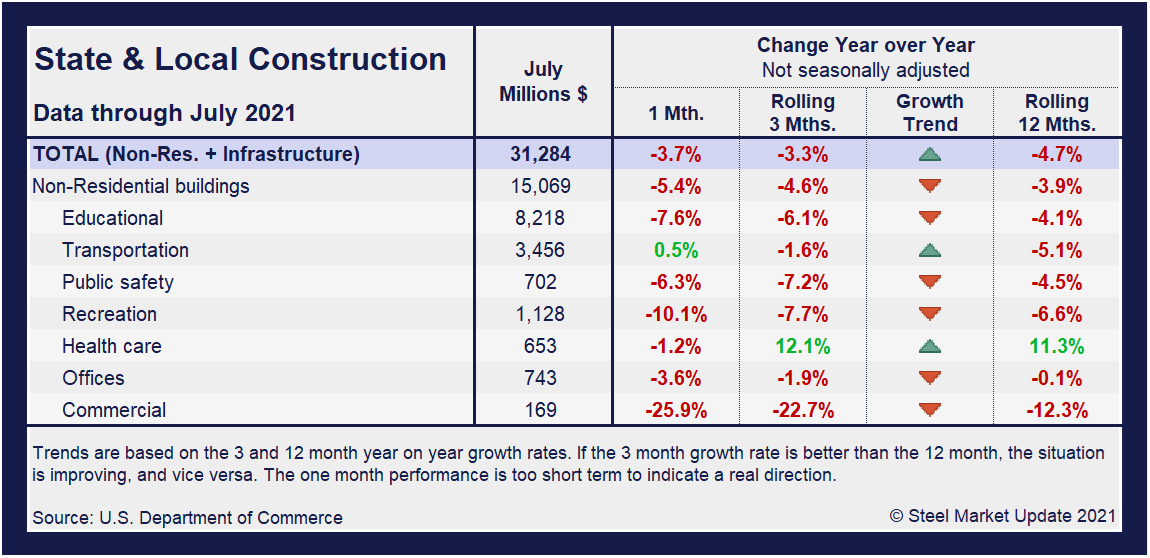
Construction expenditures on a state and local level remain the most impacted by the 16-month-long health crisis. Notably, on a year-on-year and rolling three-month basis, these construction categories and subcategories are still behind pre-pandemic levels, and in many cases trending down. The exception being healthcare and transportation. The table below details a struggling sector where nearly a quarter remain on the decline. Despite some improvement, only health care and transportation are above year-ago levels.
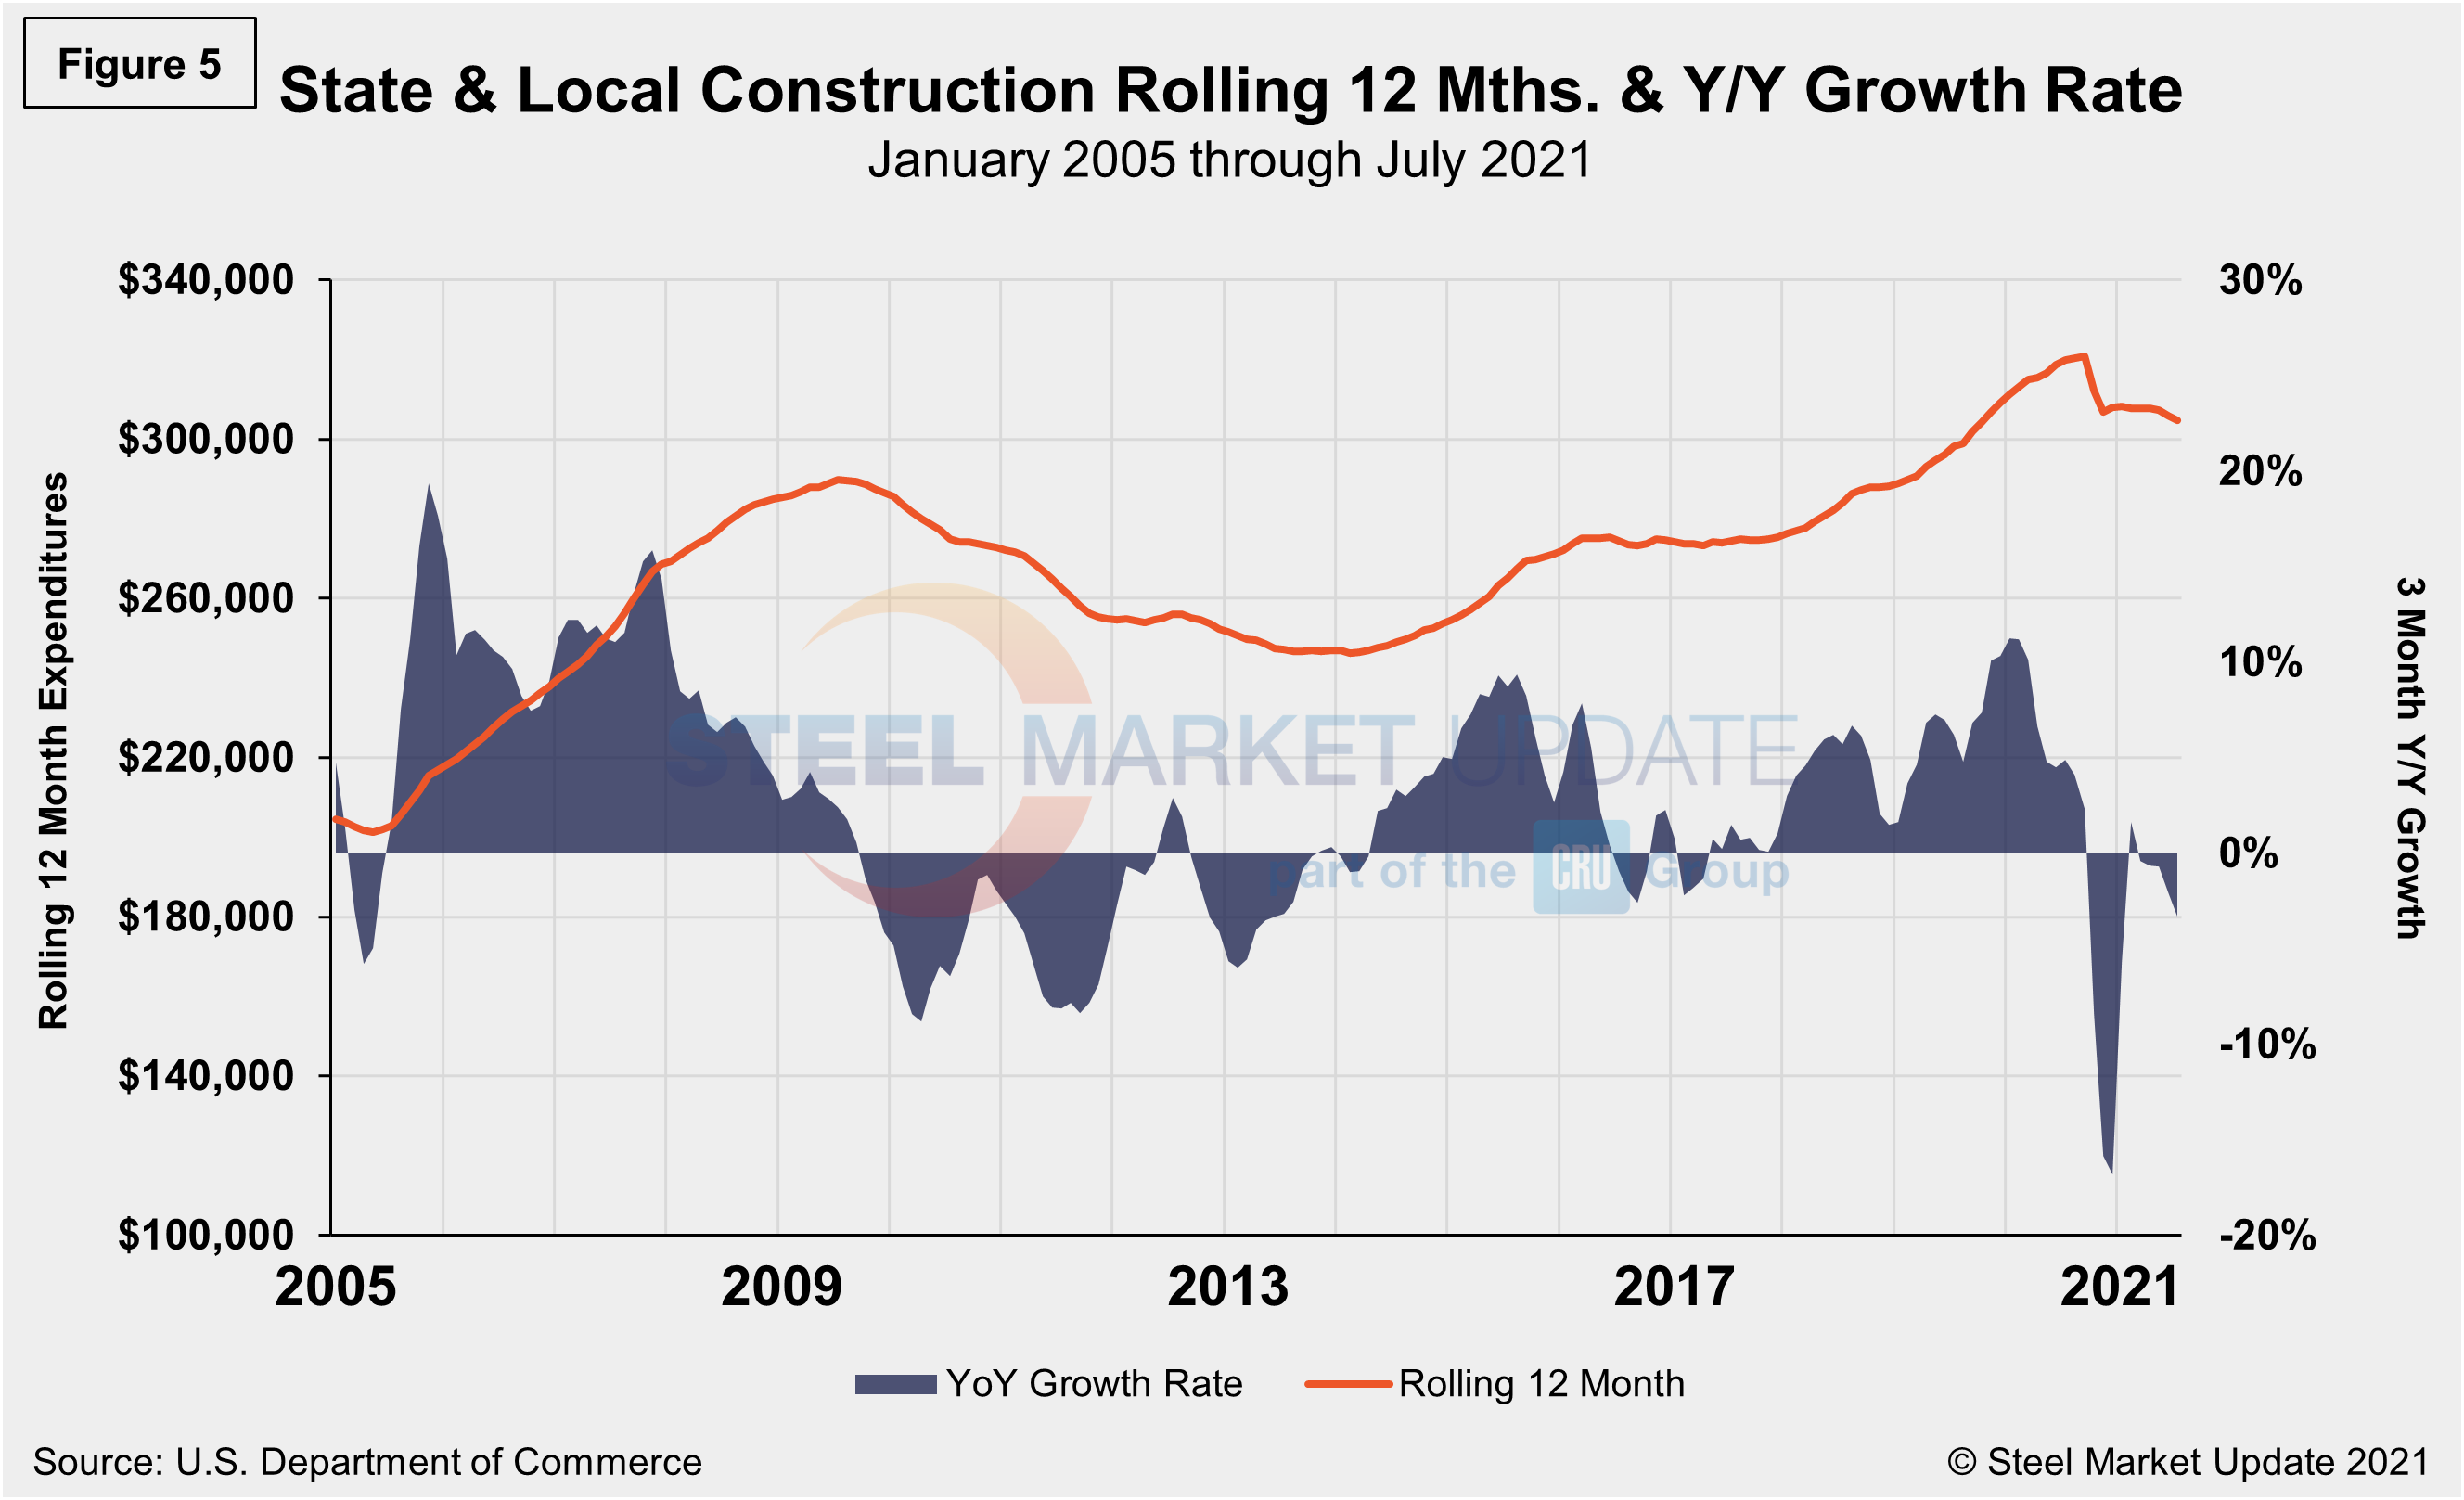
In three months through July, overall state and local construction was down 3.3%, a contraction from the month prior when the sector was down 2.0%, with three-quarters of the subcategories still trending down. Figure 5 shows the history of total S&L expenditures.
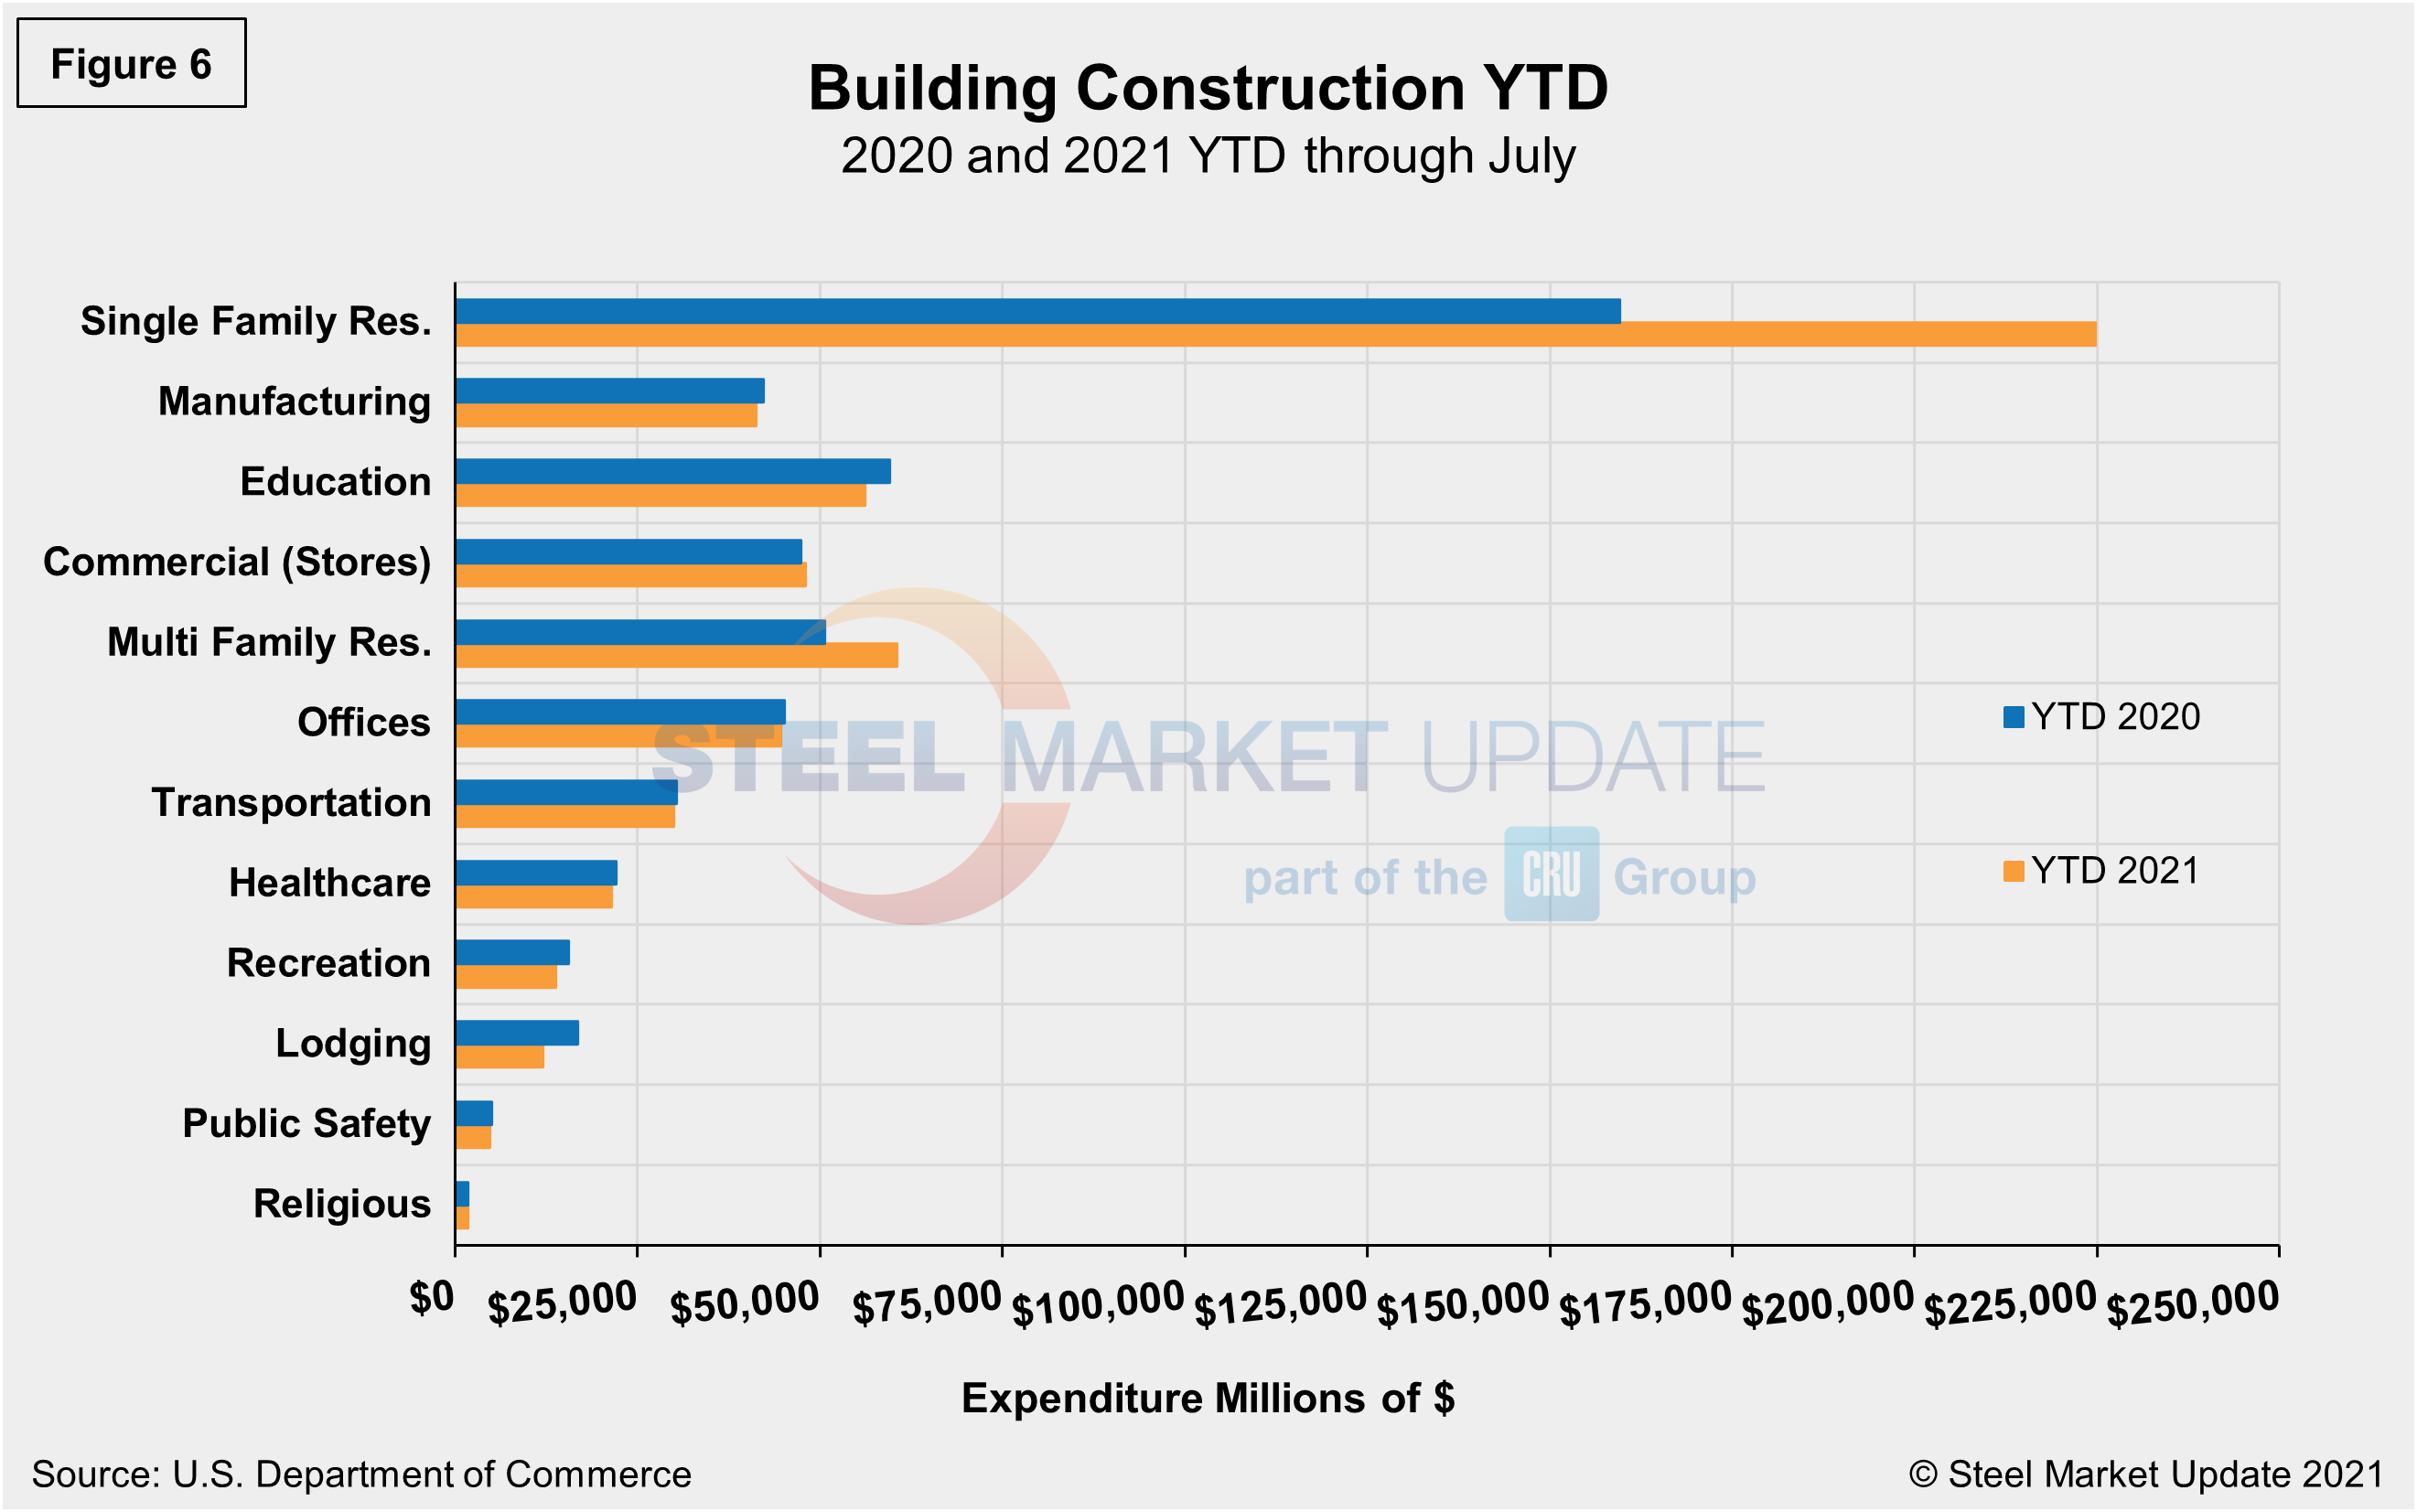
Year-to-date expenditures for construction of the various building sectors for 2020 and 2021 are compared in Figure 6. Single-family residential construction was dominant in 2020 with expenditures totaling an annualized $301.9 billion. To date, 2021 has been the same. Through July, expenditures for single-family construction were $223.8 billion or 40.8% above year-ago levels when expenditures were $159.6 billion. The only other sector seeing a positive delta year-on-year is multifamily residential with a growth of 19.7%. To underscore the continuing impact of the pandemic, all other sectors are still lagging on a year-to-date basis. Lodging and recreation are behind by double digits, 28.5% and 10.9%, respectively.
Explanation: Each month, the Commerce Department issues its Construction Put in Place (CPIP) data, usually on the first working day covering activity one month and one day earlier. There are three major categories based on funding source: private, state and local, and federal. Within these three groups are about 120 subcategories of construction projects. SMU analyzes the expenditures from the three funding categories to provide a concise summary of the steel-consuming sectors.
By David Schollaert, David@SteelMarketUpdate.com