

Market Data

September 7, 2021
Employment by Industry: August Report Card a Real Let Down
Written by David Schollaert
The U.S. labor market saw its worst monthly performance since January, according to the U.S. Bureau of Labor Statistics’ (BLS) August report. The latest data showed 235,000 new workers were added to payrolls in August, less than a quarter of the 1.053 million positions added in July.
August’s employment report was a huge disappointment, nearly two-thirds lower than initial economic estimates, and especially alarming given the nearly 3 million new jobs added from May through July. It wasn’t all bad news for the labor market, however, as the unemployment rate dropped to 5.2% from 5.4%, in line with estimates and the lowest since the pandemic began.
Leisure and hospitality jobs, which had been the primary driver of overall gains at 350,000 per month for the past six months, stalled in August as the unemployment rate in the industry ticked higher to 9.1%.
Instead, professional and business services led with 74,000 new positions. Other gainers included transportation and warehousing, at 53,000 added to payrolls; private education, with 40,000 added; and manufacturing and other services, which each posted gains of 37,000. Retail lost 29,000, with the bulk coming from food and beverage stores, which saw a decrease of 23,000.
The poor showing in August comes with heightened fears of the pandemic and the impact that rising COVID cases could have on what has been a mostly robust recovery. The weak report could cloud policy for the Federal Reserve, which is weighing whether to pull back on some of the massive stimulus it has been adding since the outbreak in early 2020.
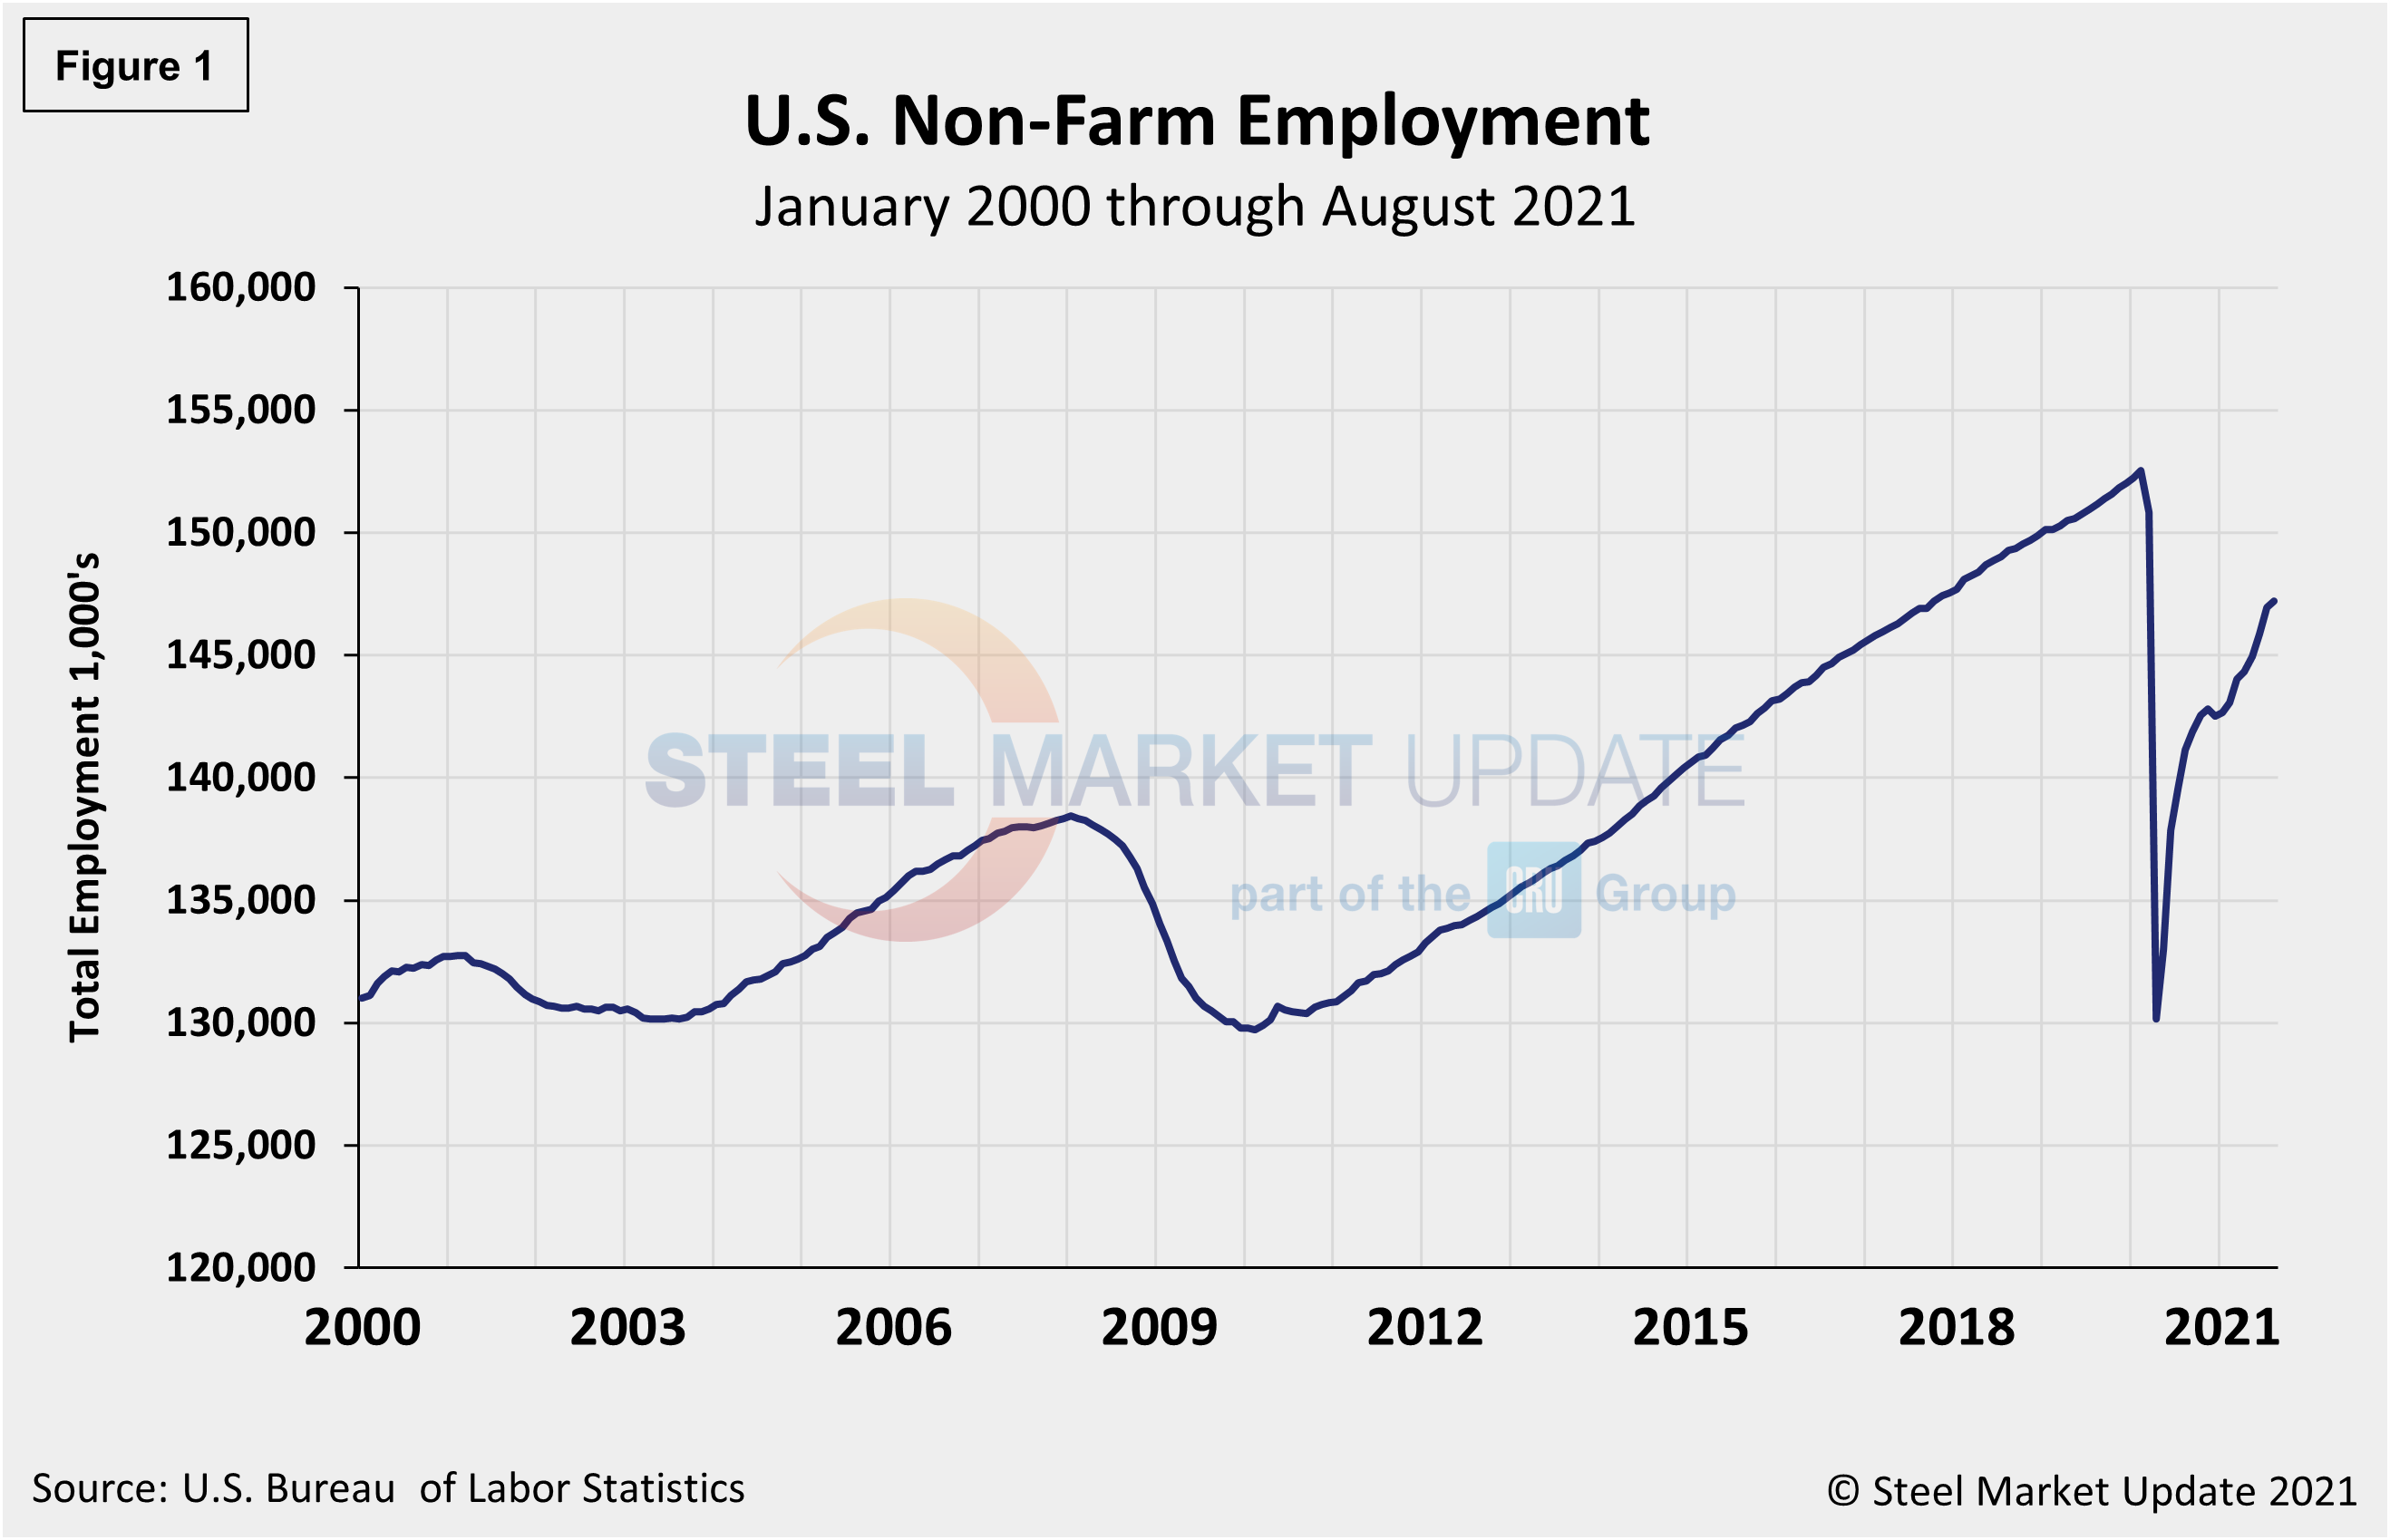
The number of unemployed persons fell by 665,000 to 8.6 million last month. To date, the U.S. has recovered nearly 13.5 million, or 62% of the 22.5 million jobs lost last spring, leaving the nation approximately 2.3 million jobs below its pre-pandemic level, when the unemployment rate was just 3.5%. Figure 1 shows the total number of people employed in the nonfarm economy.
Designed on rolling time periods of 1 month, 3 months, 1 year and 2 years, the table below breaks total employment into service industries and goods-producing industries, and then into private and government employees. Most of the goods-producing employees work in manufacturing and construction. Comparing service and goods-producing industries in August shows service jobs to have increased by 0.2%, while goods-producing jobs rose by 0.3% from July’s result. Despite the slight month-on-month gains, both industries are behind pre-pandemic levels by nearly 3.0%. Note, the subcomponents of both manufacturing and construction shown in this table don’t add up to the total because we have only included those with the most relevance to the steel industry.
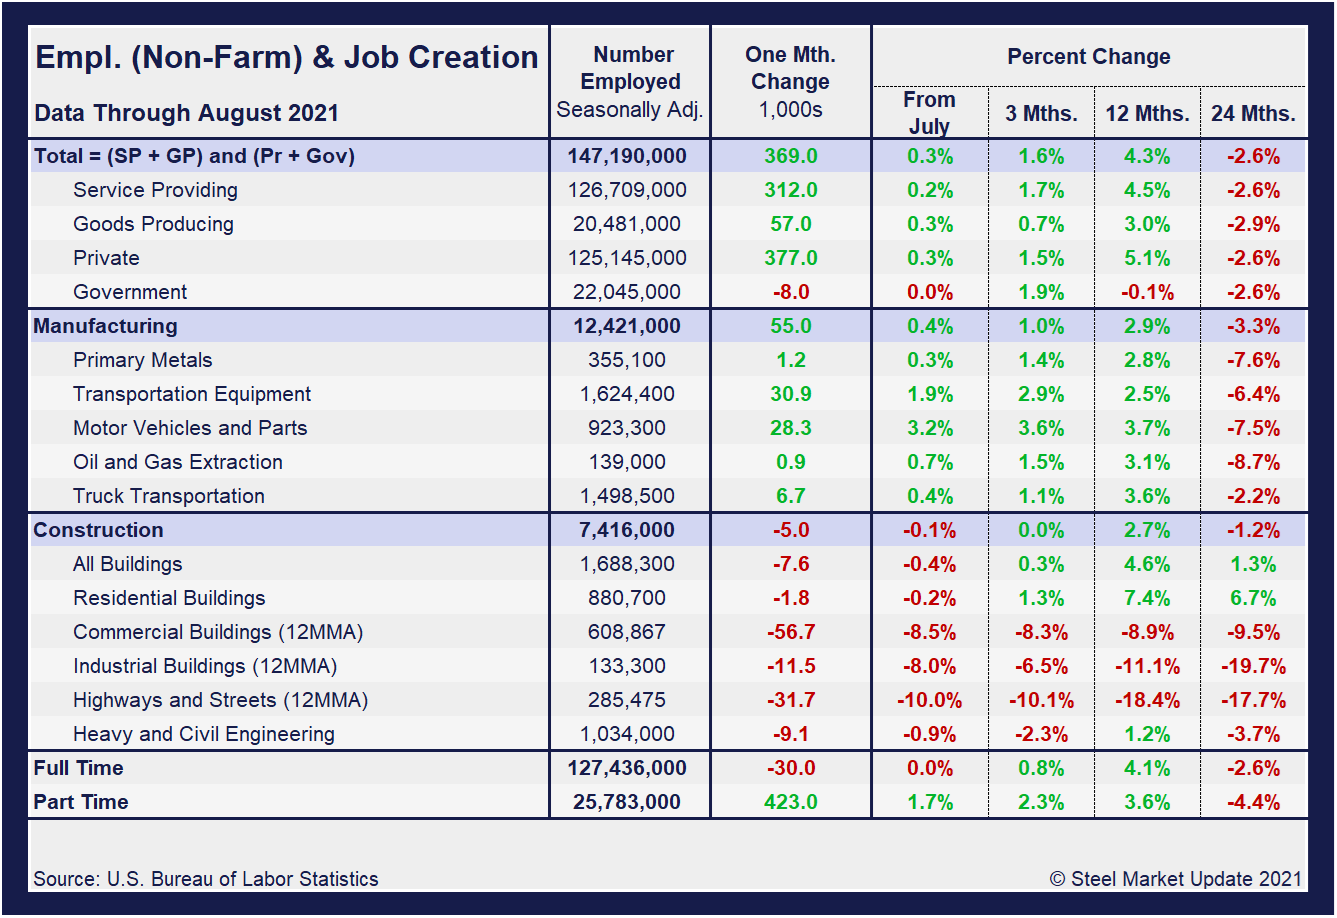
Comparing August to July, manufacturing employment was up 0.4% versus a gain 0.2% the month prior. Construction was down 0.1% month on month compared to a gain of 0.1% in July. Despite the strong gains from May through July, August’s total, albeit positive, underscores the inconsistencies and struggles across some subcomponents since the beginning of the year. The construction sector, especially, emphasizes the significant obstacles facing the U.S. economy and domestic job creation. And three-month, 12-month and 24-month comparisons remain problematic due to the extensive losses resulting from pandemic. In the year-over-year contrast, manufacturing is up just 2.9% and construction is up 2.7%. Further growth is still expected as the marketplace advances from the freefall seen during the second quarter of 2020.
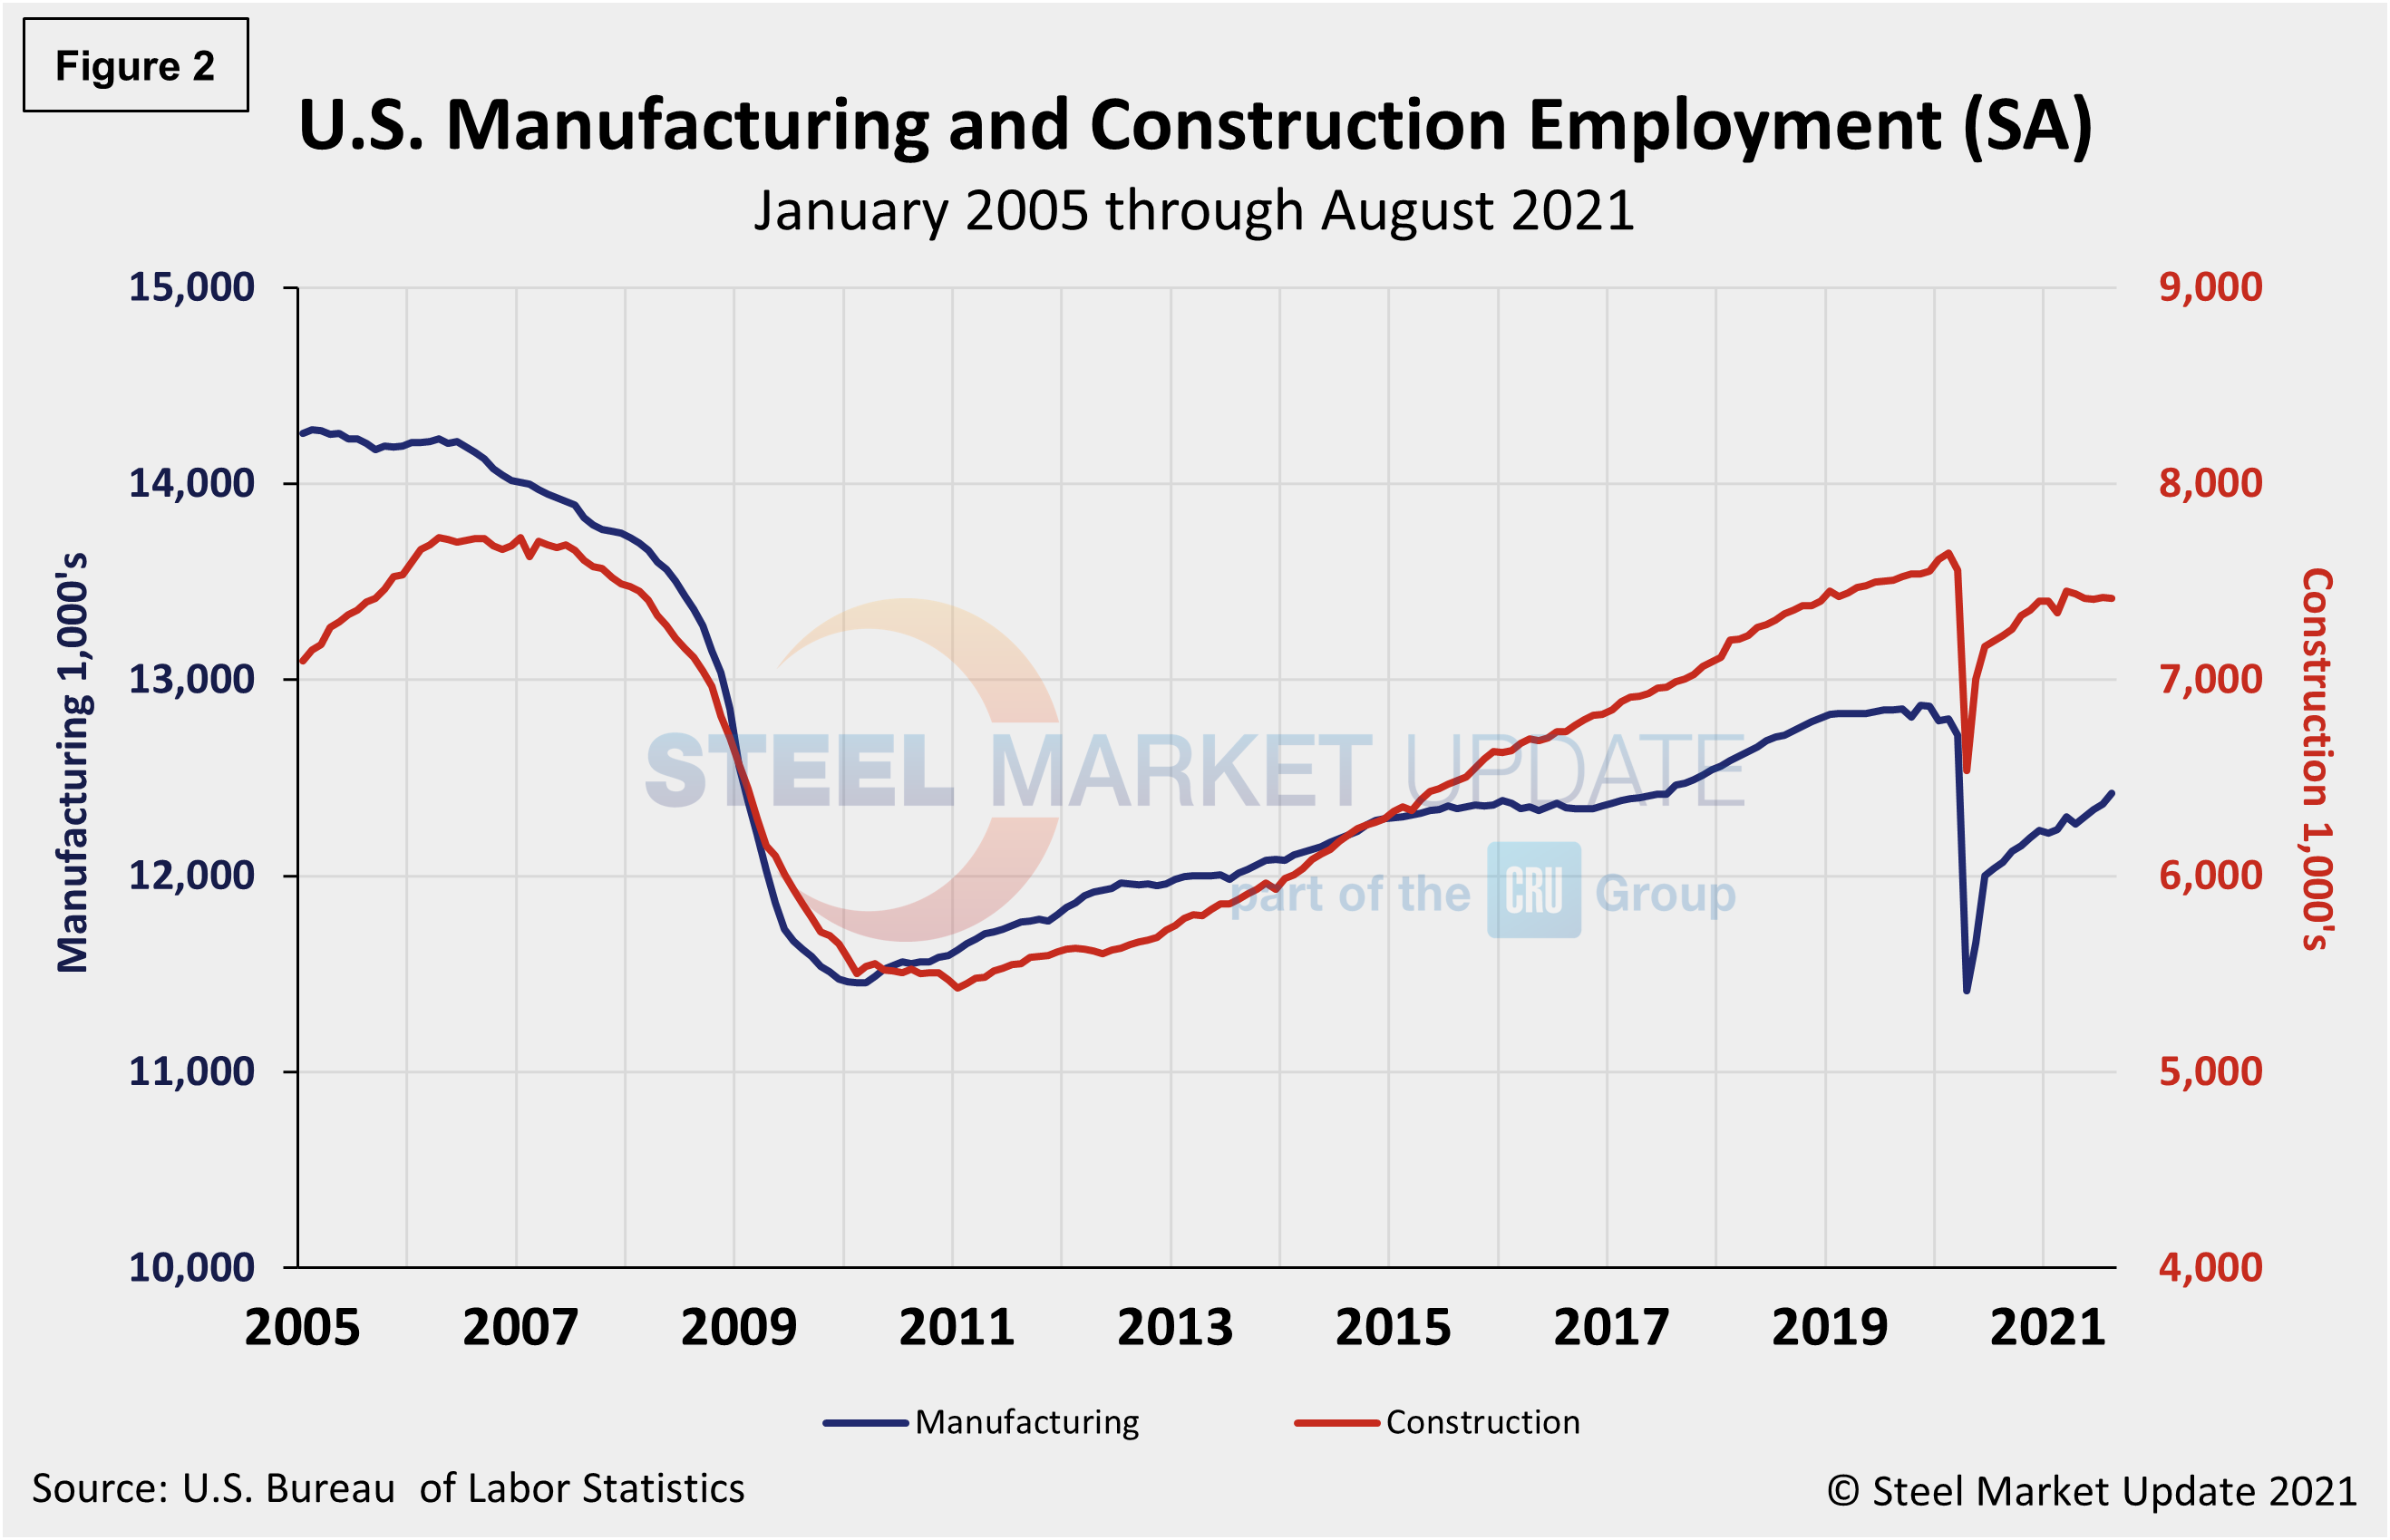
Manufacturing employment increased by 37,000 jobs in August compared to an increase of 27,000 the month prior, led by an increase in durable goods, specifically 24,000 in motor vehicles and parts and 7,000 in fabricated metal products. Employment in manufacturing is down by 378,000 from its pre-pandemic level in February 2020. Construction employment was largely unchanged month on month in August. Employment in the construction industry overall is still 232,000 below its February 2020 level, according to the BLS data. Figure 2 shows the history of employment in manufacturing and construction since January 2005, seasonally adjusted.
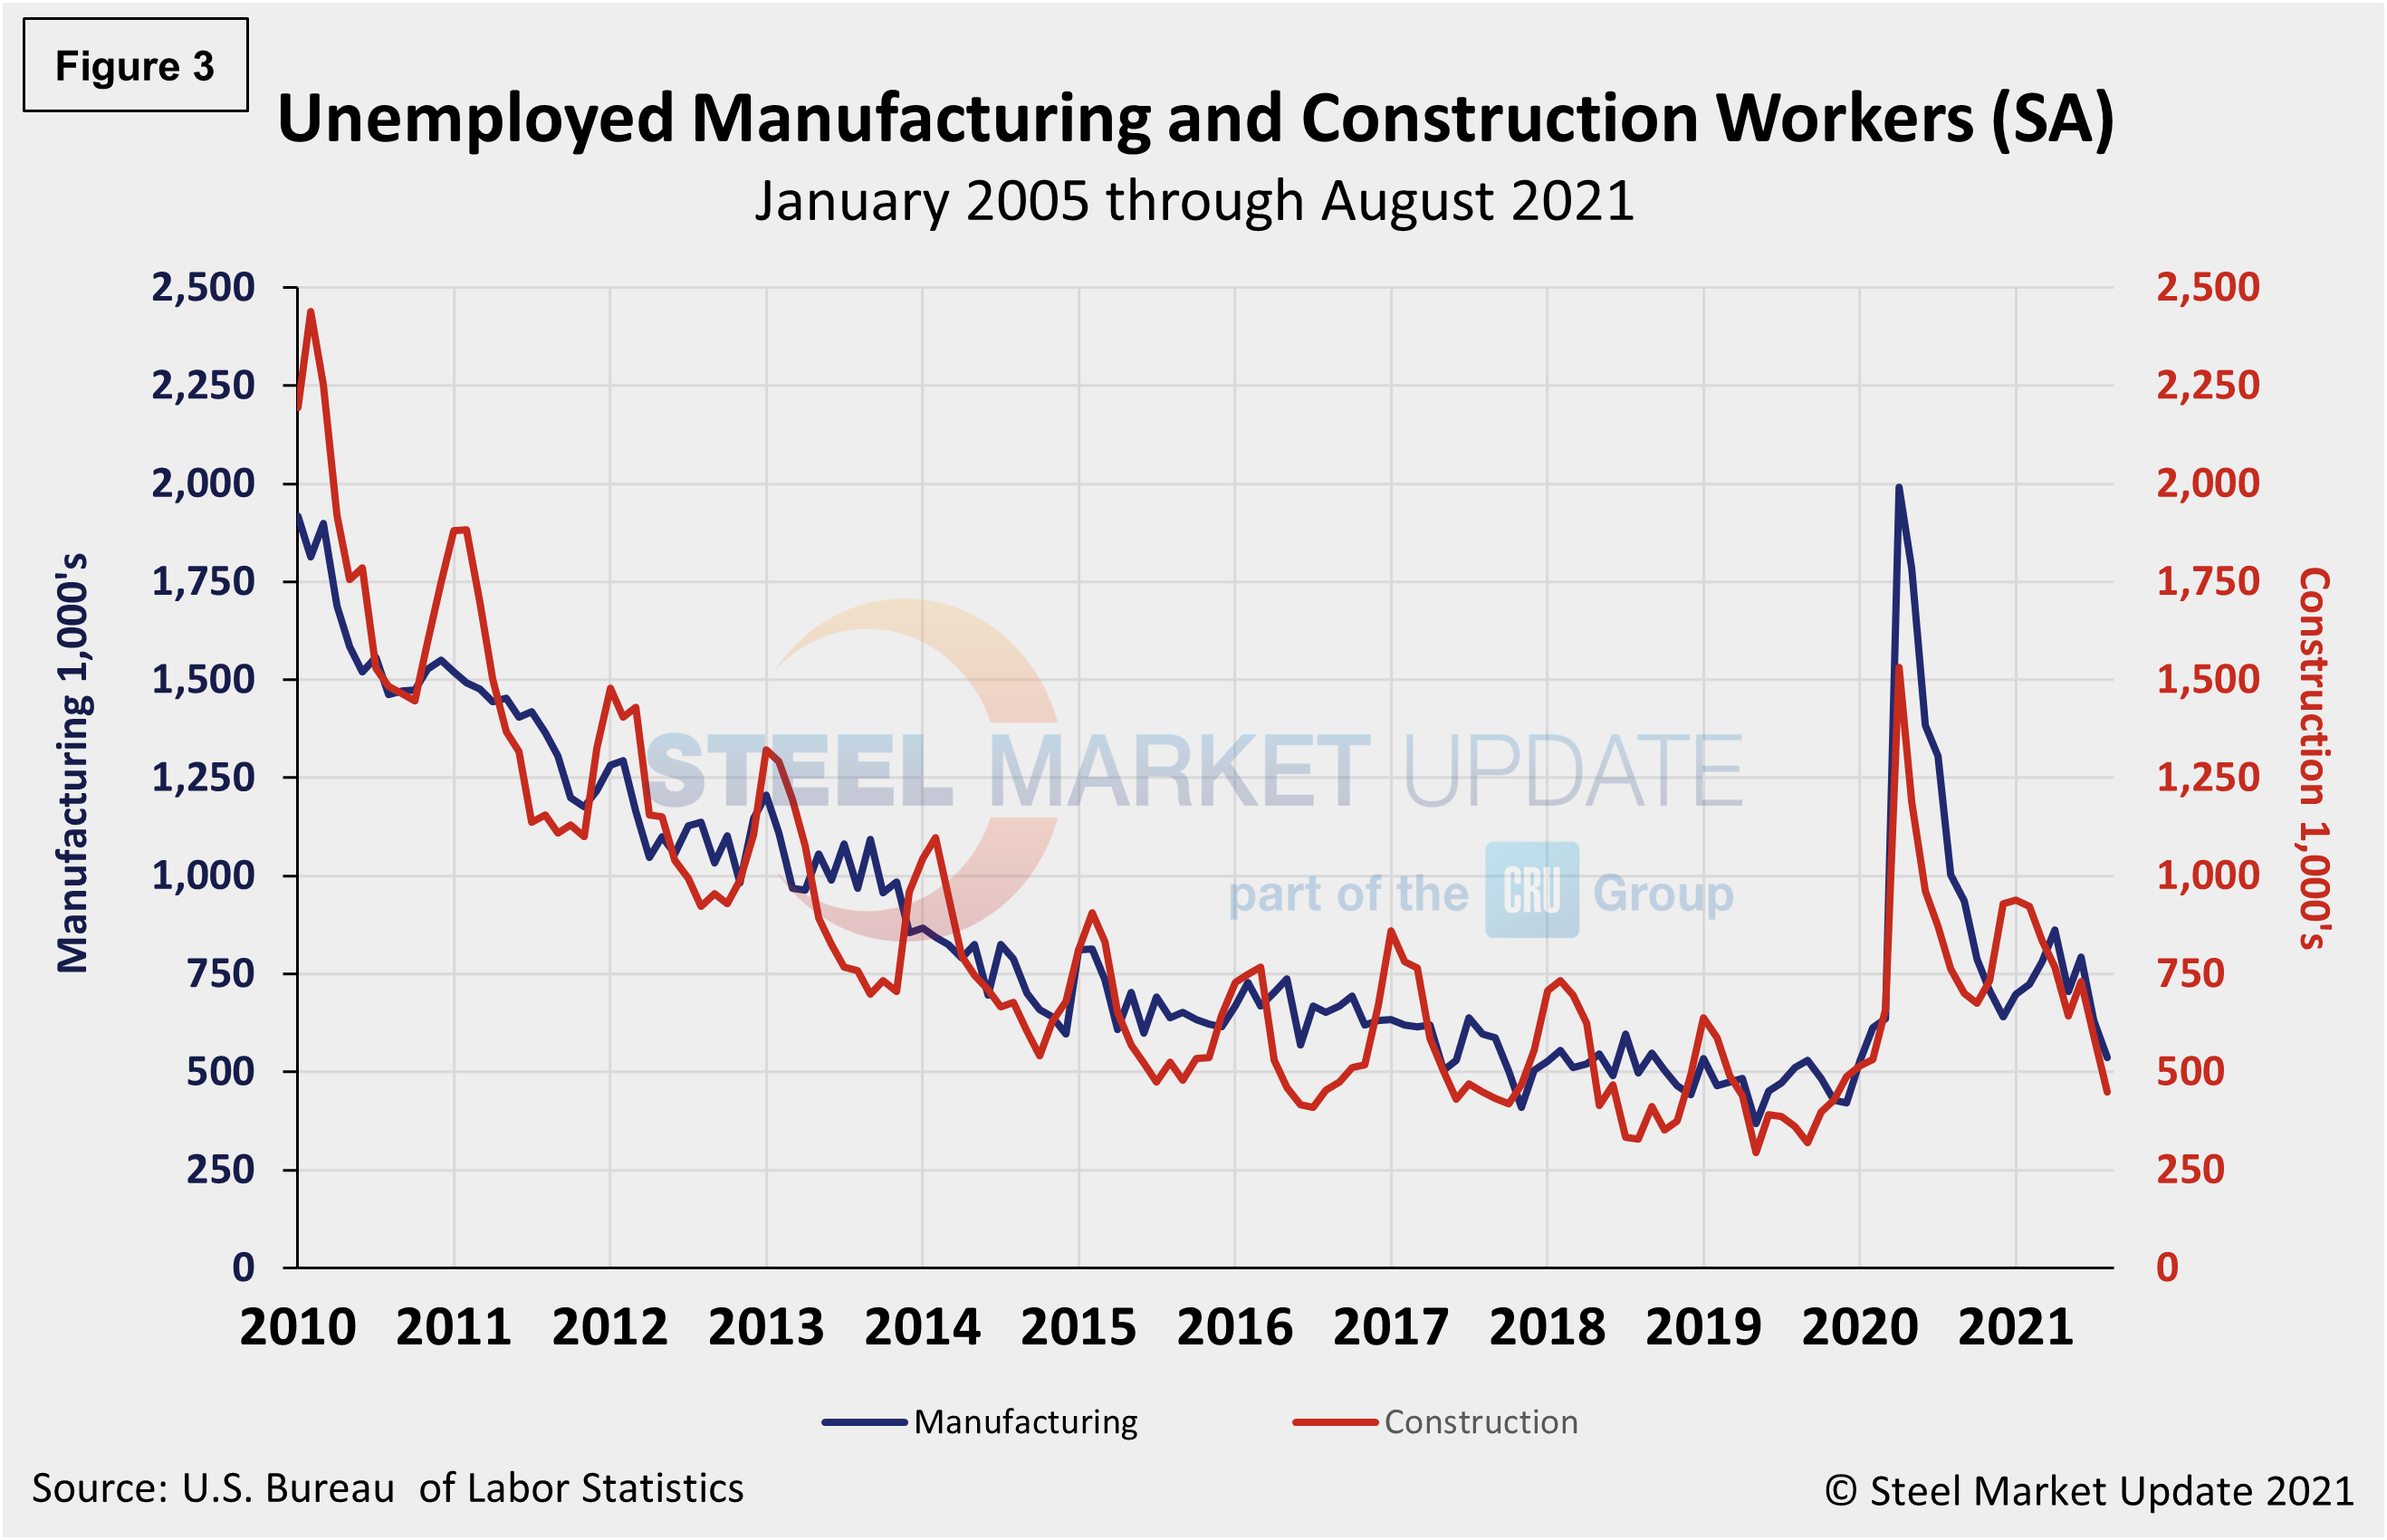
The reported number of unemployed manufacturing and construction workers is shown in Figure 3. Both manufacturing and construction unemployment decreased in August. Manufacturing’s unemployed persons fell from 631,000 in July to 536,000 in August, a 15.1% decrease month on month. Construction unemployment was down by 24.3% month on month, from 592,000 in July to 448,000 in August.
Explanation: On the first or second Friday of each month, the Bureau of Labor Statistics releases the employment data for the previous month. Data is available at www.bls.gov. The BLS employment database is a reality check for other economic data streams such as manufacturing and construction. It is easy to drill down into the BLS database to obtain employment data for many subsectors of the economy. The important point about all these data streams is not necessarily the nominal numbers, but the direction in which they are headed.
By David Schollaert, David@SteelMarketUpdate.com


