

Market Data

September 7, 2021
U.S. Job Creation: August Disappoints as Pace Falls Off
Written by David Schollaert
Steel Market Update is pleased to share this Premium content with Executive members. For information on upgrading to a Premium-level subscription, email Info@SteelMarketUpdate.com.
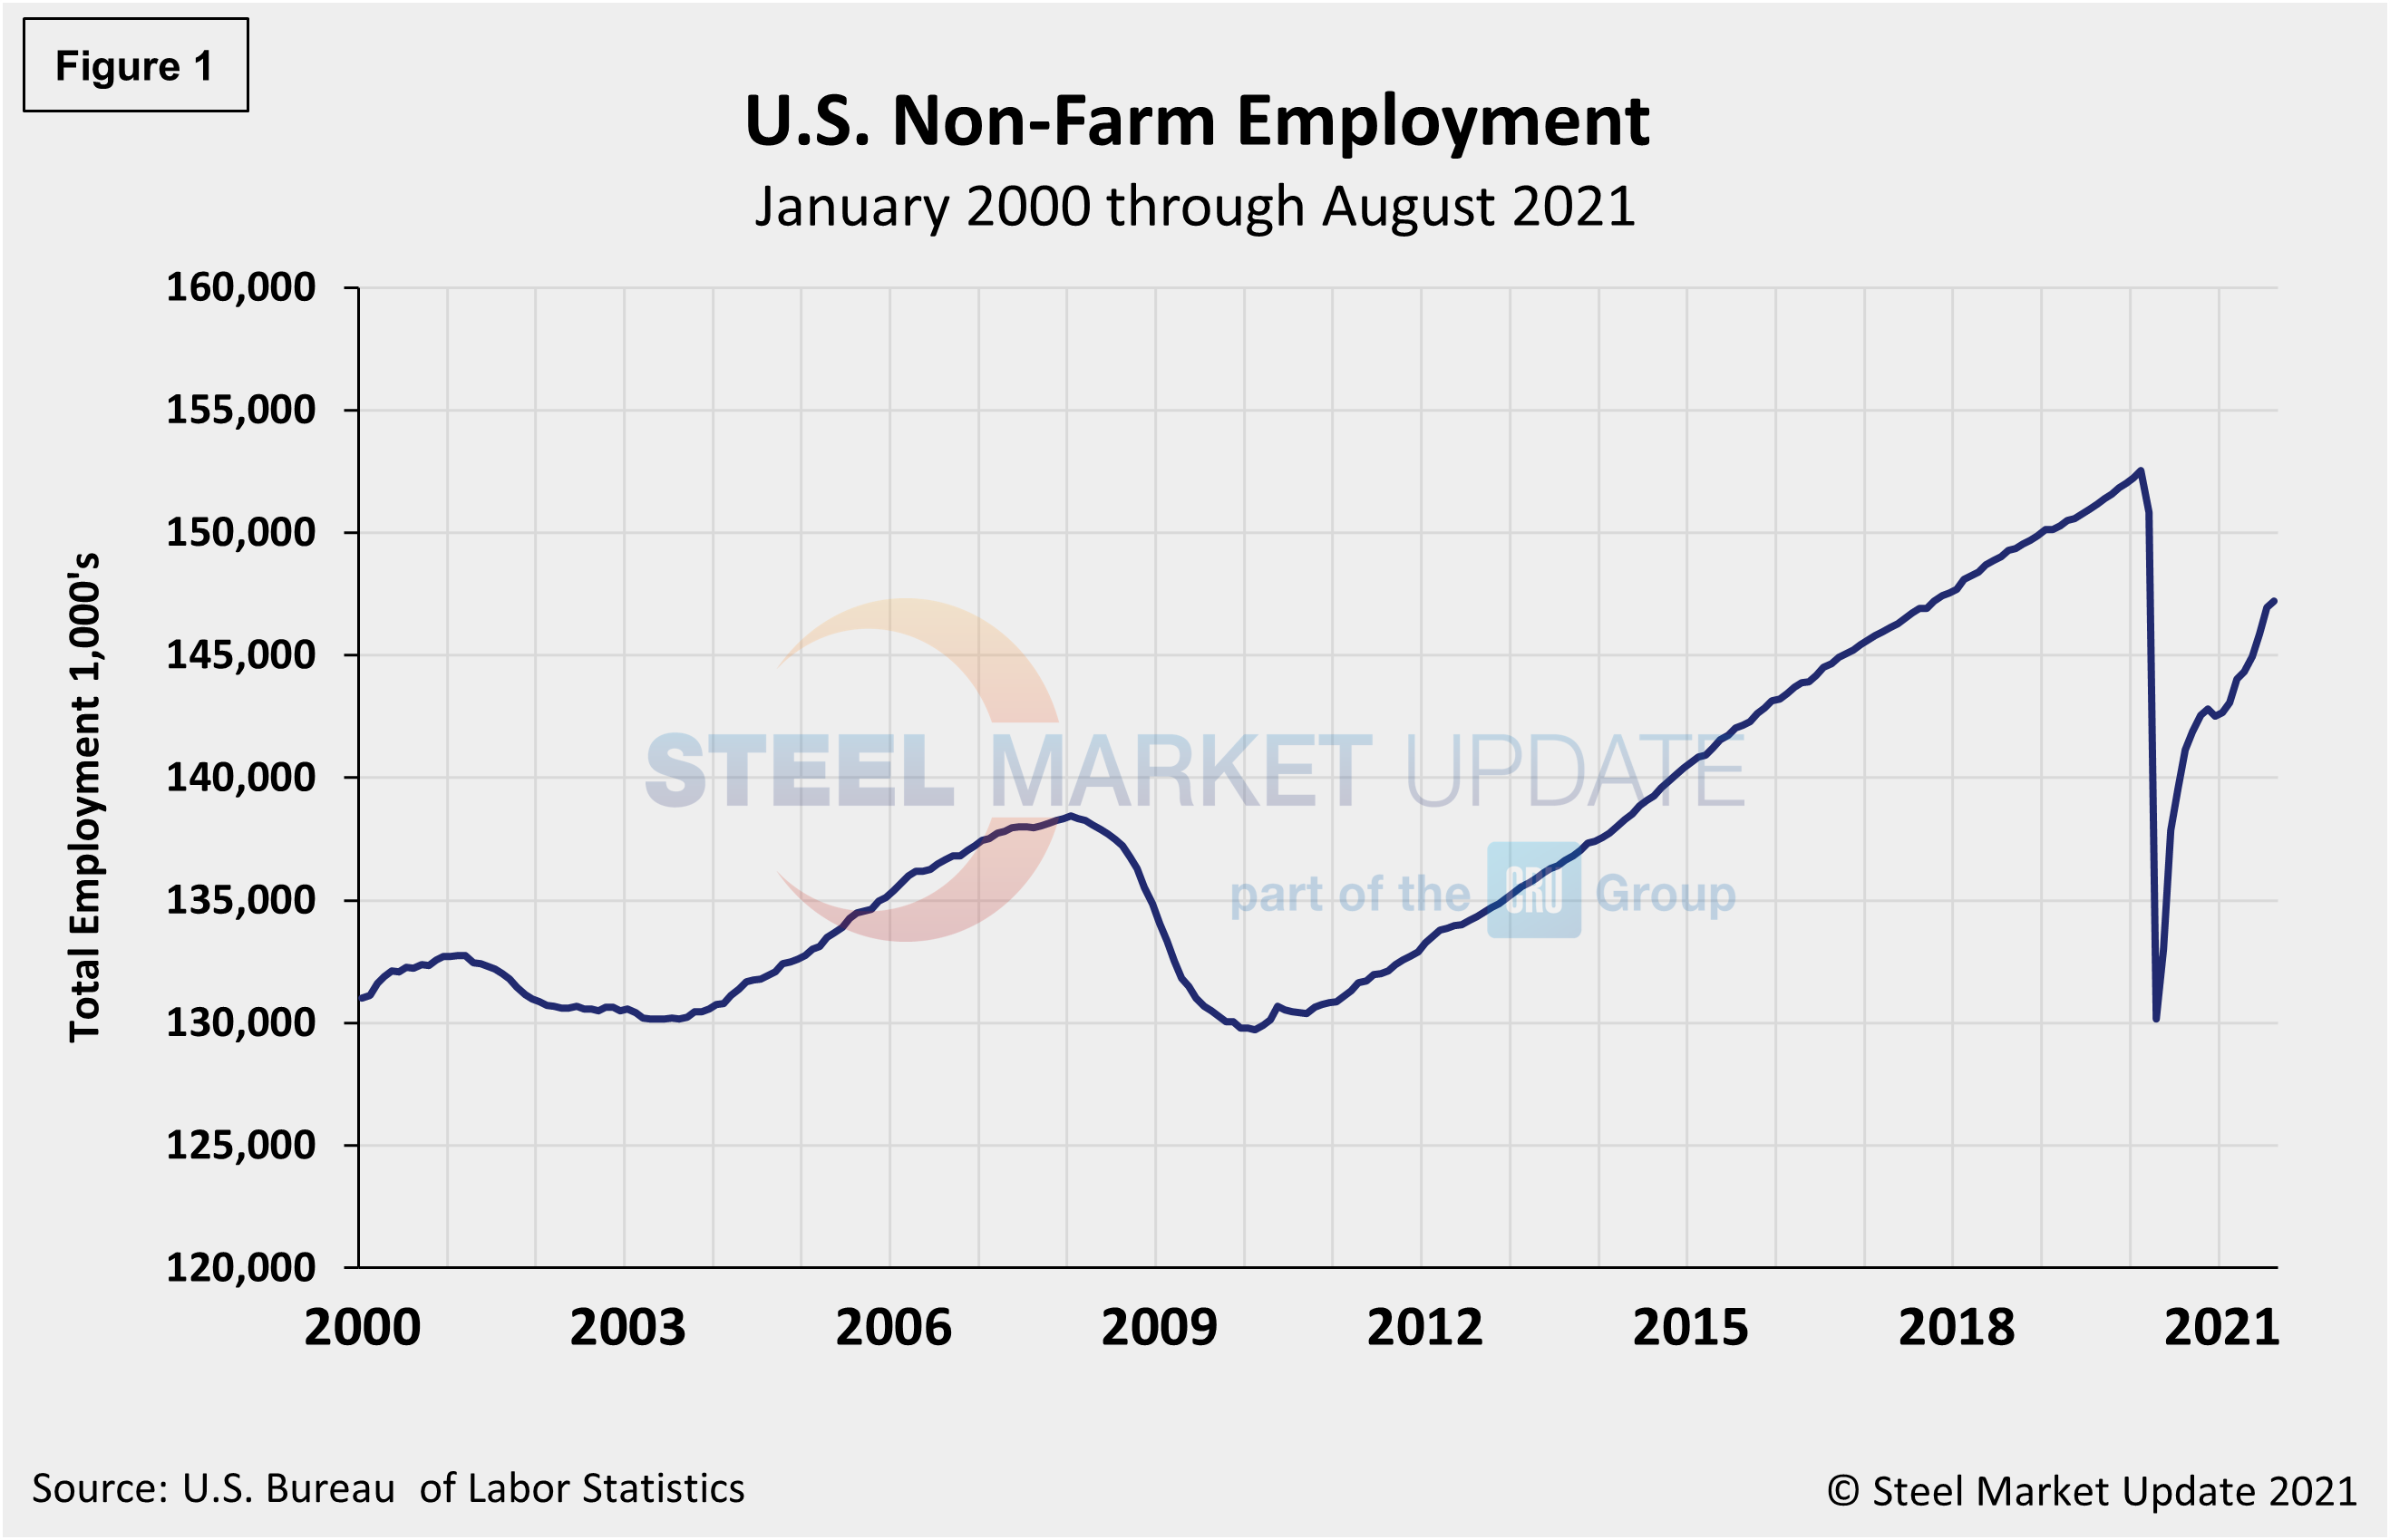
U.S. job creation in August disappointed, unable to maintain pace with July’s results. The U.S. economy decelerated in August, as hiring rose at its slowest pace since January. Nonfarm payrolls increased by 235,000, a drastic fall from the upward revised 1.053 million positions added the month prior. The unemployment rate dropped 0.2 percentage points to 5.2%, according to the Bureau of Labor Statistics (BLS).
The labor market recovery hit the brakes in August following sizable jumps in employment from May through July when more than 2.5 million jobs were added. August’s totals were a huge disappointment, adding less than a third of what economists had anticipated, among heightened fears of the rising COVID cases and their possible effects on the mostly robust economic rebound.
Leisure and hospitality jobs, which had been the primary driver of overall gains at 350,000 per month for the past six months, stalled in August as the unemployment rate in the industry ticked higher to 9.1%. Instead, job gains were notable in professional and business services, with 74,000 new positions. Other gainers included transportation and warehousing with 53,000, private education with 40,000 positions and manufacturing and other services, which each posted gains of 37,000. Retail lost 29,000 in their payroll, with the bulk coming from food and beverage stores, which saw a decrease of 23,000. Figure 1 shows the total number of nonfarm workers employed in the U.S. since 2000.
Rising COVID cases driven by the Delta variant have certainly impacted the job market, as August saw an increase of about 400,000 in those who said they couldn’t work for pandemic-related reasons, pushing the total up to 5.6 million.
Still, the news wasn’t all bad for jobs. The number of long-term unemployed (out-of-work for at least 27 consecutive weeks) decreased by 246,000 in August, comprising about 37.4% of the total unemployed, down 1.9 percentage points from the prior month. The labor force participation rate was unchanged at 61.7%, still well below the 63.3% in February 2020, the month before the pandemic hit.
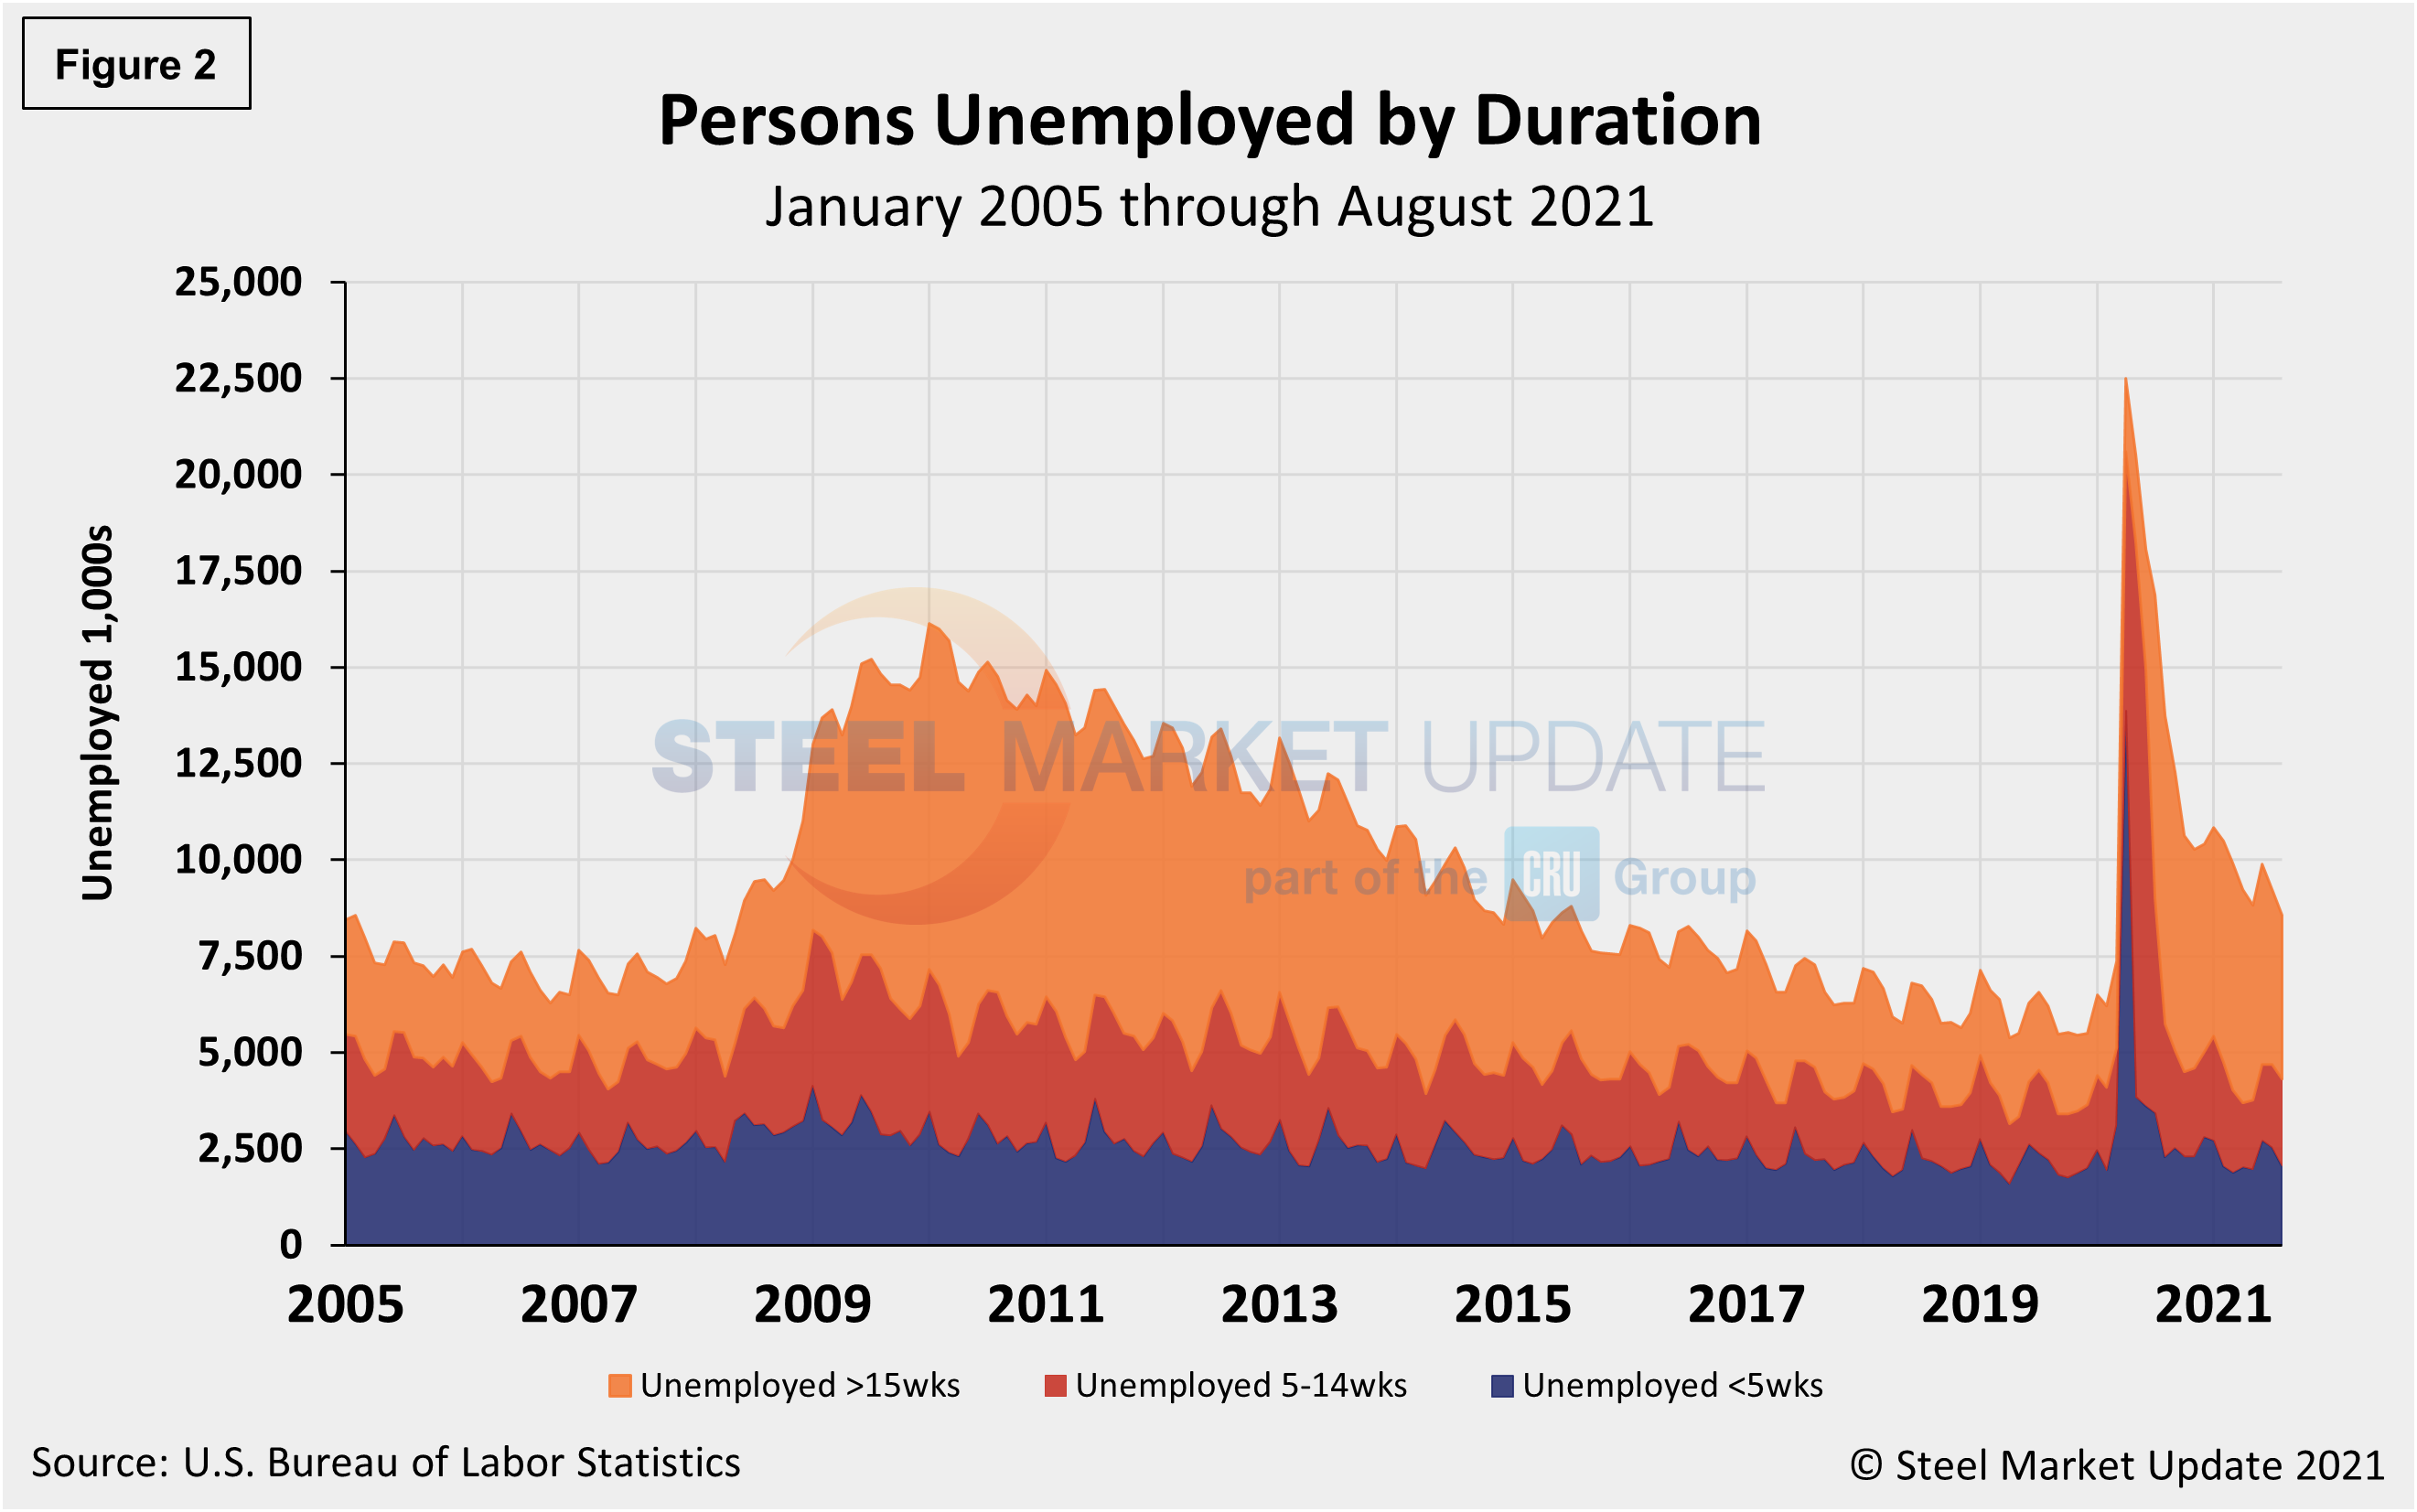
The historical picture for the duration of unemployment since January 2000 is broken down into <5 weeks, 5 to 14 weeks, and >15 weeks, noted below in Figure 2. The total number unemployed was 8,556,000 at the end of August, a decrease of 665,000 compared to July. Although unemployment remains above pre-pandemic levels by roughly 1.2 million people, about 13.9 million more people now have jobs compared to the 22.5 million thrown out of work during the worst of the pandemic in April 2020. As of Sept. 6, 49.5% had been unemployed for more than 15 weeks, 26.5% for 5 to 14 weeks, and 24.0% for less than 5 weeks.
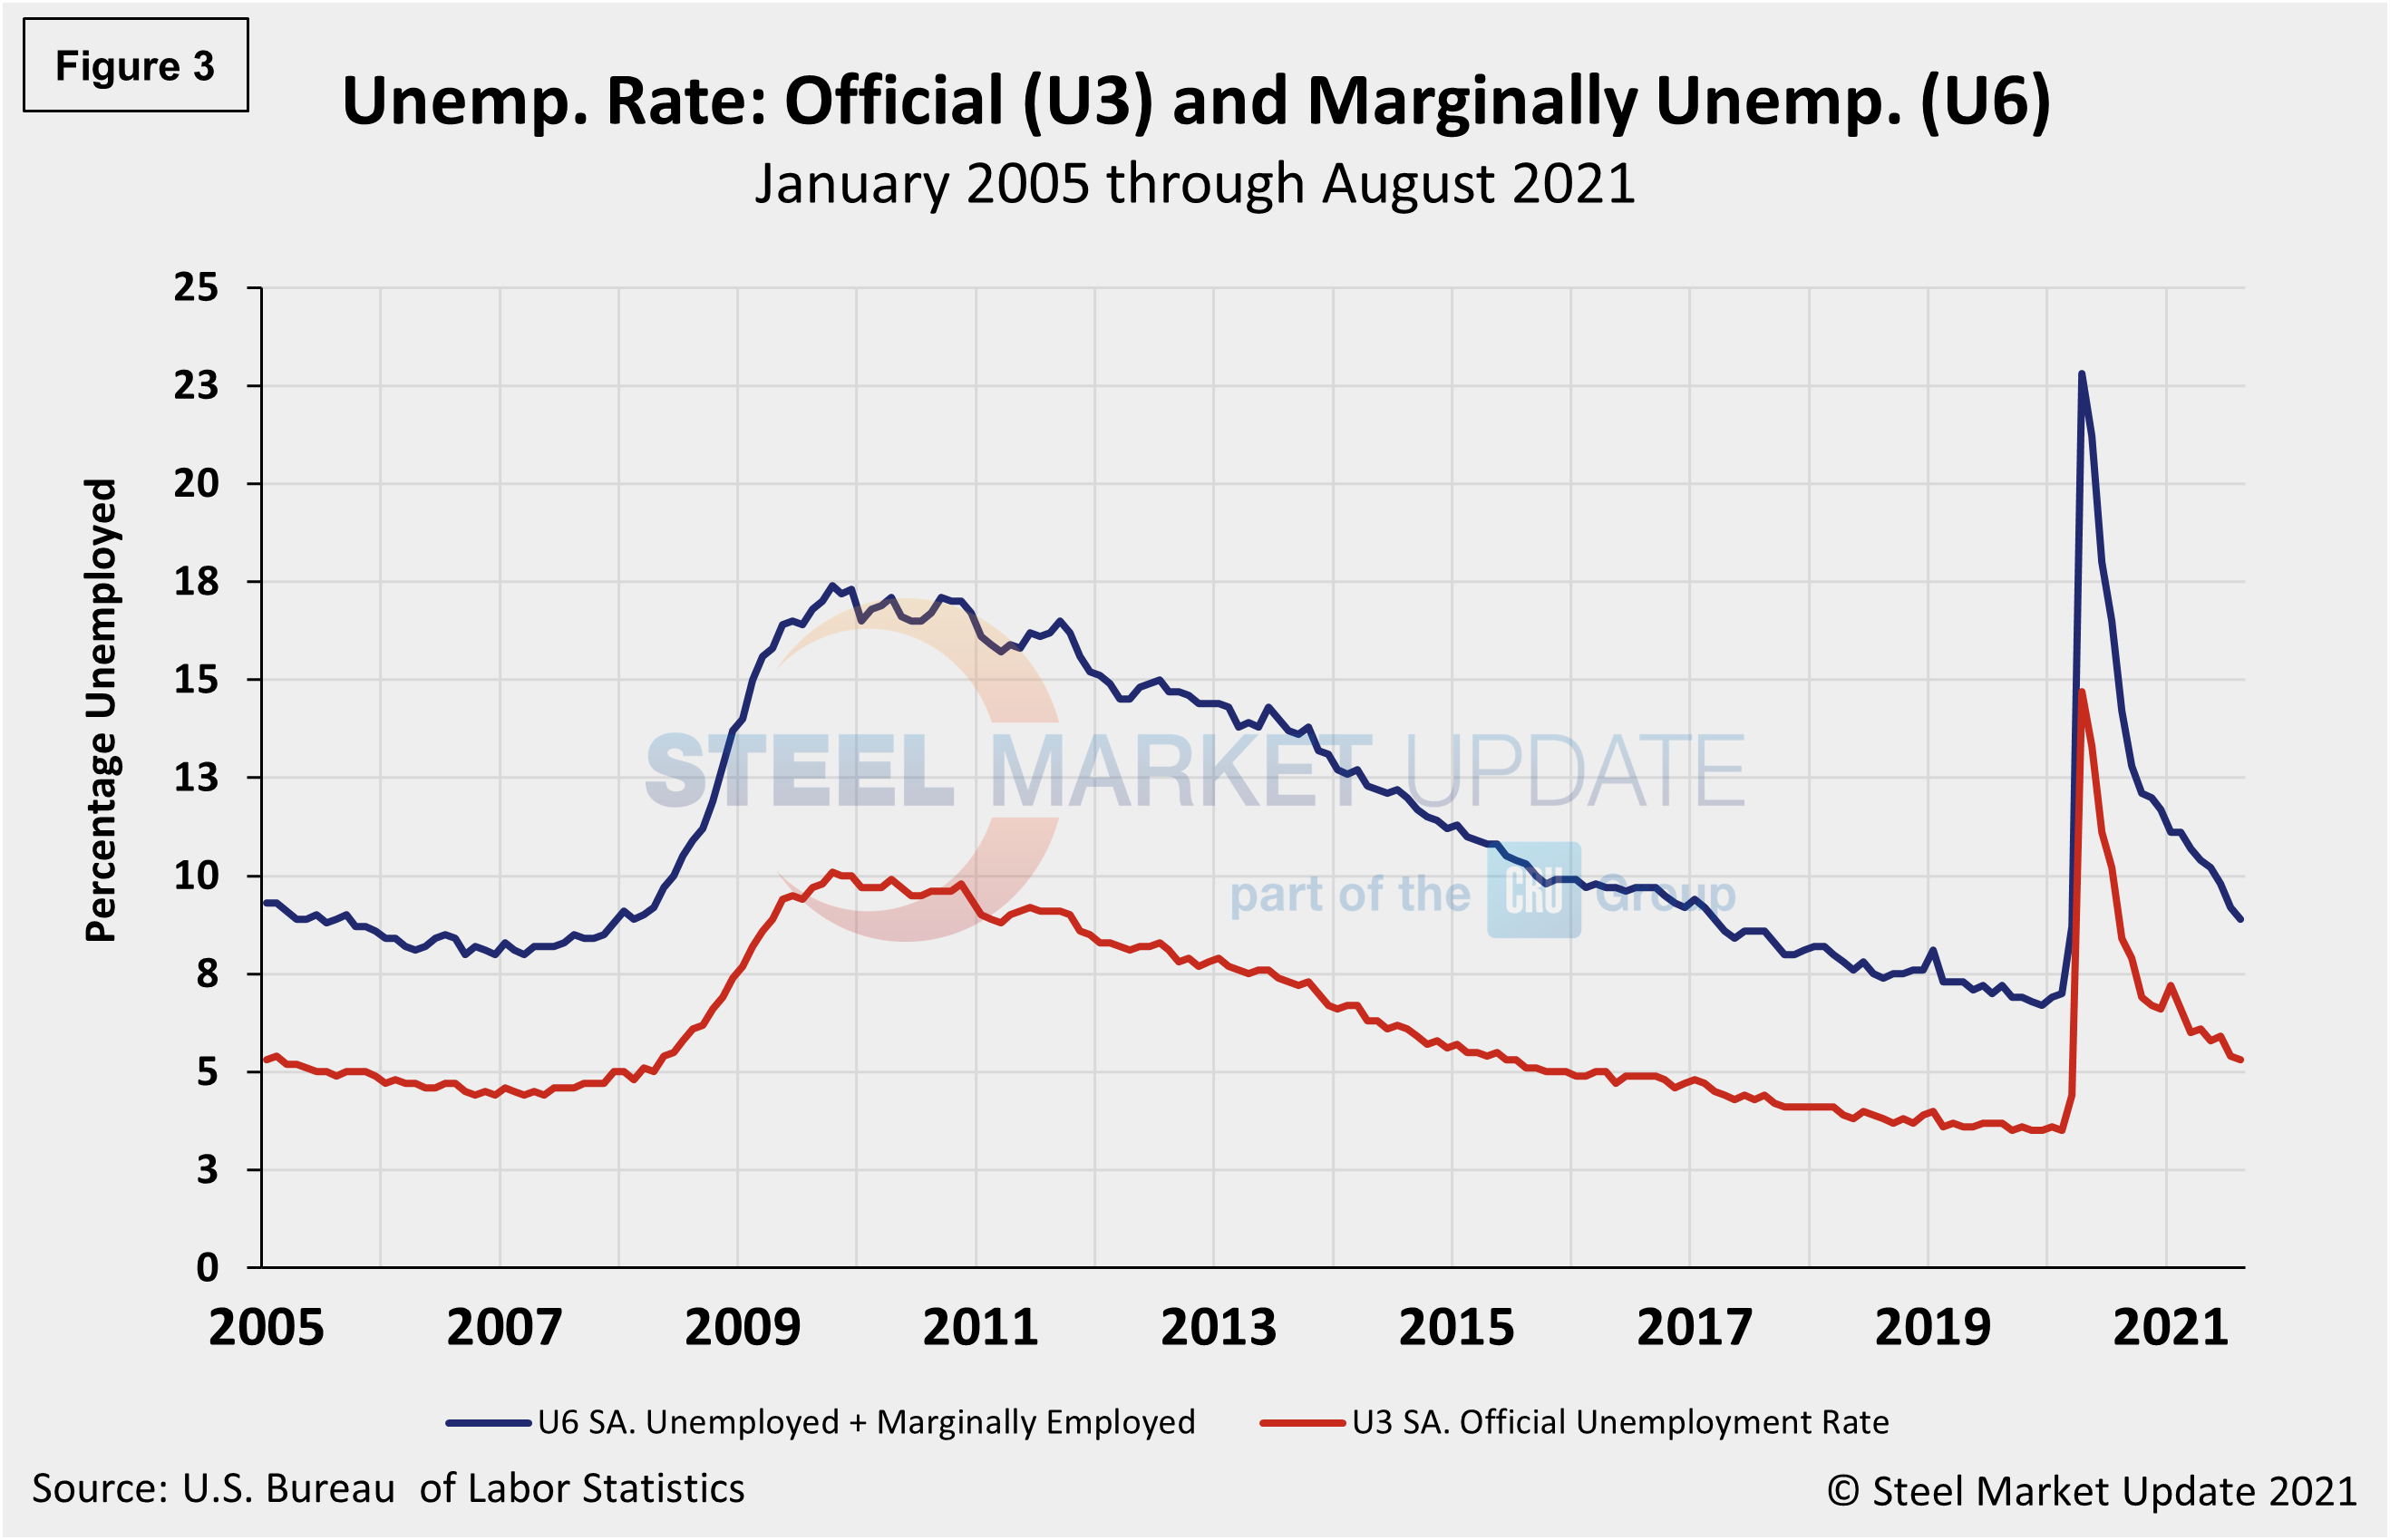
The official unemployment rate, U3, reported in the BLS Household survey (see explanation below) increased from 3.5% in February 2020 to 14.7% in April 2020. Since then it has trended down at a slow pace. August’s fall to 5.3%, however, was the lowest mark in 16 months as approximately 235,000 people re-entered the labor force. The more comprehensive U6 unemployment rate also dipped last month to 8.9% from 9.2% in July – a continued improvement from 22.8% in April 2020 (Figure 3). U6 includes individuals working part time who want full-time work and those who want to work but are so discouraged they have stopped looking.
The drop in the headline unemployment rate looked even stronger considering that the labor force participation rate was unchanged at 61.7%, tied for the highest level since the pandemic hit last March, but still well below the 63.4% in January 2020. An alternative measure of unemployment that includes discouraged workers and those holding part-time jobs for economic reasons fell sharply, dropping to 8.9% in August from 9.6% in July.
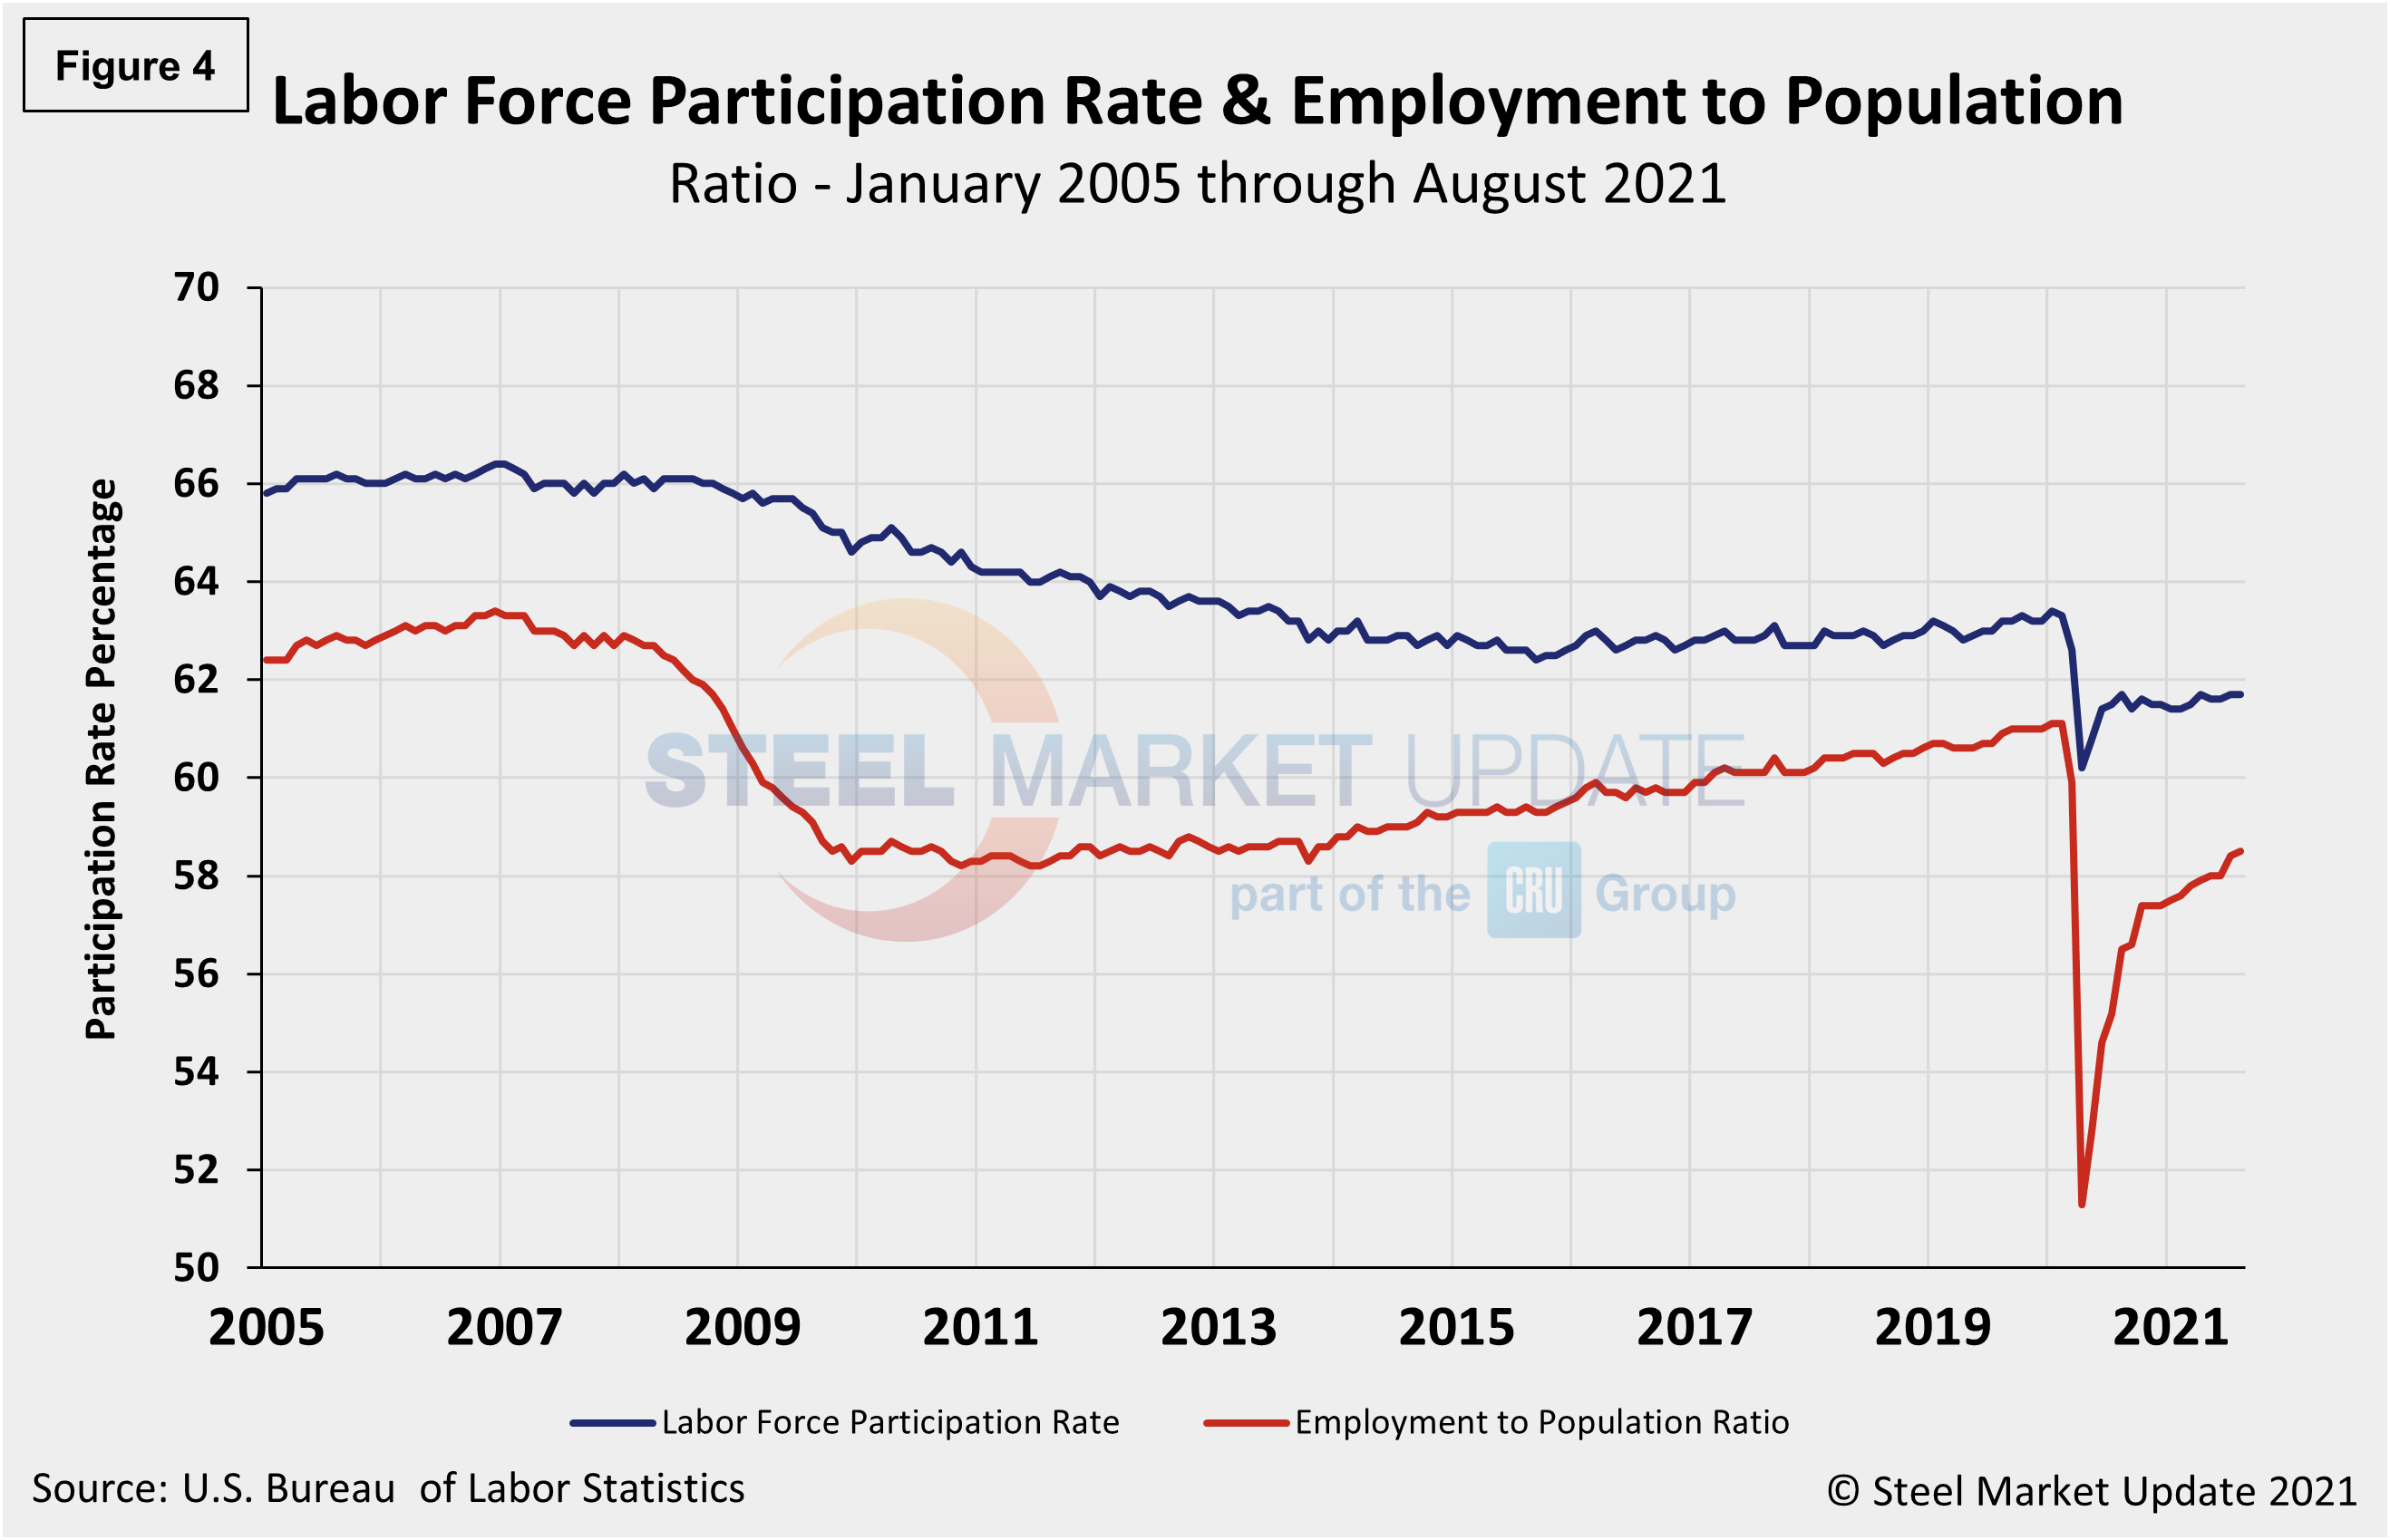
Another gauge, and more definitive view, are the number employed as a percentage of the population. Last month, the employment-to-population ratio was 58.5%, a marginal increase from July when the ratio was 58.4%, highlighting the challenges many companies have reported in filling openings. Figure 4 shows both measures on one graph.
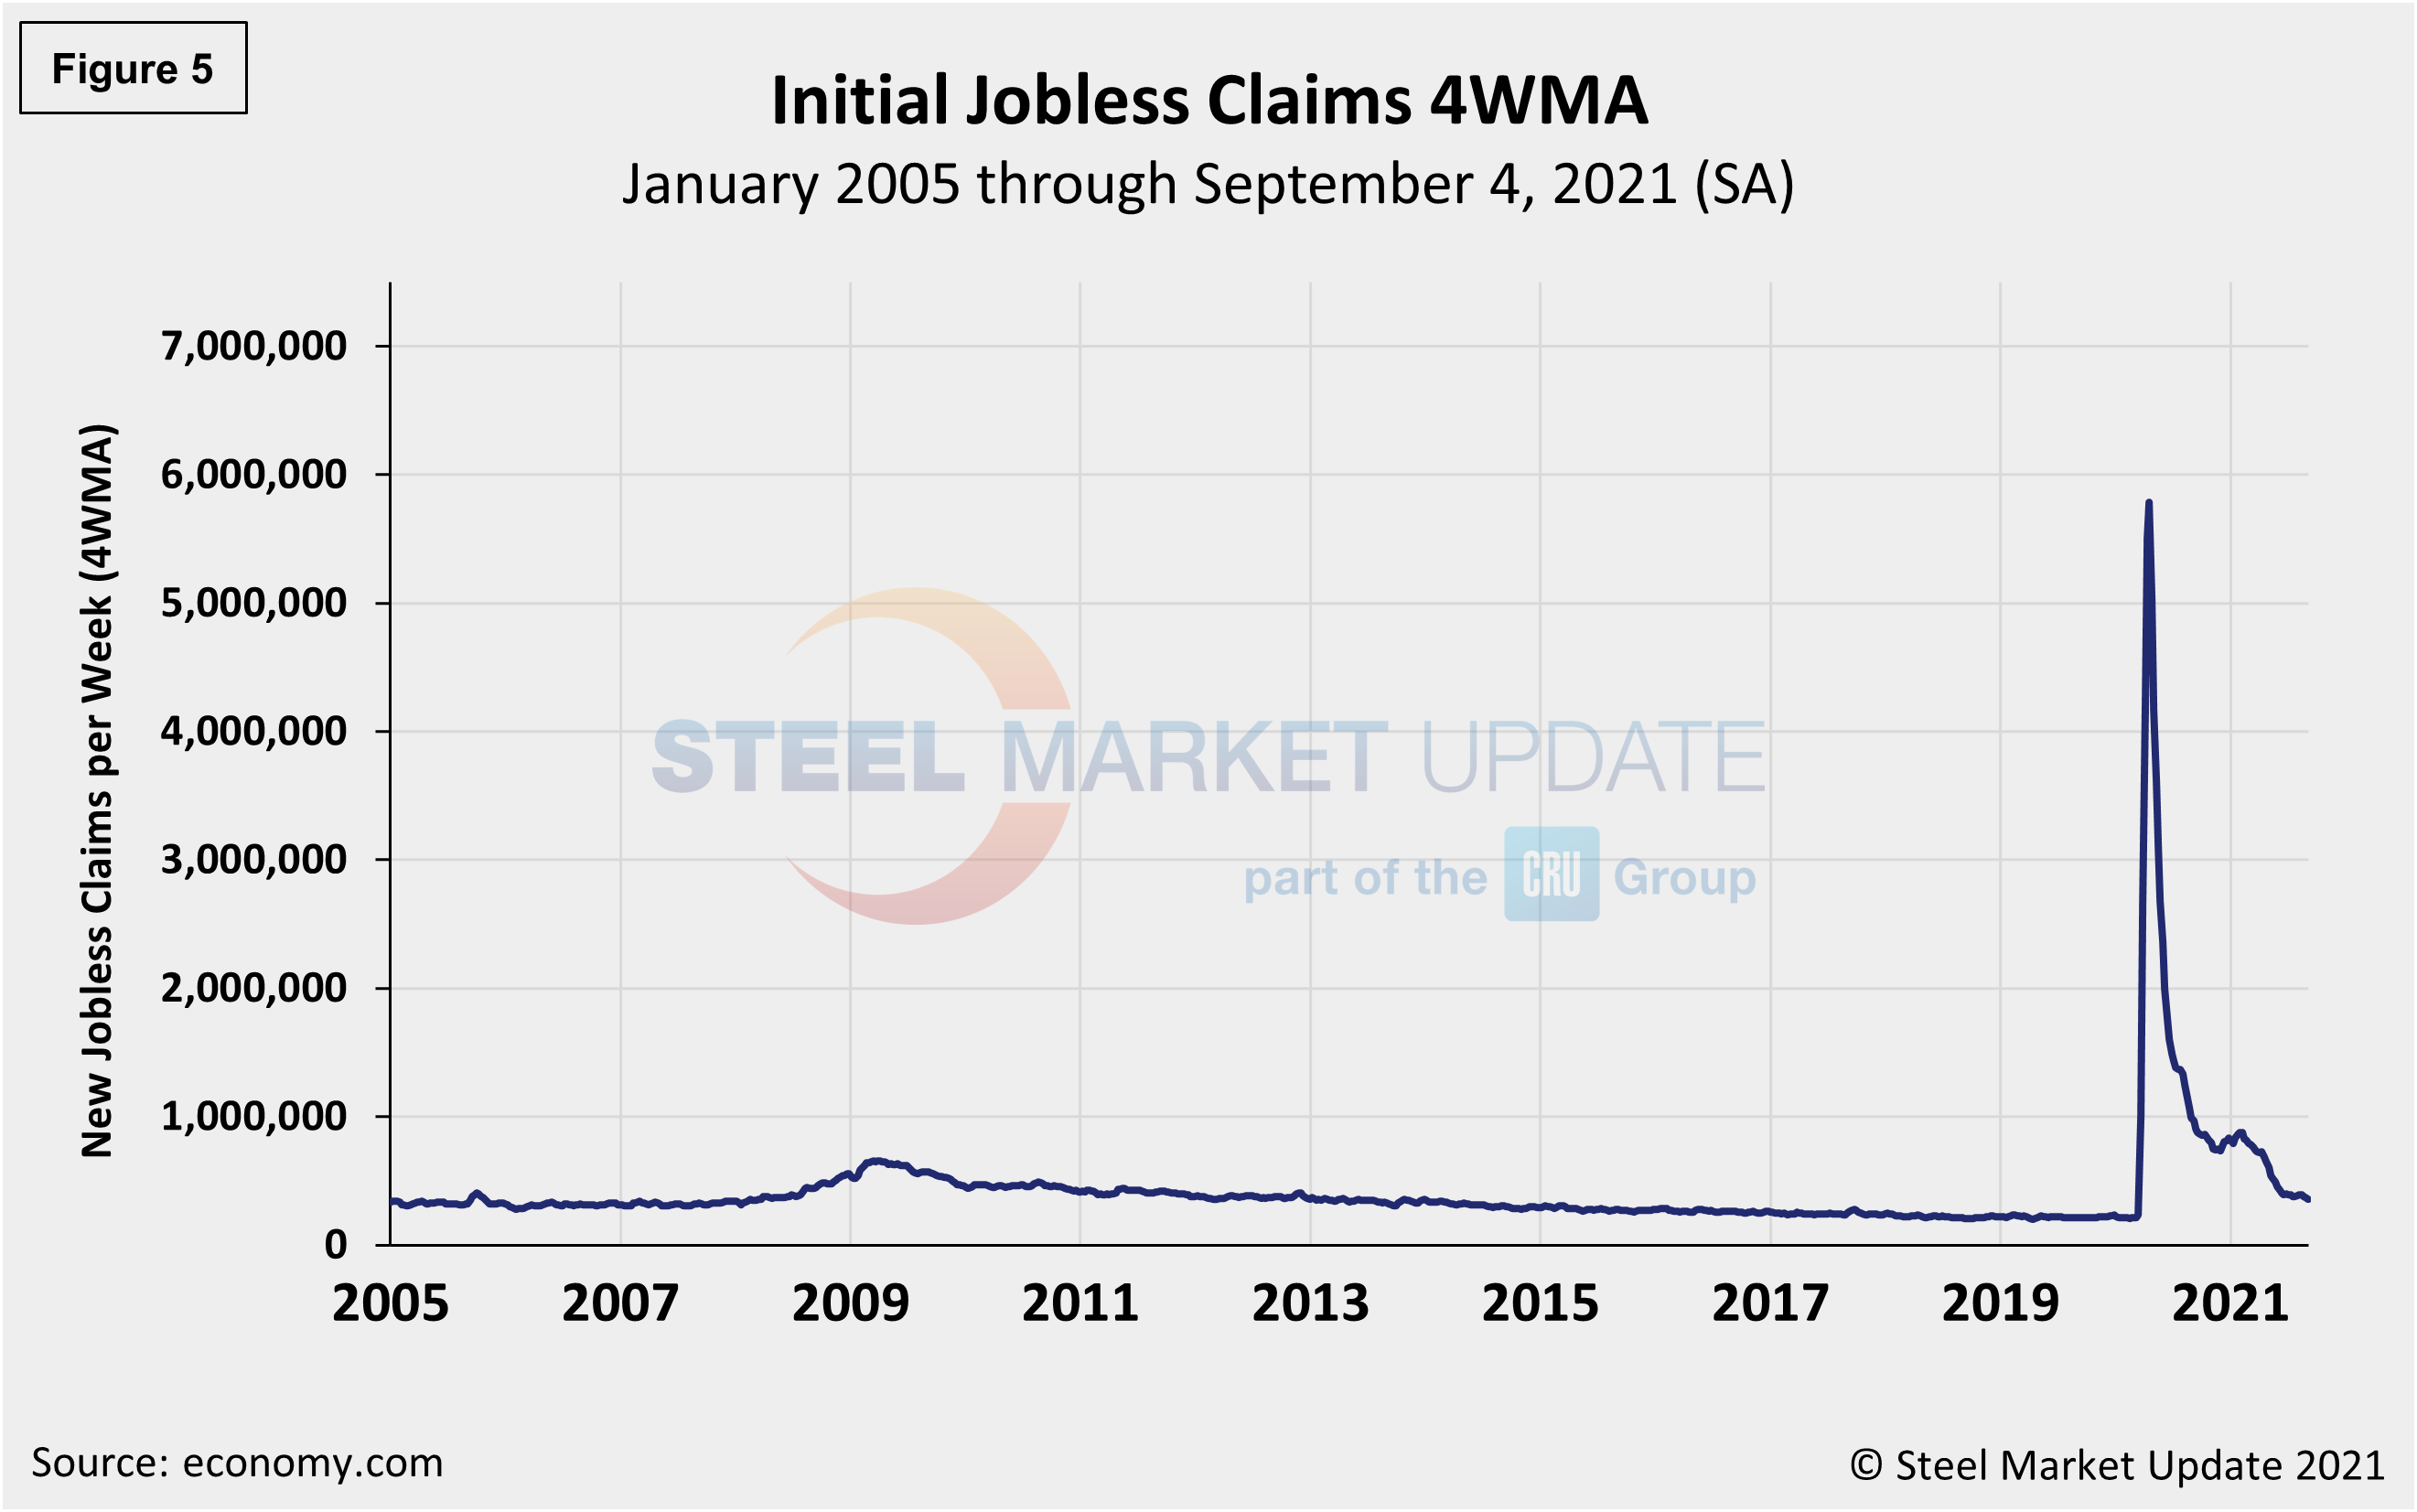
Initial claims for unemployment insurance, which are reported weekly by the Department of Labor, declined by 13,000 to 340,000 in the week ended Sept. 4, following declines of 25,000 and 27,000 in mid-August.
“U.S. initial claims for unemployment insurance are improving again,” reported Economy.com. “New filings fell from a revised 354,000 to 340,000 in the week ended Aug. 28, in line with expectations for a small decline. Continuing claims dropped to 2.748 million in the week ended Aug. 21. The number of those filing for Pandemic Unemployment Assistance moved slightly lower in the week ended Aug. 28 to 102,405, despite the program ending in many states. Total initial claims remain comfortably below 500,000, after struggling to break below that threshold for quite some time.”
The recent change in initial claims continues to point to a recovering labor market. Figure 5 shows the four-week moving average of new claims since January 2005, seasonally adjusted.
Human resources consulting firm Challenger, Gray and Christmas Inc. produces a monthly employment update for the U.S. It reported that job cuts in August were 15,723, down 17.0% from the 18,942 cuts reported the prior month. August’s total is the lowest since June 1997, and 86.0% lower than than the 115,762 job cuts seen in August 2020 that resulted from the pandemic. Figure 6 shows the monthly job cuts reported by Challenger on a 3MMA basis since January 2007.
“Companies are much more concerned about their talent getting poached than with finding ways to cut staff. They are in full retention mode,” said Challenger. “Market conditions were cited for the most cuts this year with 48,103, followed by store, unit, or plant closings, which accounted for 47,142. A downturn in demand caused 45,146 cuts this year, while ‘restructuring’ was cited for 43,407.”
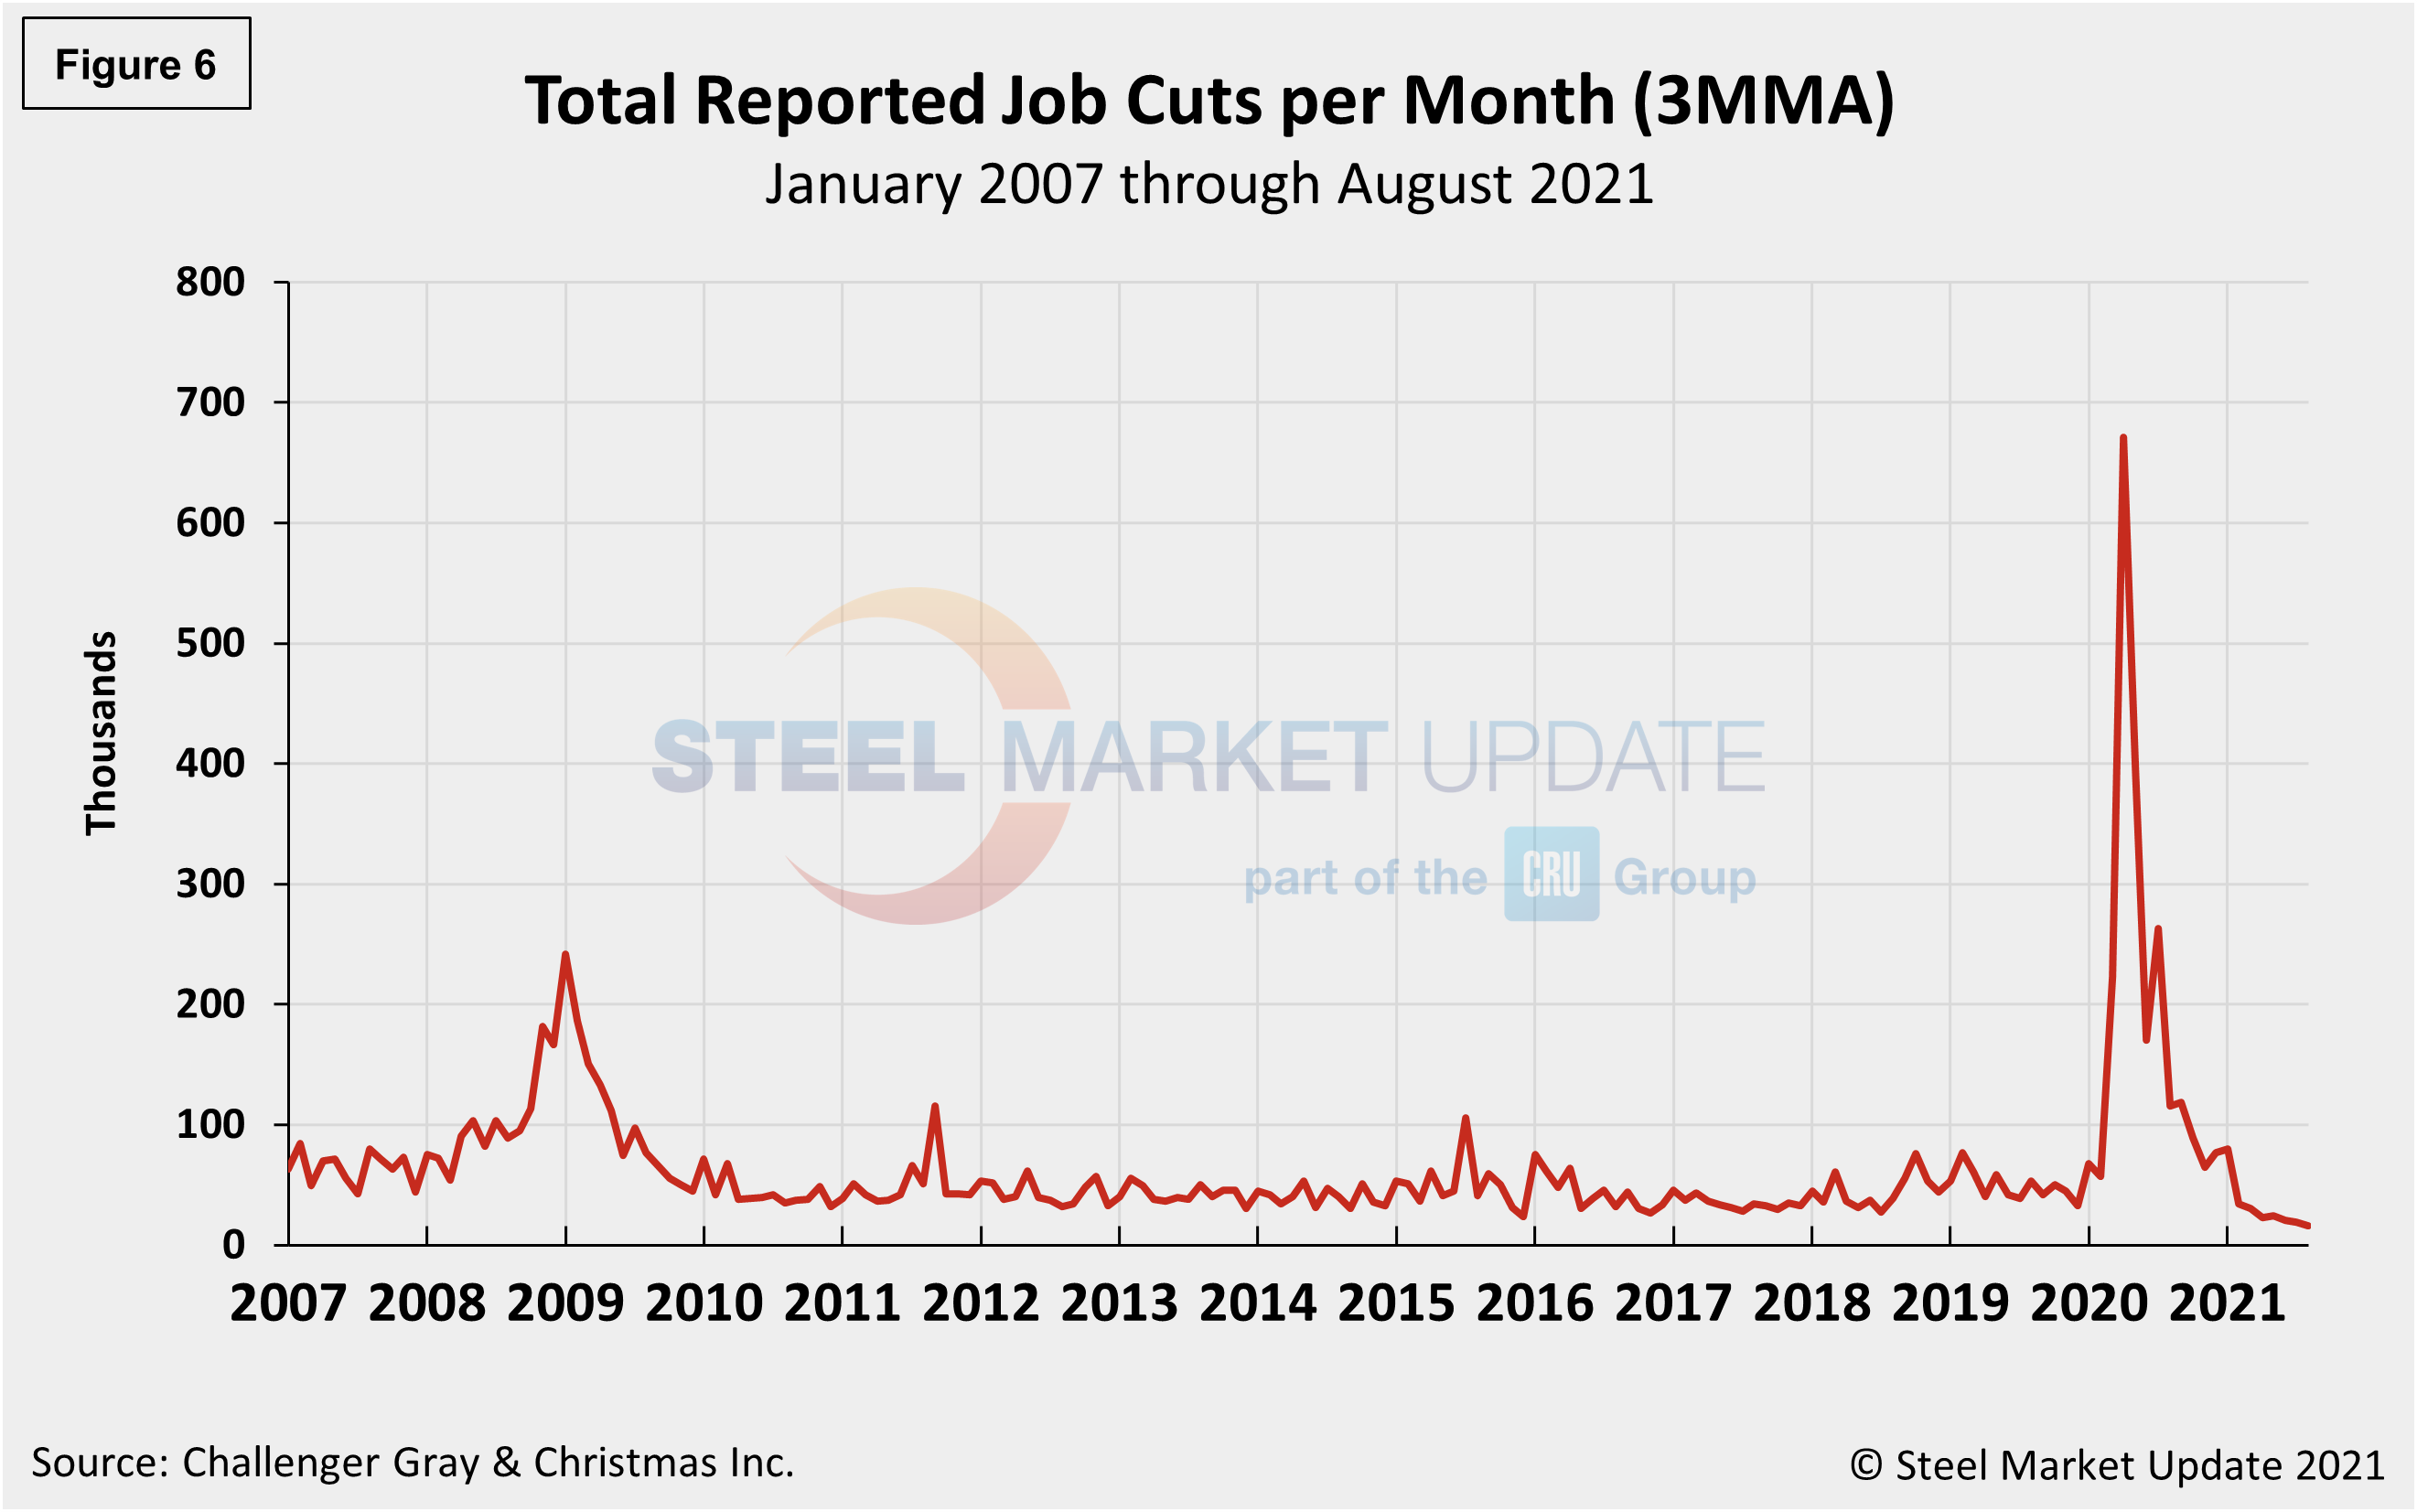
Year-to-date, employers have announced plans to cut 247,326 jobs from their payrolls, down 87.0% from the 1,963,458 jobs eliminated through the same period last year. It is the lowest January-August total on record. The second lowest occurred in 1997, when 260,798 cuts were tracked through August. The three-month moving average (3MMA) has declined in each of the last 15 months.
Explanation: On the first Friday of each month, the Bureau of Labor Statistics releases the employment data for the previous month. Data is available at www.bls.gov. The BLS reports on the results of two surveys. The Establishment survey reports the actual number employed by industry. The Household survey reports on the unemployment rate, participation rate, earnings, average workweek, the breakout into full-time and part-time workers and lots more details describing the age breakdown of the unemployed, reasons for and duration of unemployment.
By David Schollaert, David@SteelMarketUpdate.com


