

Analysis

September 27, 2021
North American Auto Assemblies Rise in August
Written by David Schollaert
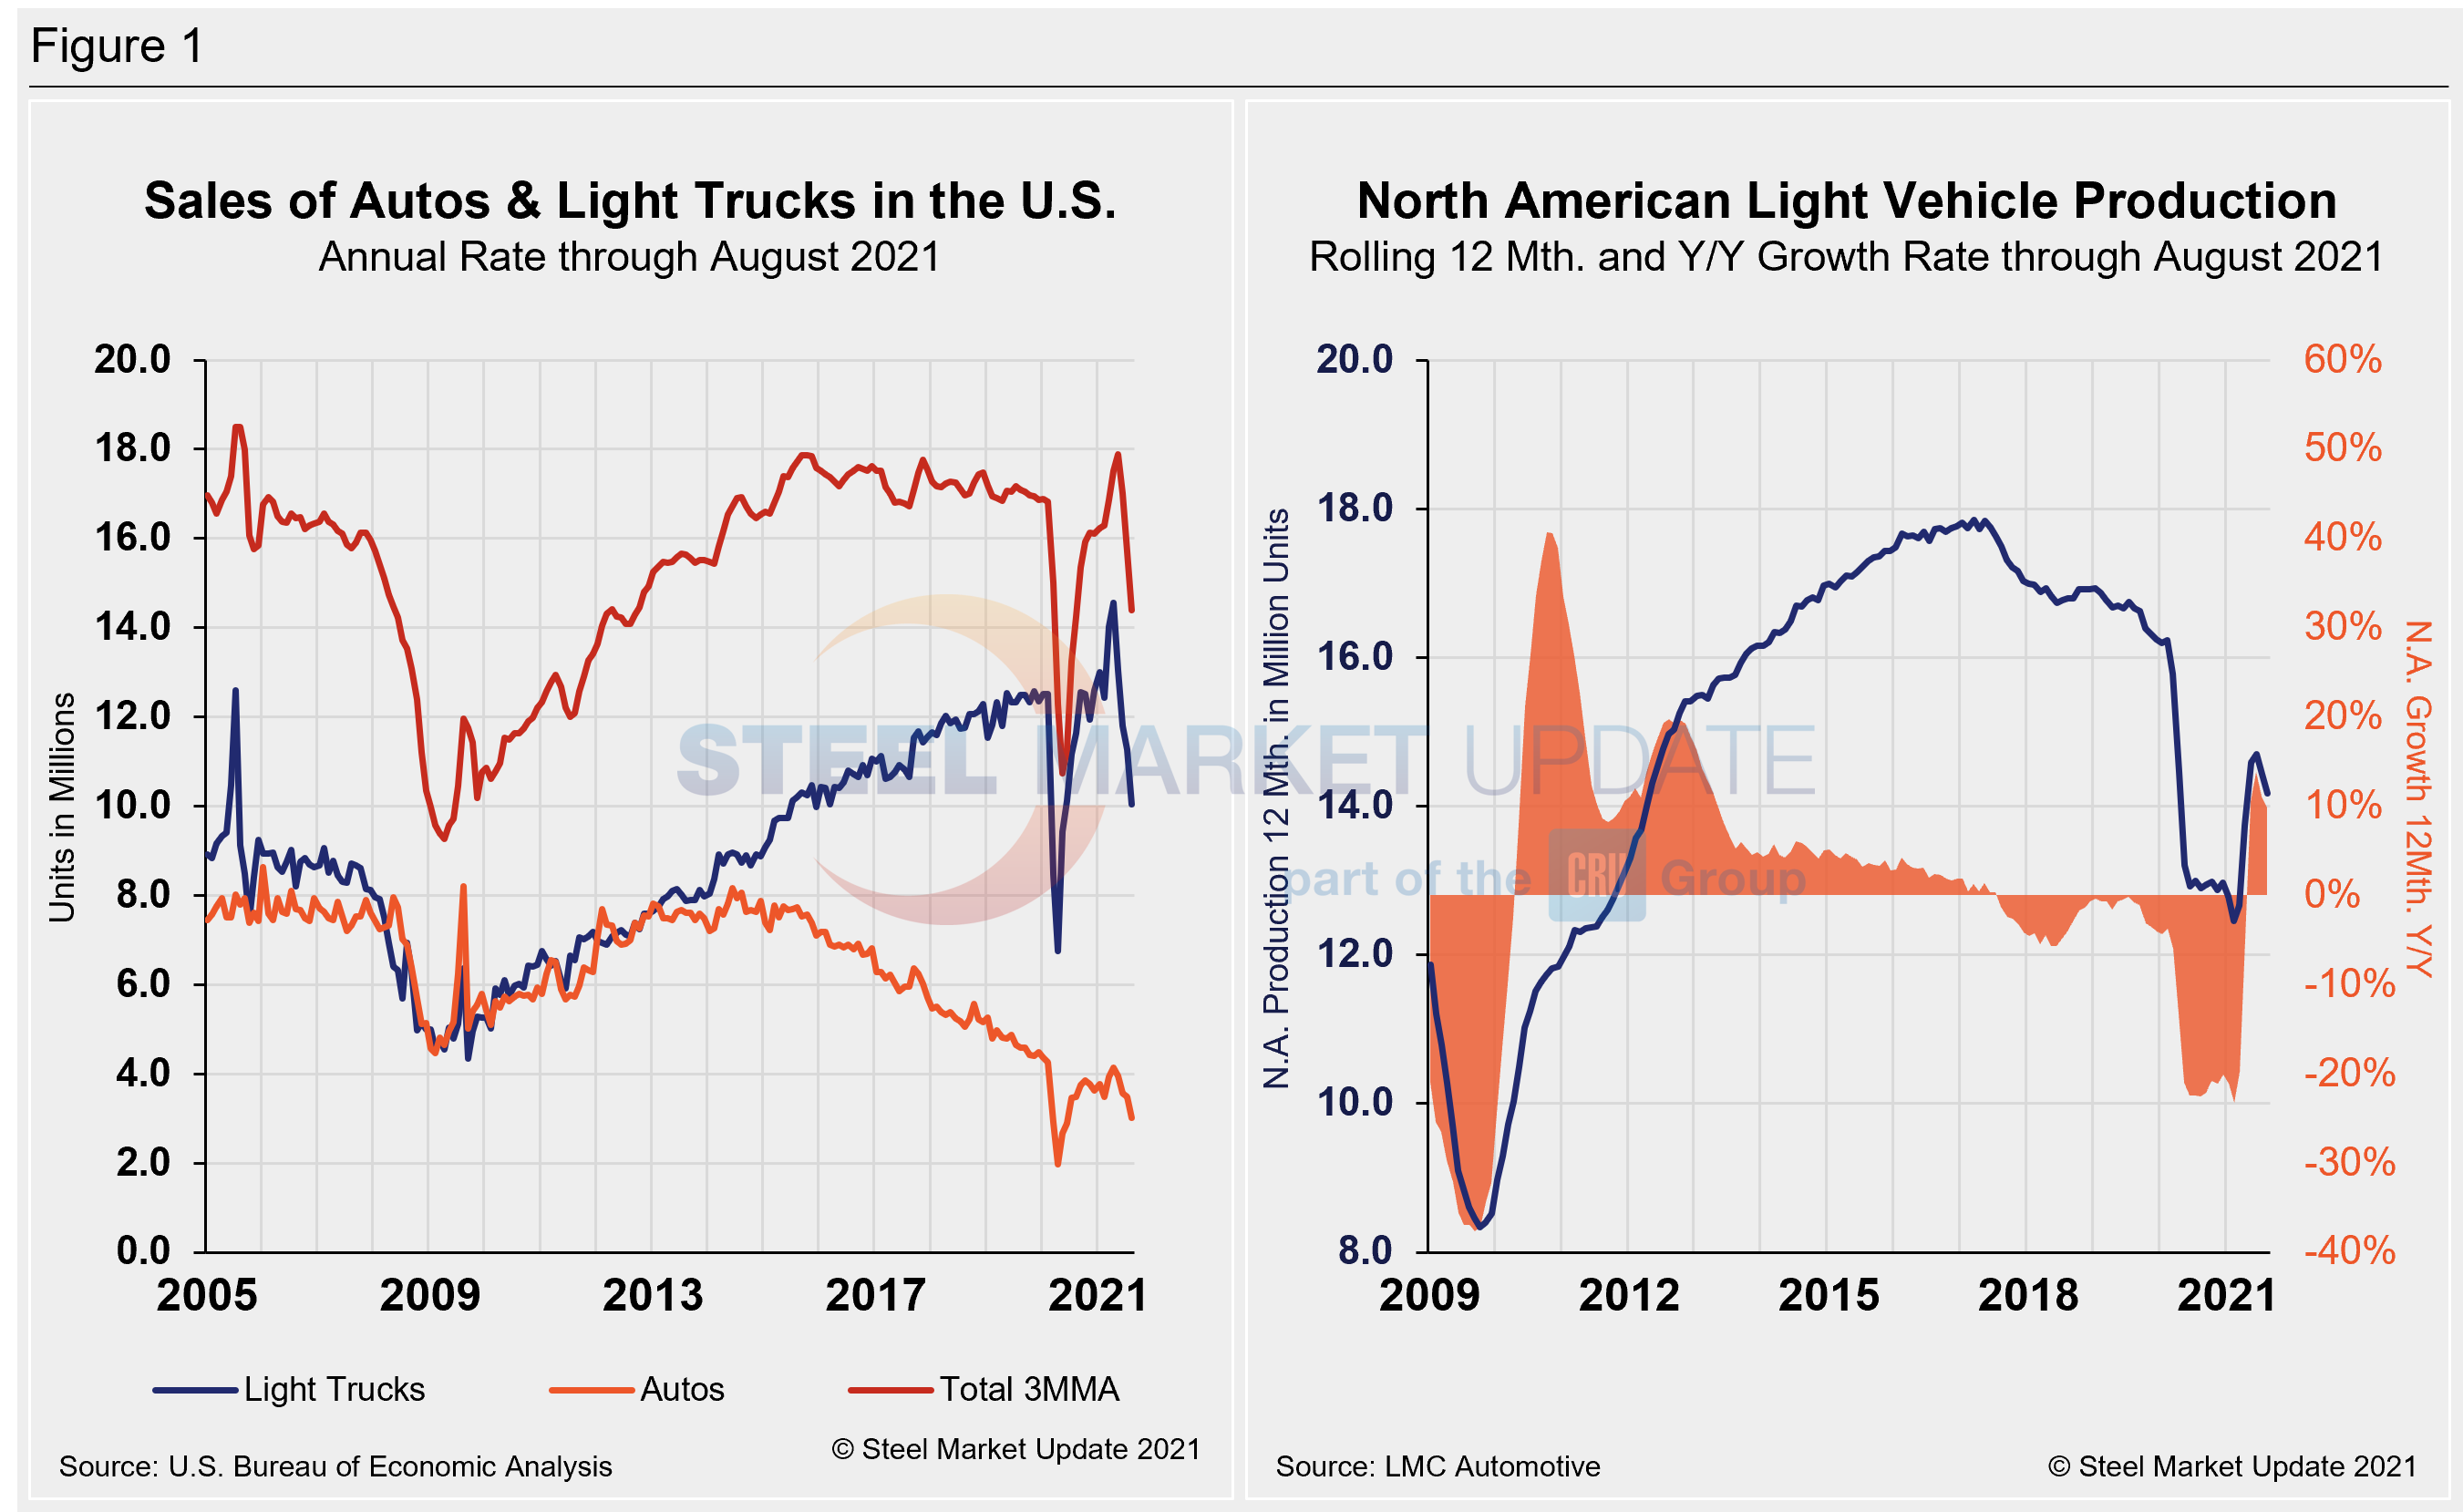
North American auto assemblies rebounded in August after light vehicle production hit a 14-month low the prior month. Despite the increase, the impact of the chip shortage continued to worsen, diminishing vehicle inventories and pushing regional sales down during the month, according to LMC Automotive (LMCA).
Total North American vehicle production, including personal and commercial vehicles, was 1.13 million units in August, 14.9% higher than July’s total. Despite the increase, August’s total was still 18.3% or 253,124 units behind year-ago levels, emphasizing the vast impact the global semiconductor shortage and other pandemic-related parts scarcities have had on the automotive industry.
Widespread production delays and extended idlings continue to impact carmakers, likely leading to decreased or inconsistent output for the remainder of the year. The duration of the chip shortage is expected to carry on well into 2022, keeping inventories at historically low levels and further impacting sales.
The effects of the pandemic, chip shortages and supply chain disruptions have tightened vehicle inventories, while sales also have continued to slip. While volumes were strongly recovering a year ago, U.S. light vehicle sales saw a 17.6% year-on-year decline this August, to 1.09 million units, the lowest August total since 2011. The selling rate for U.S. vehicles in August was an annualized 13.06 million units, down 11.0% from 14.6 million units in July and down 30.1% from the high of 18.69 million units in April.
Average transaction prices hit yet another record high in August at $41,525 per unit, up by almost $6,000 per unit year on year, said the LMCA. Incentives remained on their downward trend, to $1,830 per unit in August compared to $1,968 per unit in July.
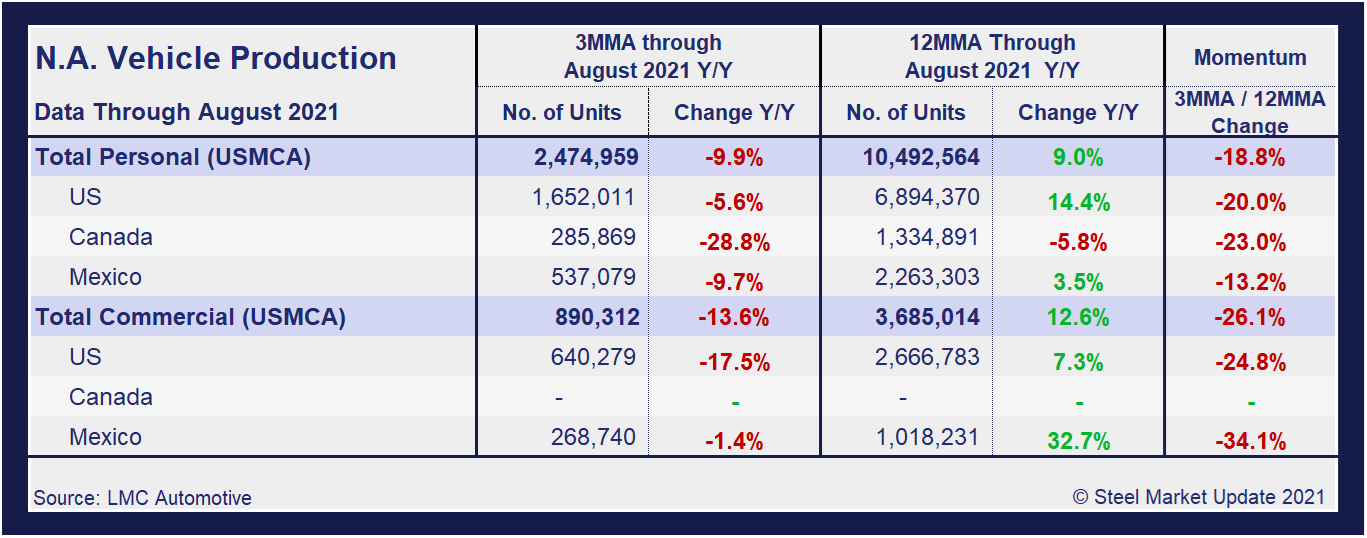
A short-term snapshot of assembly by nation and vehicle type is shown in the table below. It breaks down total North American personal and commercial vehicle production into the U.S, Canadian and Mexican components, along with the three- and 12-month growth rate for each. At the far right it shows the momentum for the total and for each of the three nations.
Although the initial rebound from the COVID-19 doldrums was impressive, the effect of the chip shortage has been disastrous. Through June, growth rates for personal and commercial light vehicles soared by 156.8% and 127.4%, respectively, but have since seen a nosedive as the impact of the chip shortage took hold.
In three months through August, the growth rate for total personal vehicle assemblies in the USMCA was -9.9% year over year, while commercial light vehicle assemblies saw negative growth of -13.6%. To say that the global semiconductor chip shortage has wreaked havoc on automotive production across North America would be an understatement.
Personal Vehicle Production
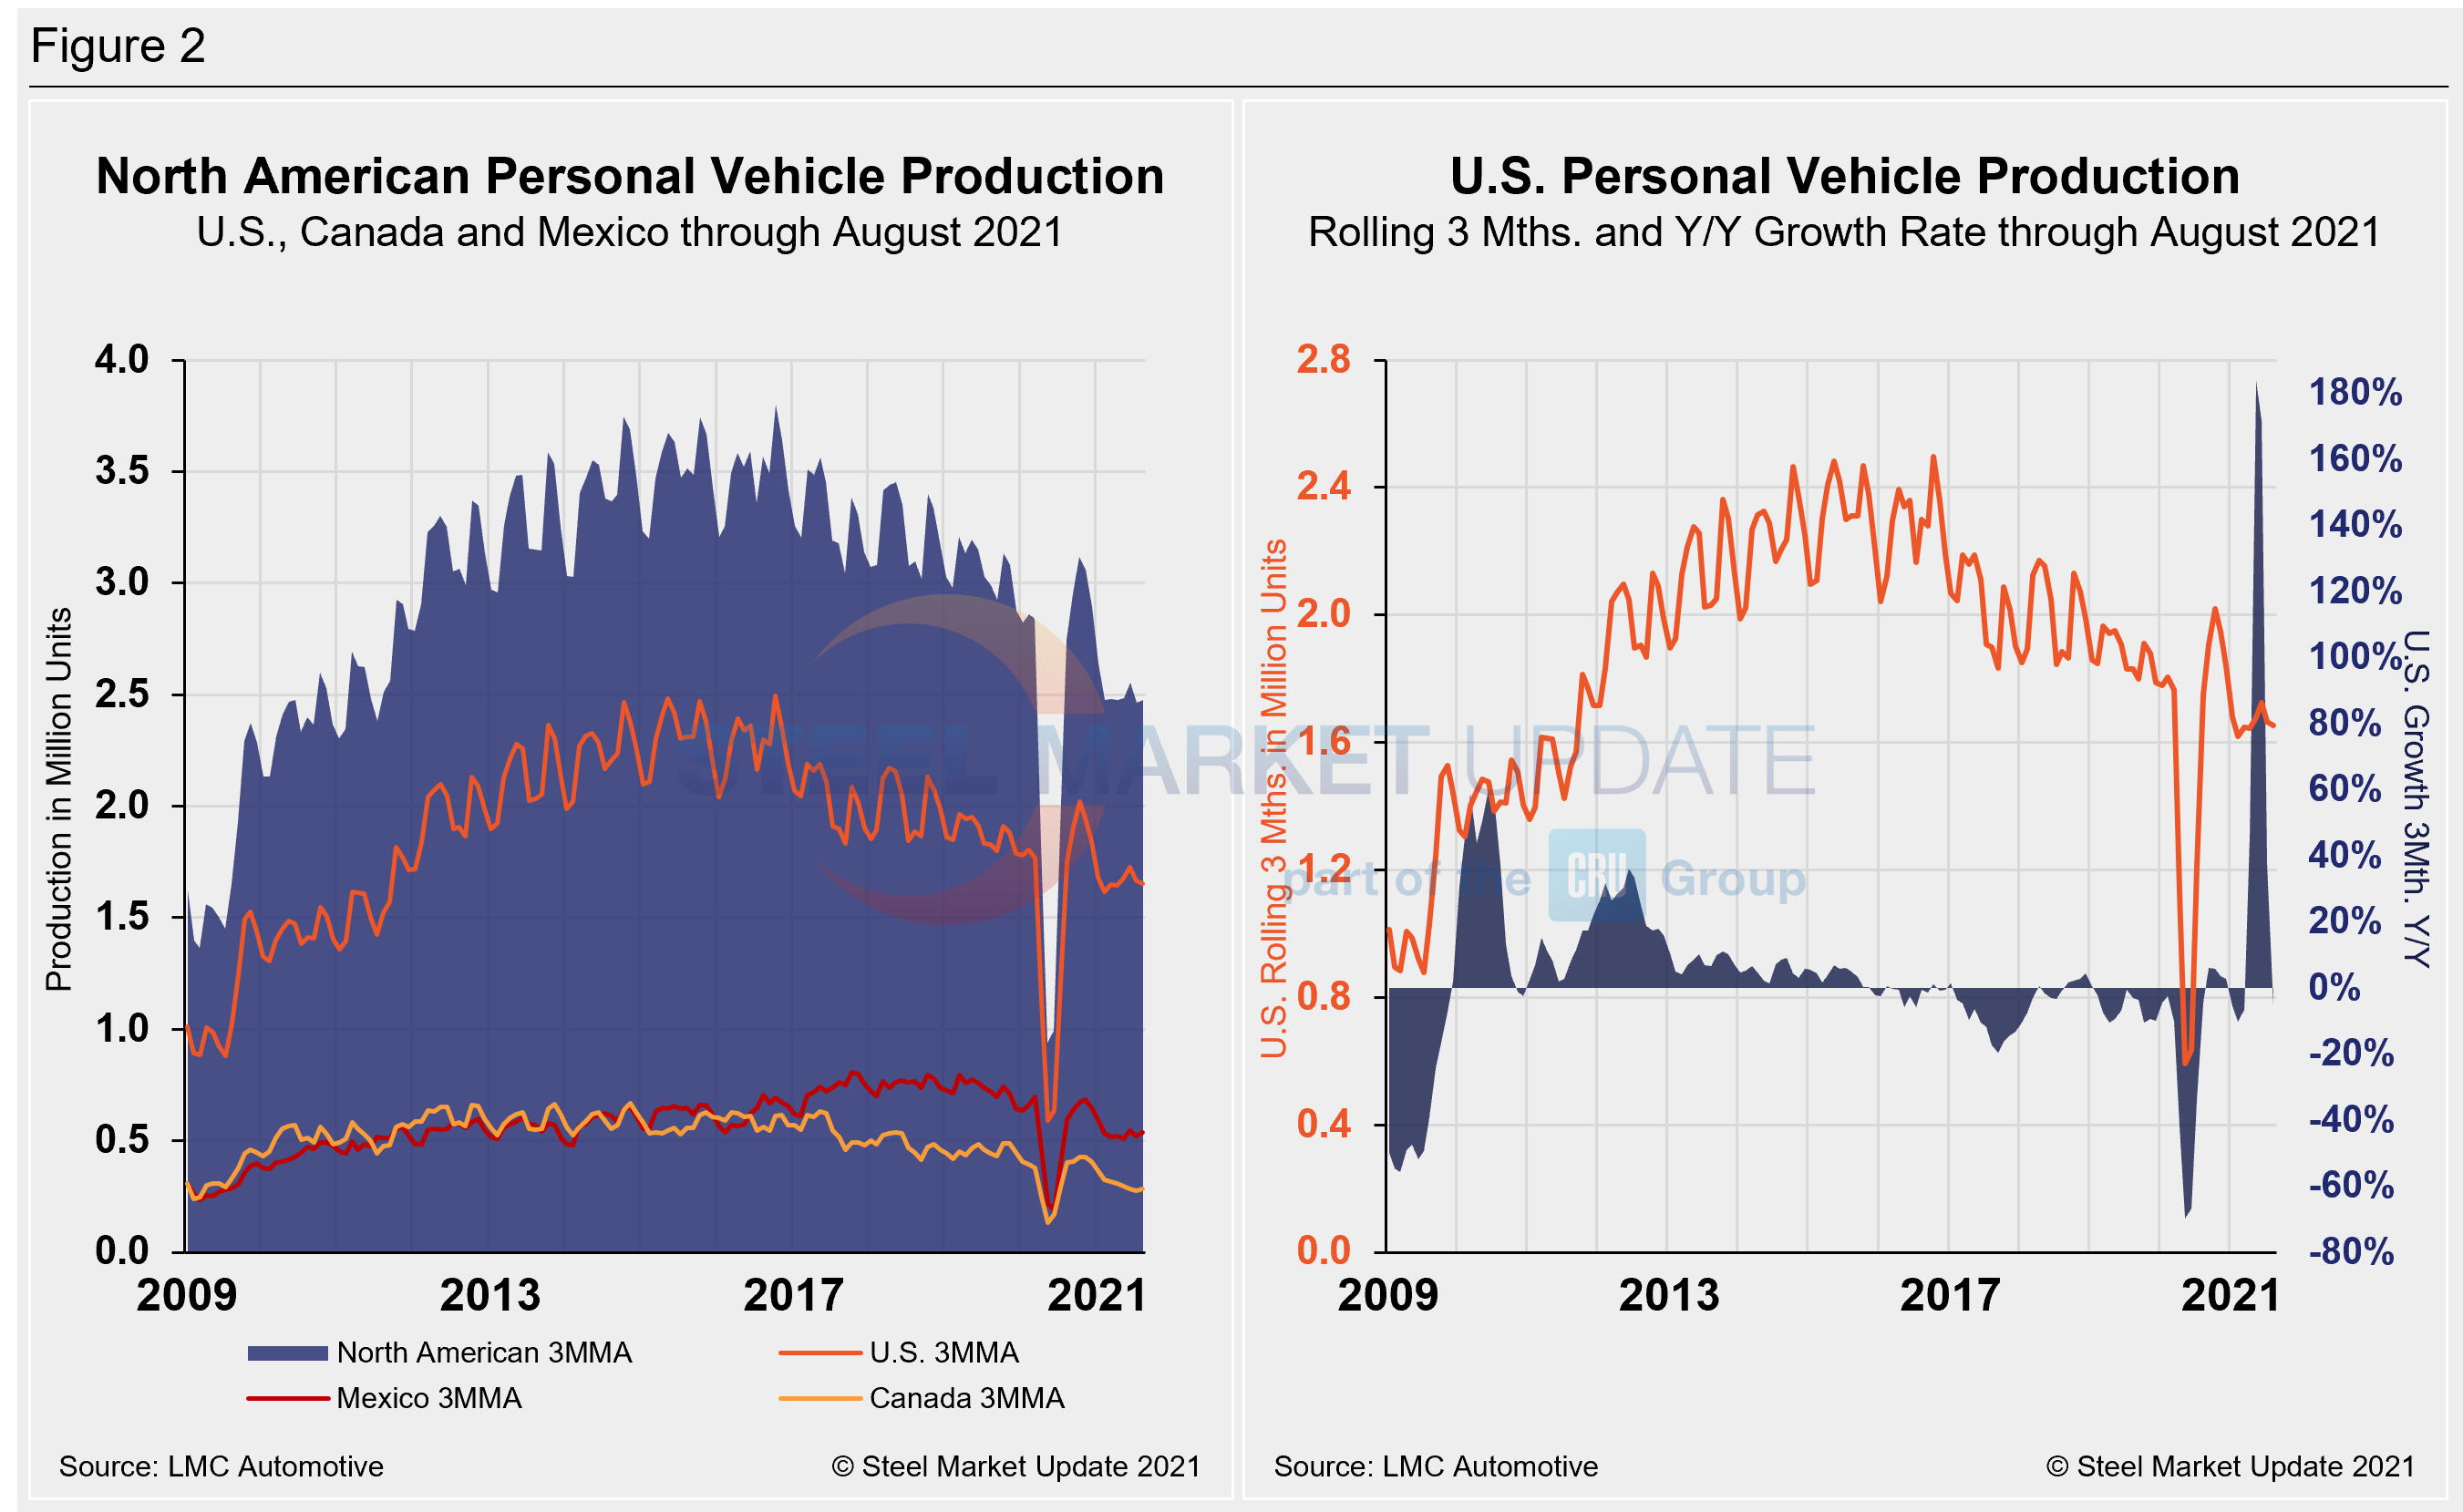
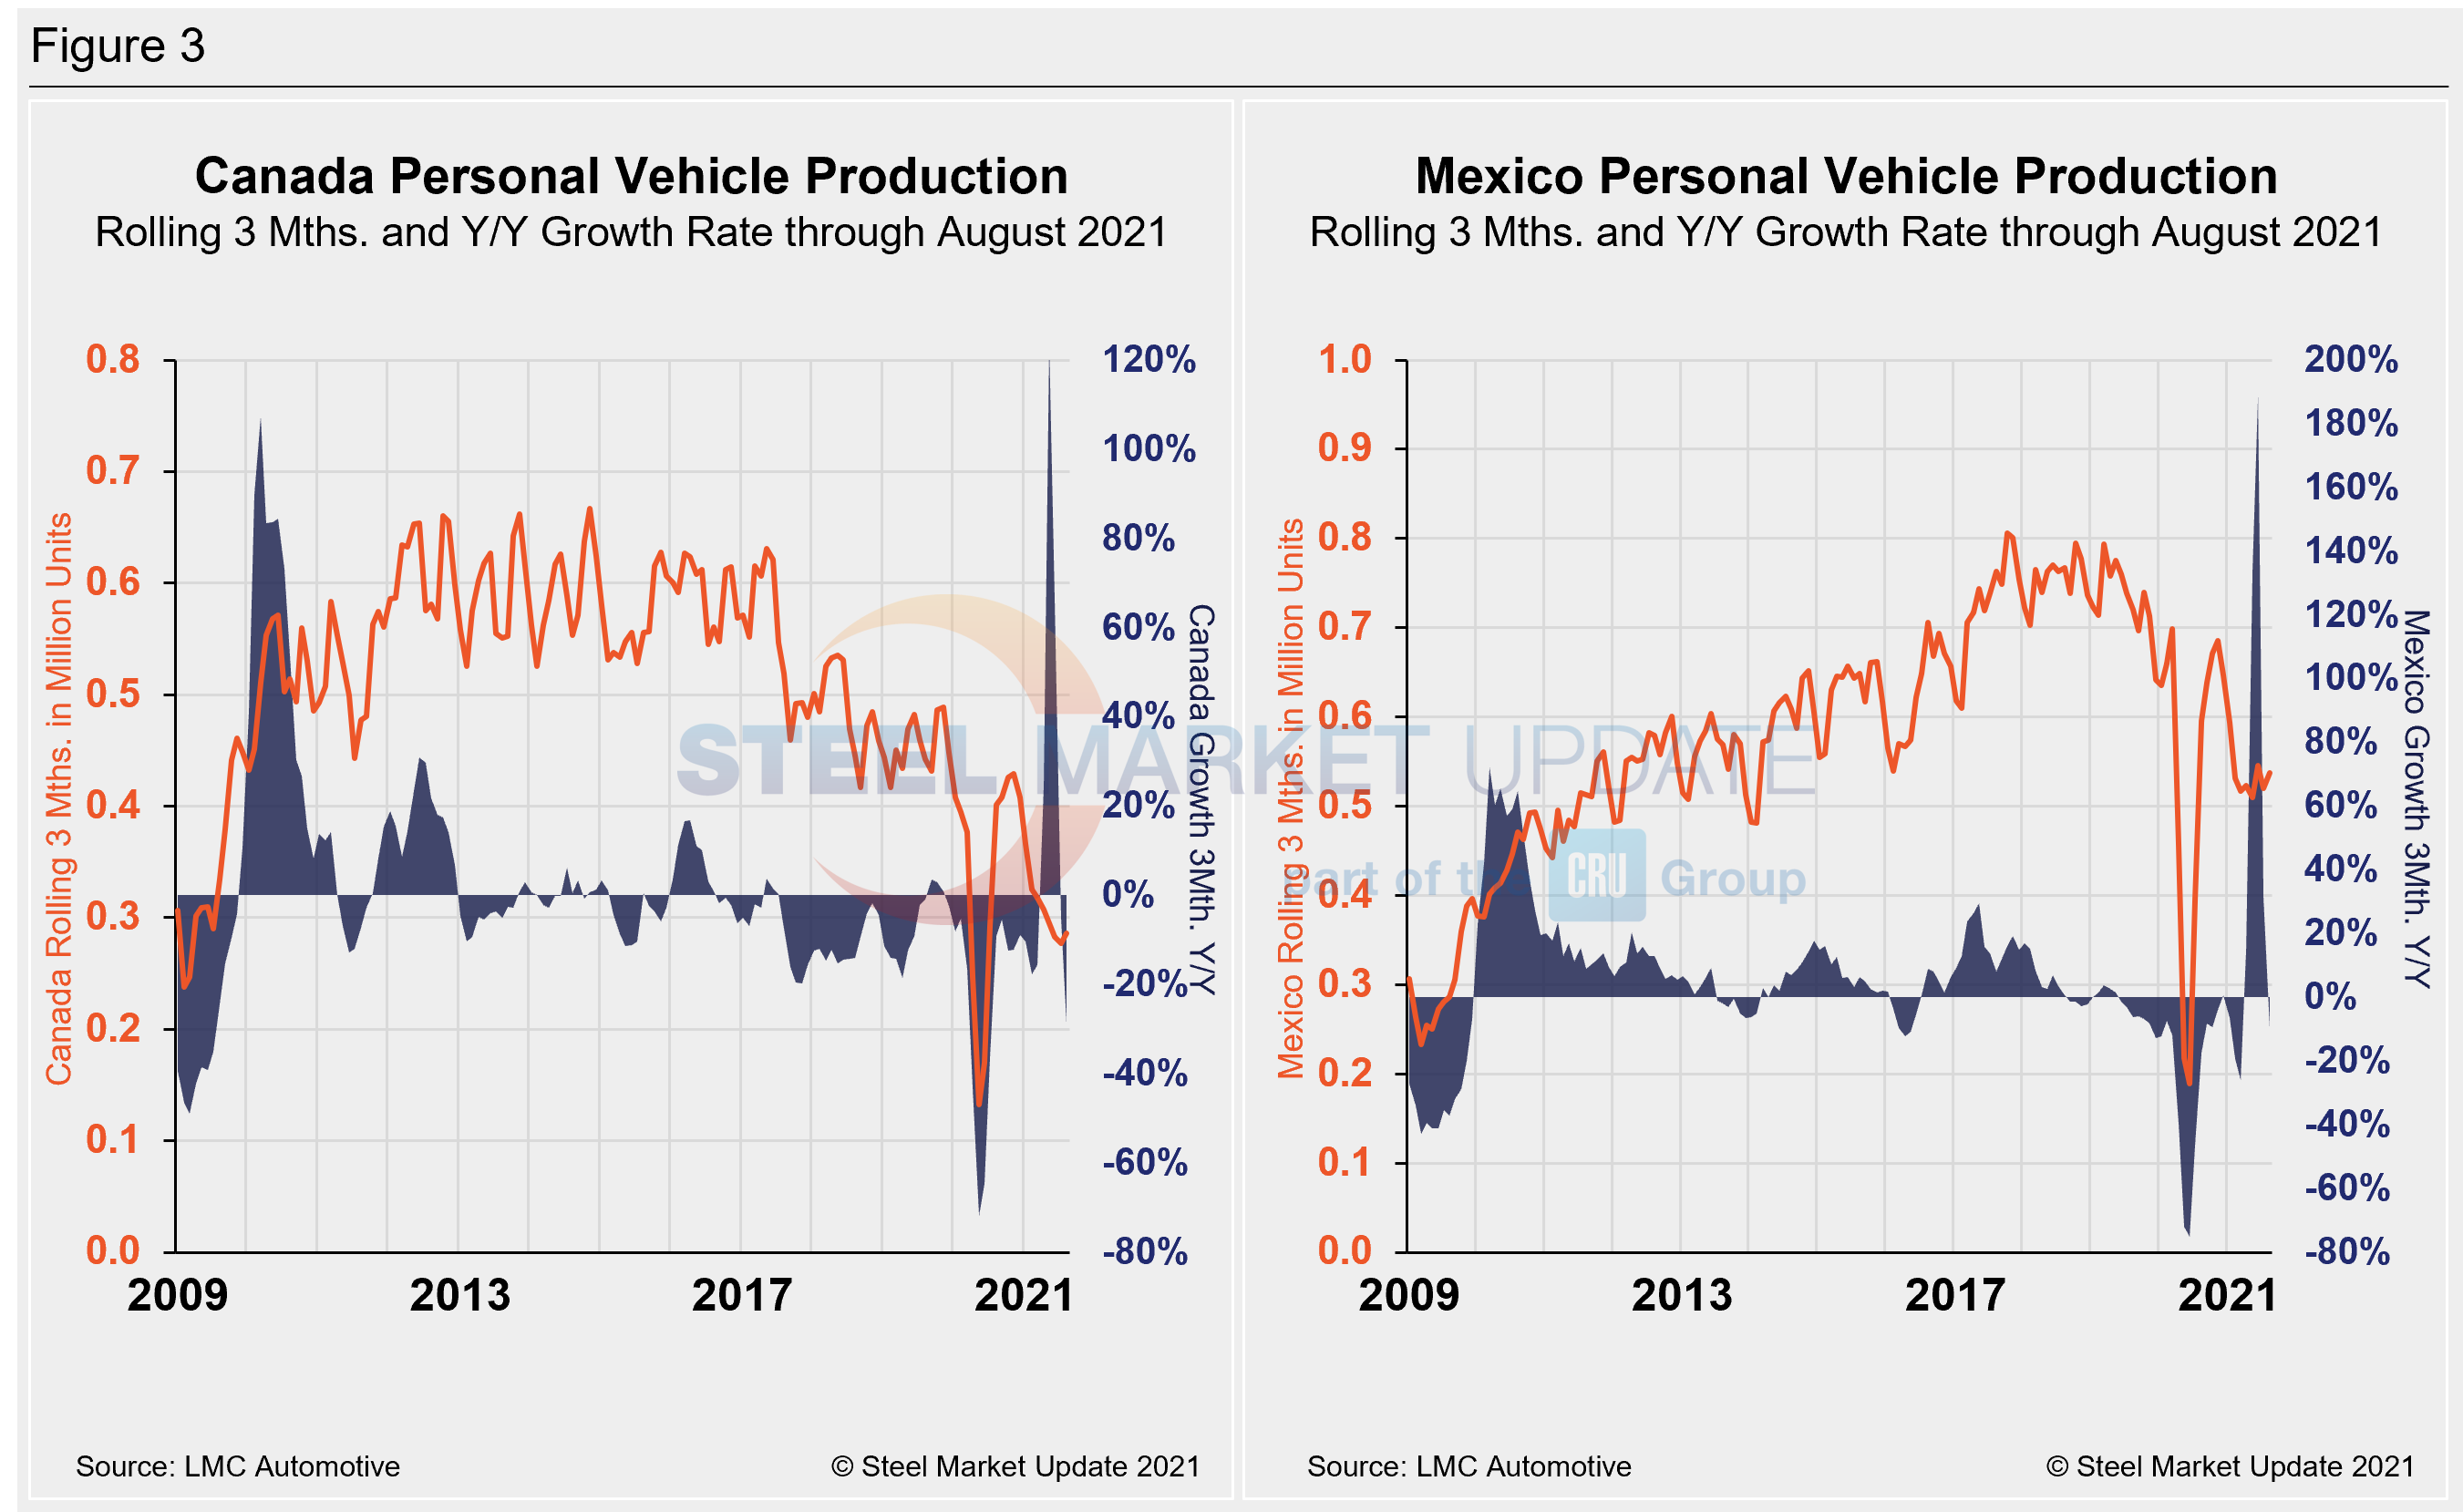
The longer-term picture on personal vehicle production across North America is shown below. The first chart in Figure 2 shows the total personal vehicle production for North America and the total for each nation. The production of personal vehicles in the U.S. and the year-over-year growth rate is displayed in the second chart. Figure 3 shows side-by-side the production of personal vehicles in Canada and Mexico, and the year-over-year growth rate.
In terms of personal vehicle production, only Mexico saw a decrease in August, down 2.7% month on month or 4,678 fewer units produced compared to July. Canada saw an increase of 19.2% or 15,973 units produced, while the U.S. growth rate was up 15.7% month on month, an increase of 74,298 units in August. Despite the growth in August, production was down year on year by 29.5% in Canada, 21.0% in Mexico, and down 17.5% in the U.S.
Canada’s personal vehicle production share of the North American market edged up to 11.6% in August, compared to 11.3% the month prior. Mexico carried a 21.1% market share across the continent, down from 21.4% month on month. The U.S. slipped to a 66.7% share of the North American market versus 67.6% in July. Mexico’s share reached 21.7% in August, up from 21.2% the month prior.
Commercial Vehicle Production
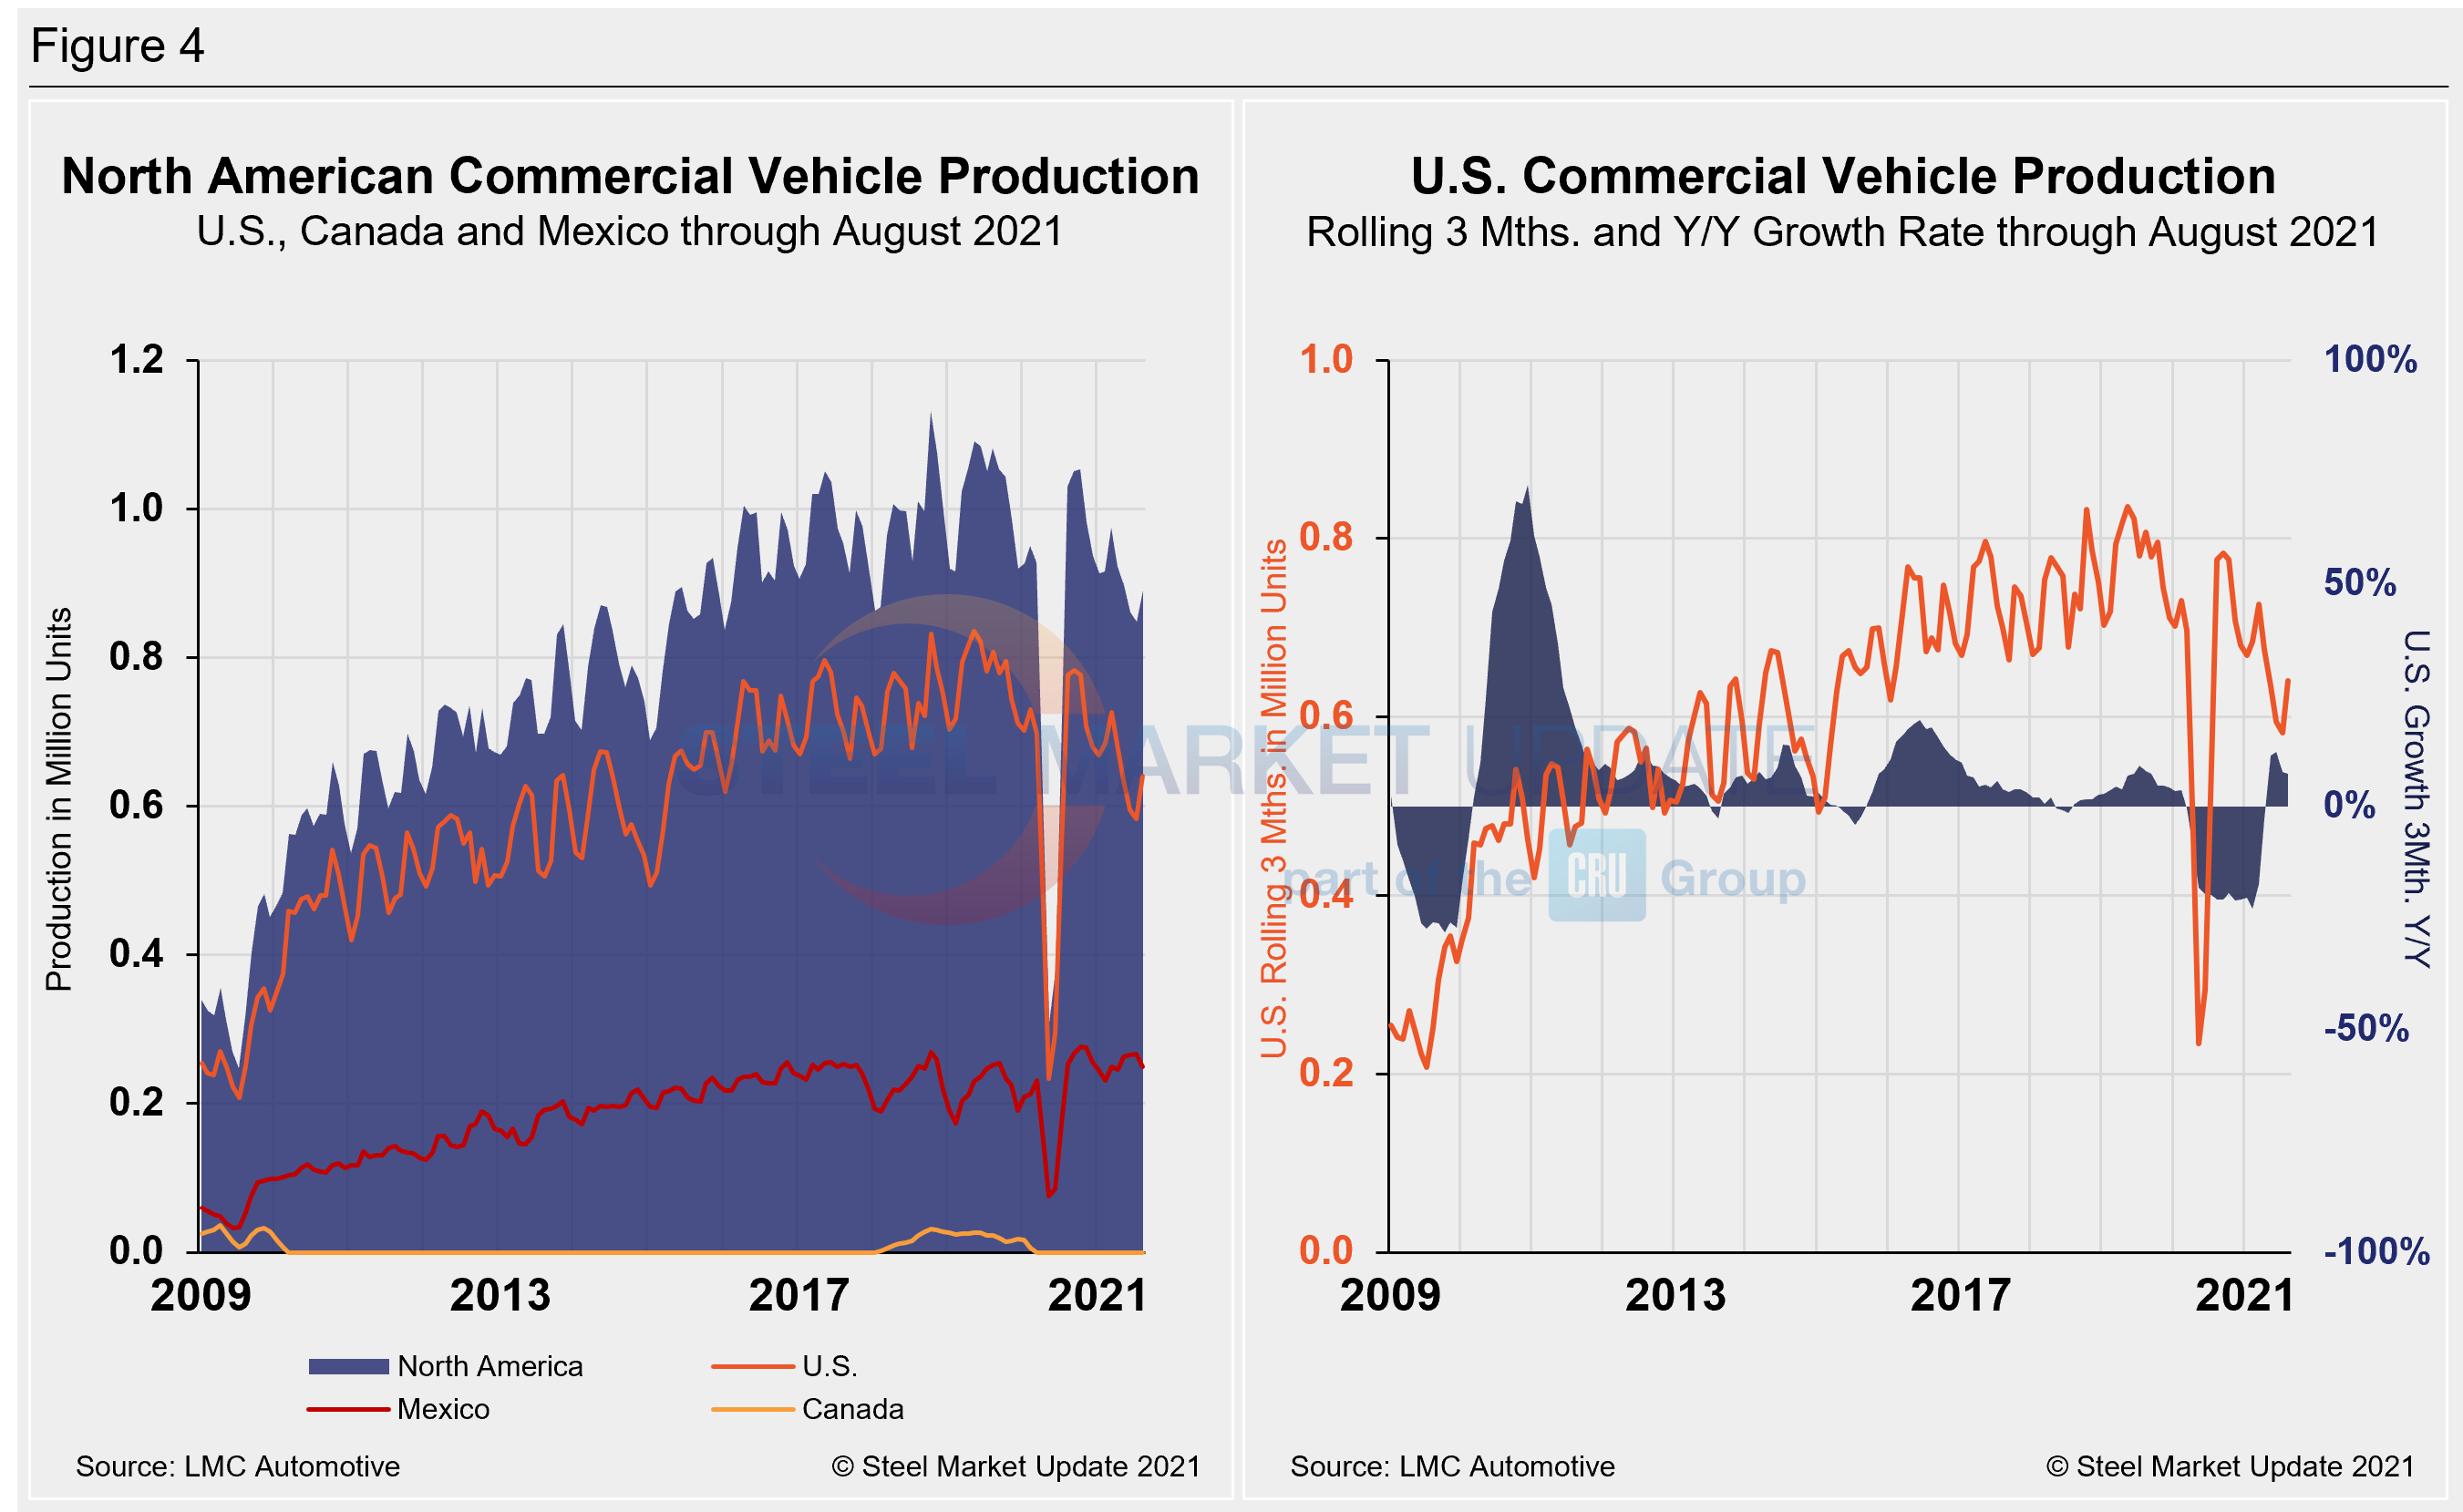
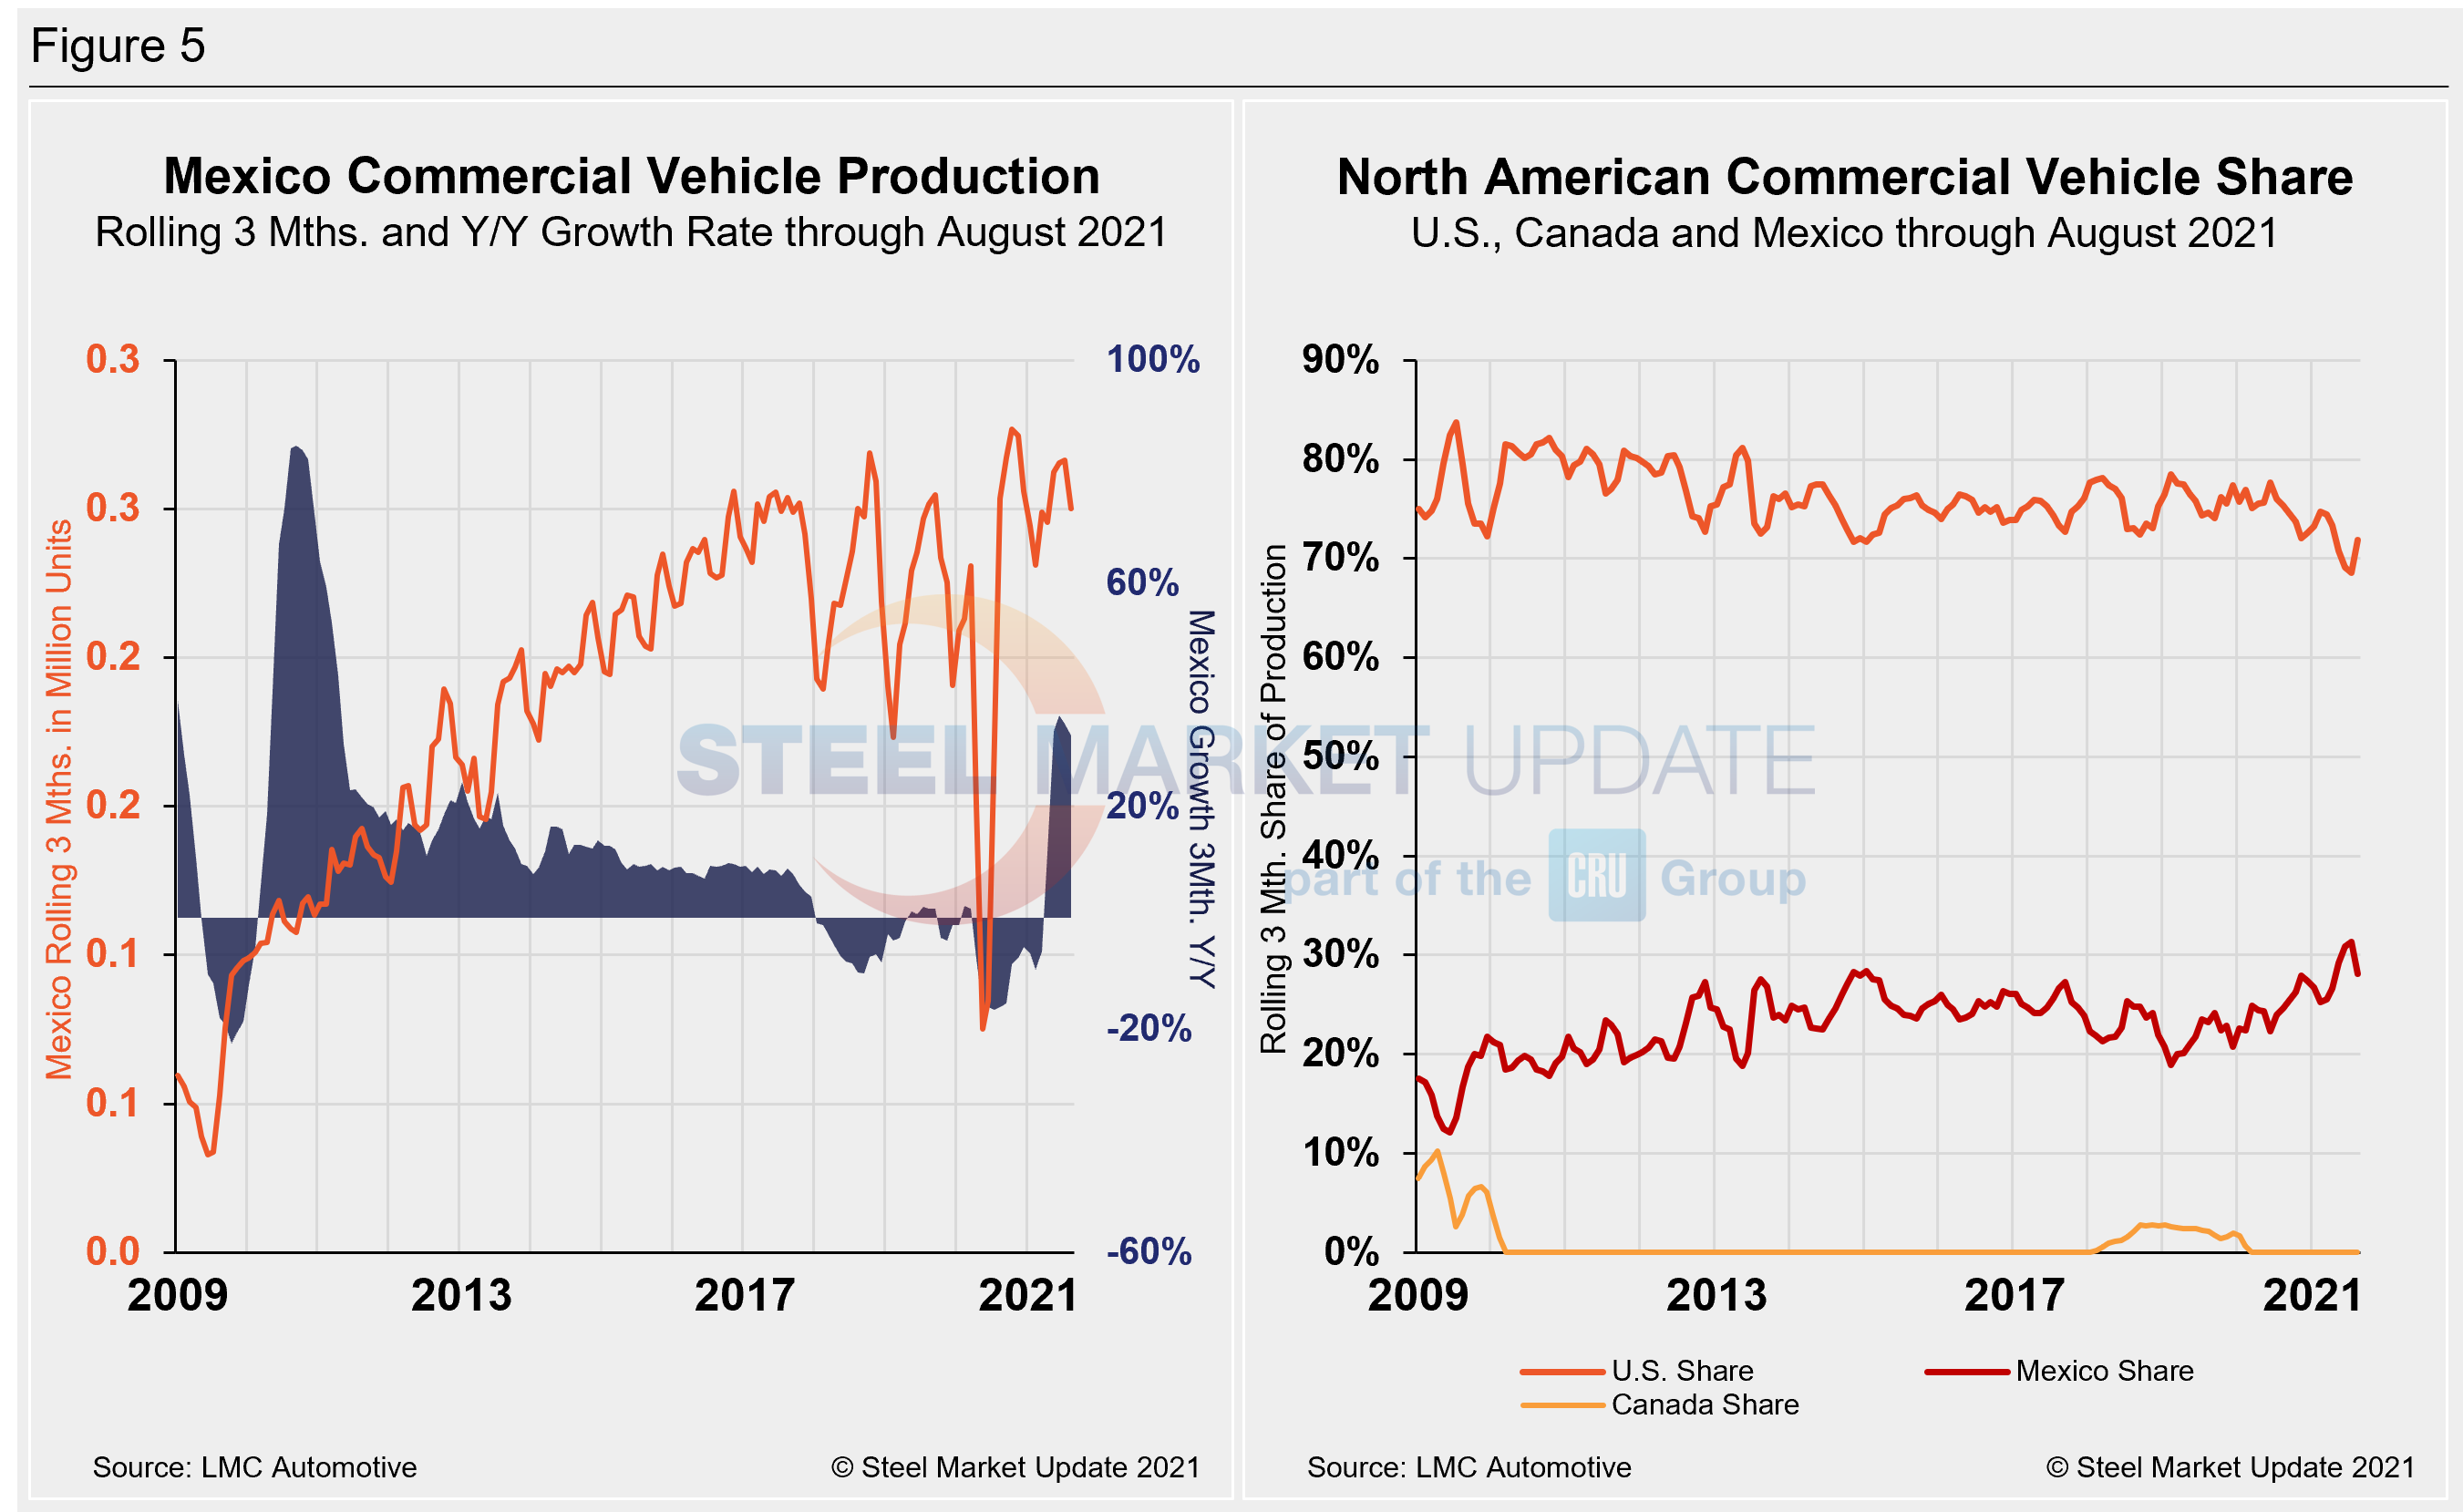
Total commercial vehicle production for North America and the total for each nation on a rolling three-month basis is shown below in the first chart in Figure 4, while the production of commercial vehicles in the U.S and the year-over-year growth rate is displayed in the second chart. Figure 5 shows the production of commercial vehicles and the year-over-year growth rate in Mexico displayed in the first chart, while the second chart shows the production share for each nation. Note that Canada has not produced a single commercial vehicle over the past 20 consecutive months.
North American commercial vehicle production was up 23.8% in August compared to the prior month. The month-on-month improvement was driven by a 40.2% recovery in the U.S., an addition of 69,765 units in August. Nevertheless, production limitations remain driven by the shortage of semiconductor chips and other supply-chain constraints.
While the U.S. rebounded in August when compared to the month prior, commercial vehicle production in Mexico dipped by 10.3%, down by 8,677 units during the same period. The annual growth rate is now -17.5% in the U.S. while Mexico’s commercial vehicle production growth rate is at -1.4% annualized. The U.S. share was 71.9% in August, up 3.3 percentage points when compared to the month prior. Mexico’s share fell 4.5 percentage points month on month to 23.6% in August, while Canada’s share remained at zero. Mexico currently exports just about 80% of its light vehicle production, while the U.S and Canada are the highest volume destinations for Mexican exports.
Editor’s Note: This report is based on data from LMC Automotive for automotive assemblies in the U.S., Canada and Mexico. The breakdown of assemblies is “Personal” (cars for personal use) and “Commercial” (light vehicles less than 6.0 metric tons gross vehicle weight rating; heavy trucks and buses are not included). In this report, we describe light vehicle sales in the U.S. and report in detail on assemblies in the three regions of North America.
By David Schollaert, David@SteelMarketUpdate.com


