

Analysis

October 5, 2021
CPIP Data: Construction Spending Plateaus in August
Written by David Schollaert
The U.S. construction sector was virtually unchanged in August, as spending was largely flat for a second straight month. Increase in public sector projects was offset by weakness in the private sector, the Commerce Department reported.
Supply chain disruptions, rising materials prices and labor shortages continue to keep the construction sector captive. The trend has led to just marginal changes when compared to the prior year, when construction was significantly hindered by COVID-related disruptions.
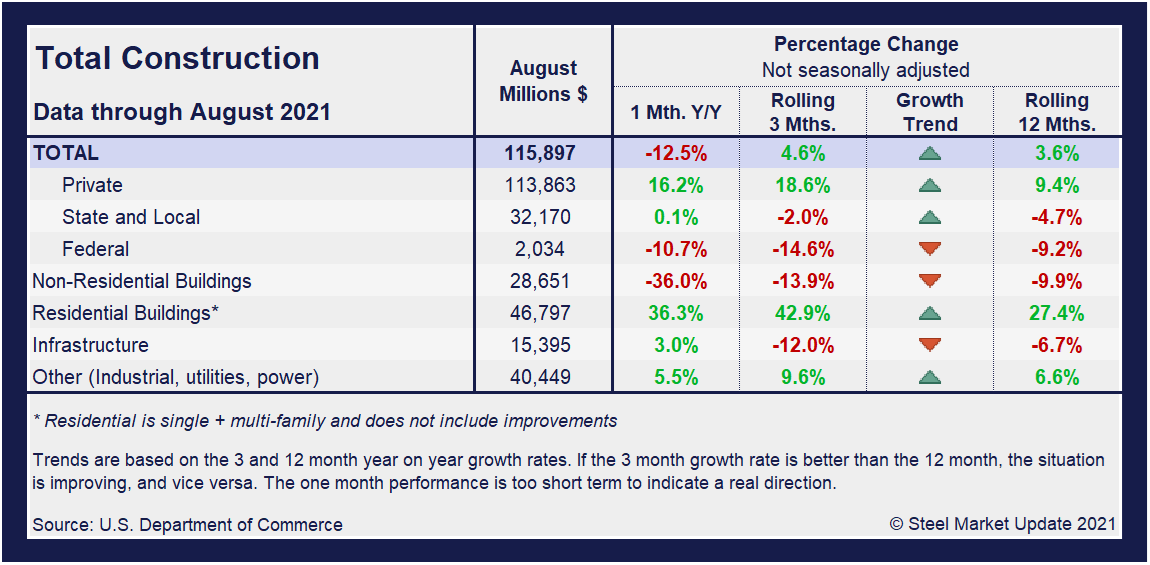
Total construction spending during August, at a seasonally adjusted annual rate, was $1.584 trillion, unchanged when compared to July’s revised pace of $1.584 trillion, reported the U.S. Census Bureau. Construction spending, which accounts for roughly 4% of U.S. gross domestic product, grew by 8.9% on a year-on-year basis in August following a 9.0% jump in July. Year-to-date, construction spending was $1.035 trillion, up 7.0% versus 2020, a frustrating result as the domestic marketplace is now more than a year removed from the worst of the pandemic.
Both the private and public sectors were largely static across the domestic construction industry, driving little growth. Residential construction spending, at a seasonally adjusted annual rate, was $786.6 billion in August, 0.4% above the revised July estimate of $783.5 billion. Nonresidential construction was $455.6 billion in August, seasonally adjusted, 1.0% below the revised July estimate of $460.2 billion.
The apparent stagnation is being driven not only by supply-chain constraints and labor shortages, but also by a decrease in infrastructure spending, according to the Associated General Contractors of America. “Nearly every nonresidential spending segment has deteriorated from already inadequate 2020 levels in the first two-thirds of this year,” said Ken Simonson, AGC’s chief economist. “Meanwhile, soaring materials costs mean that fixed public budgets buy even less infrastructure than before.”
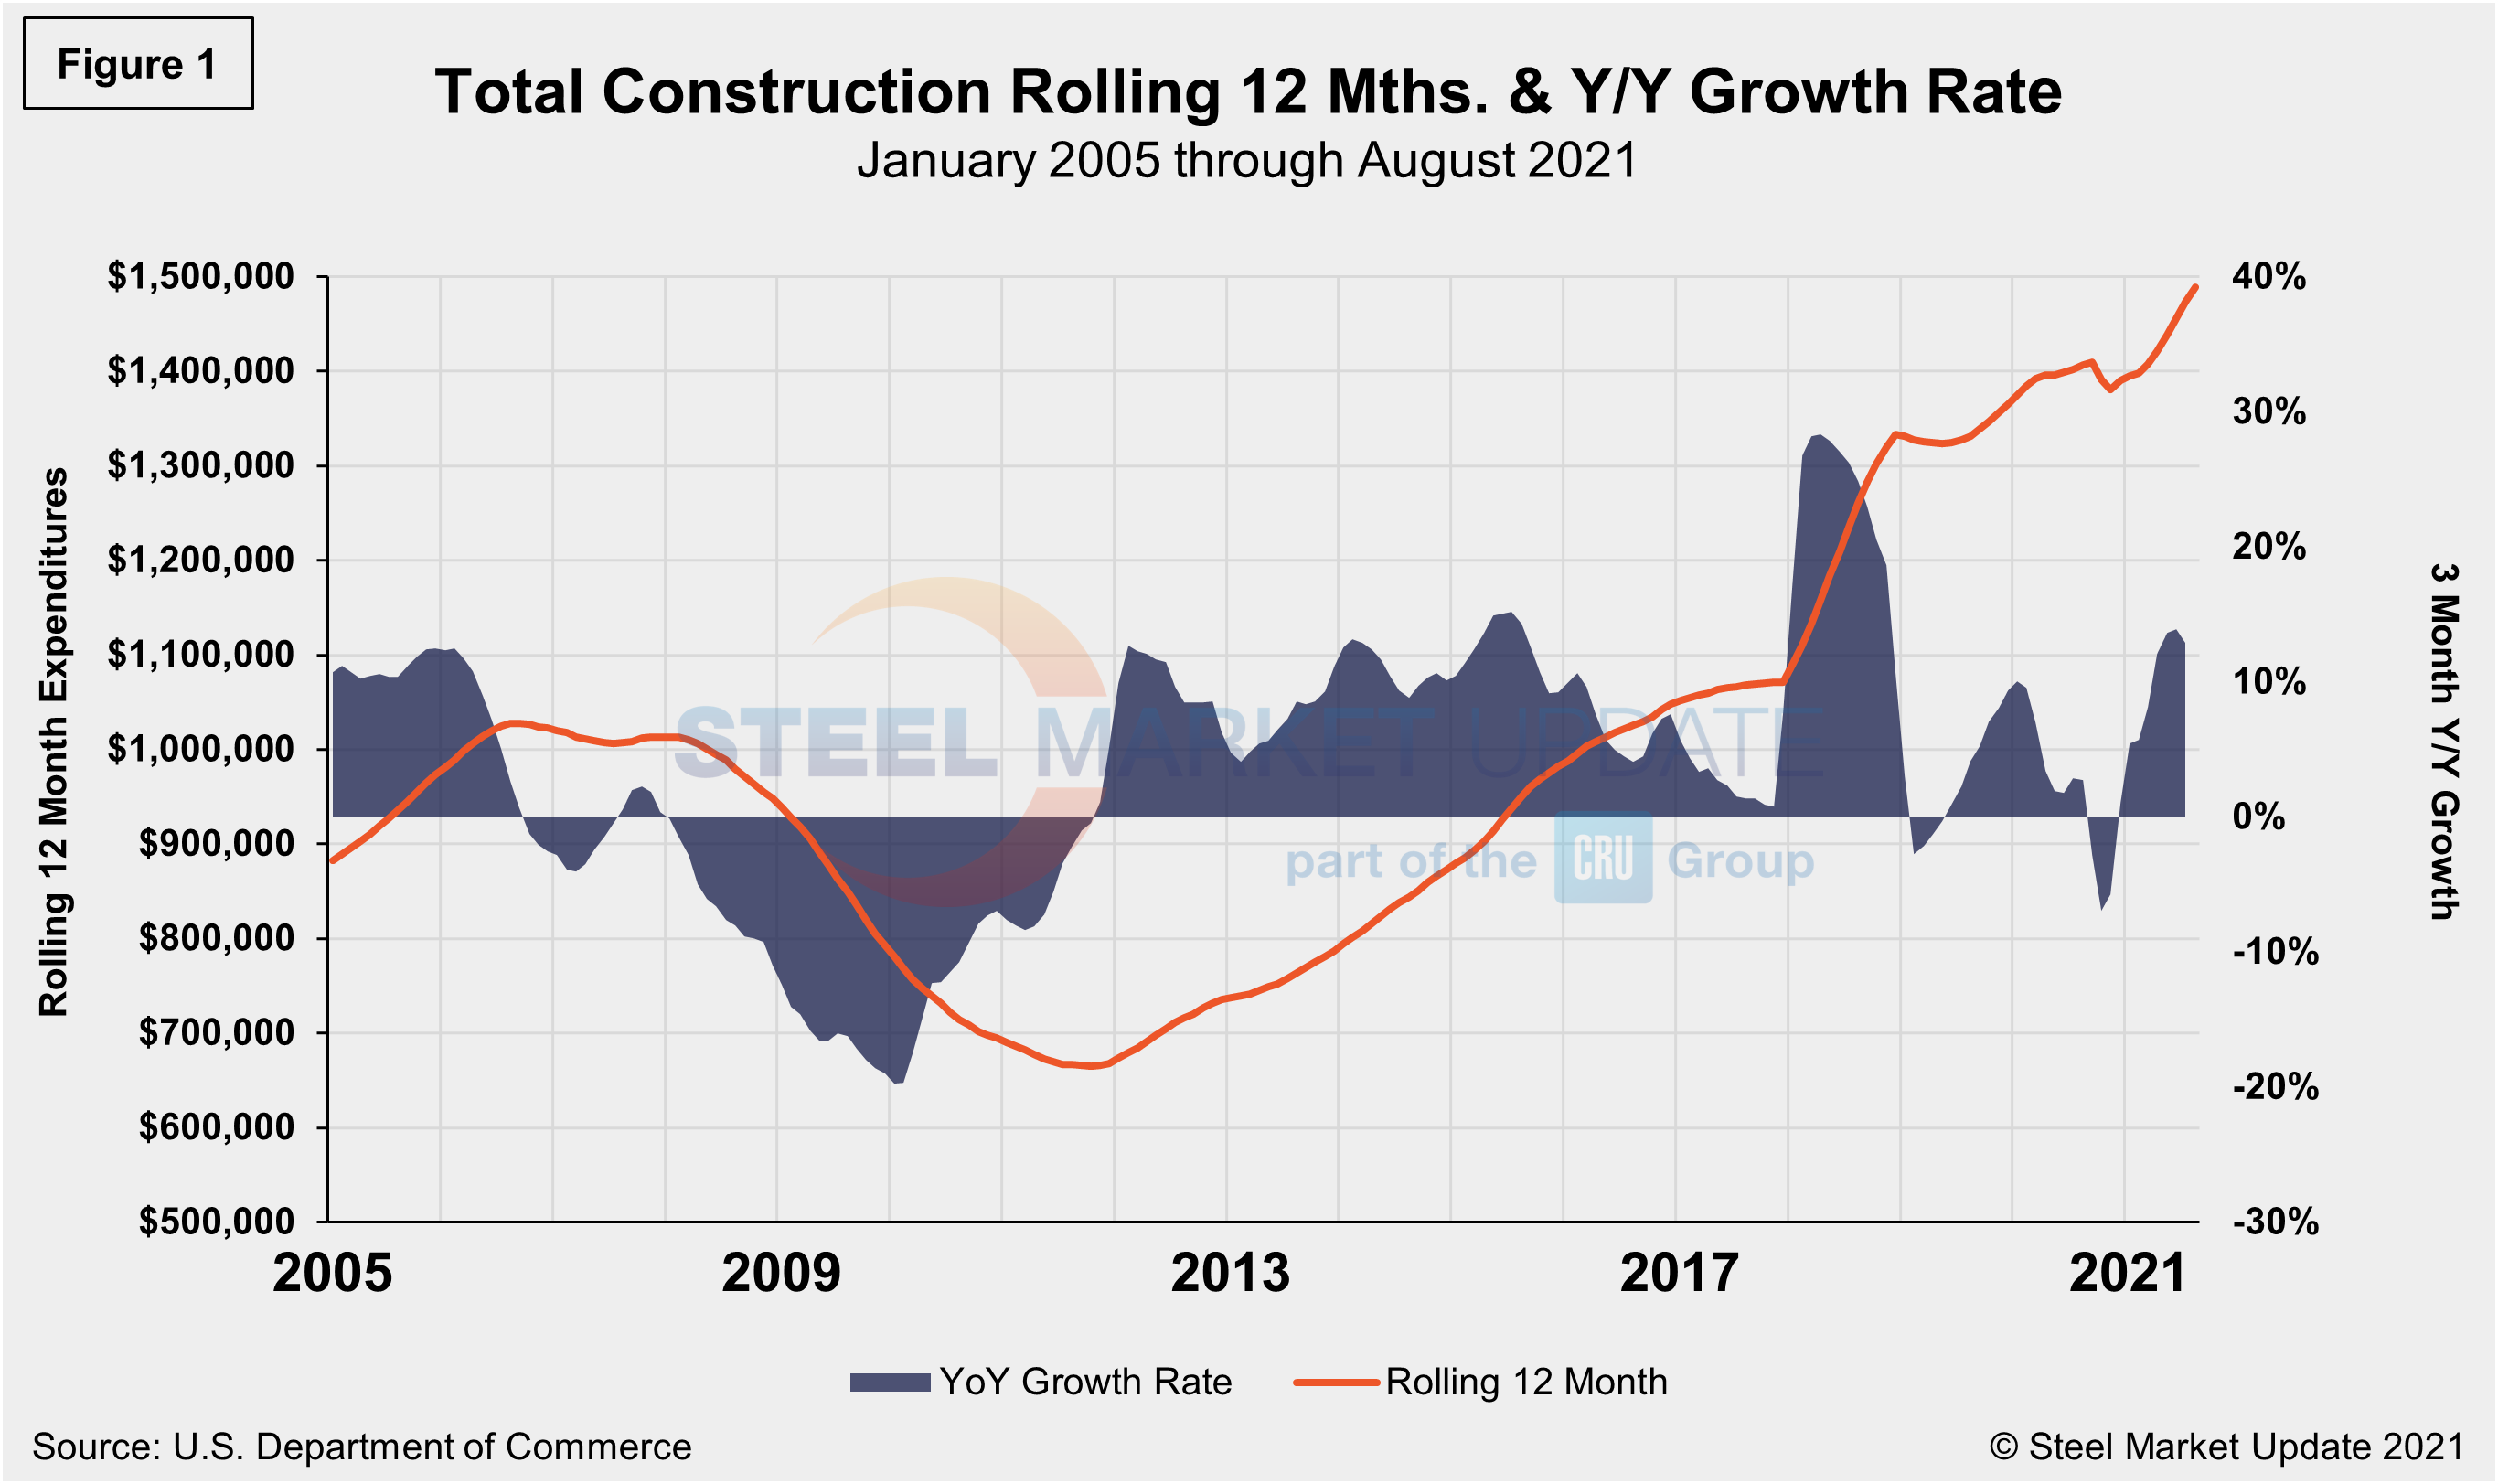
Total construction expenditures and its major categories are shown in the table and chart (Figure 1) below.
Private Construction
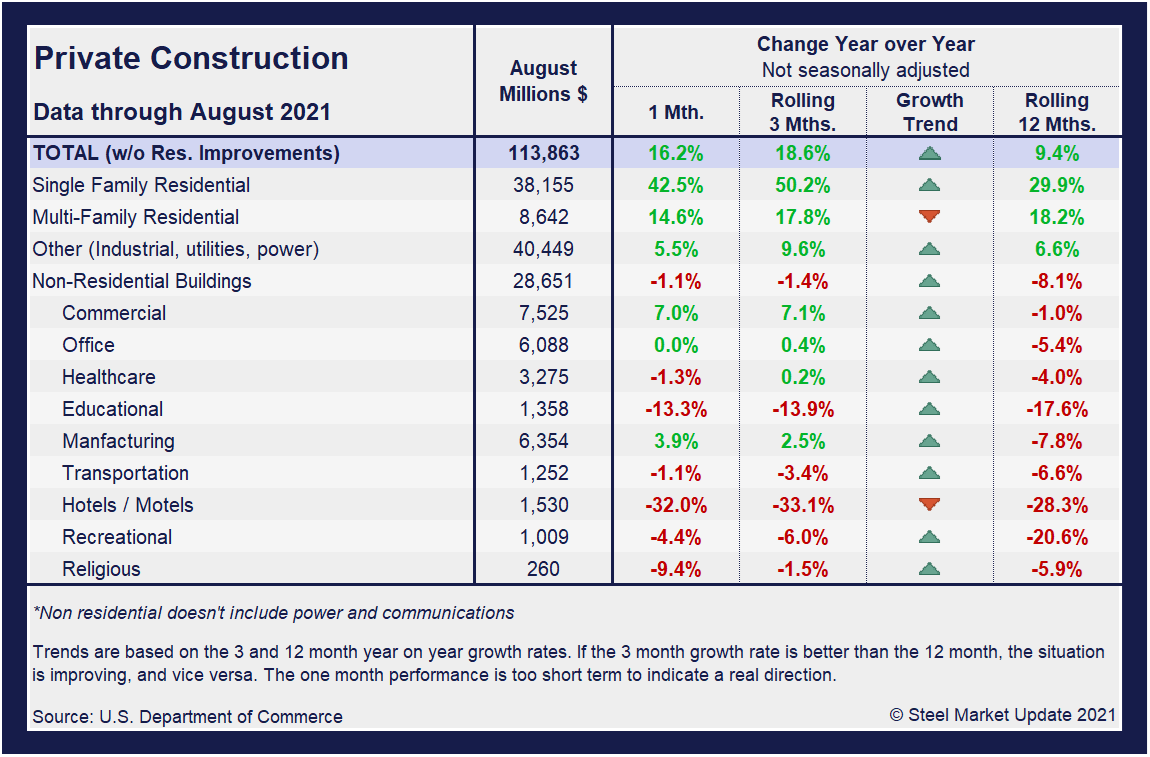
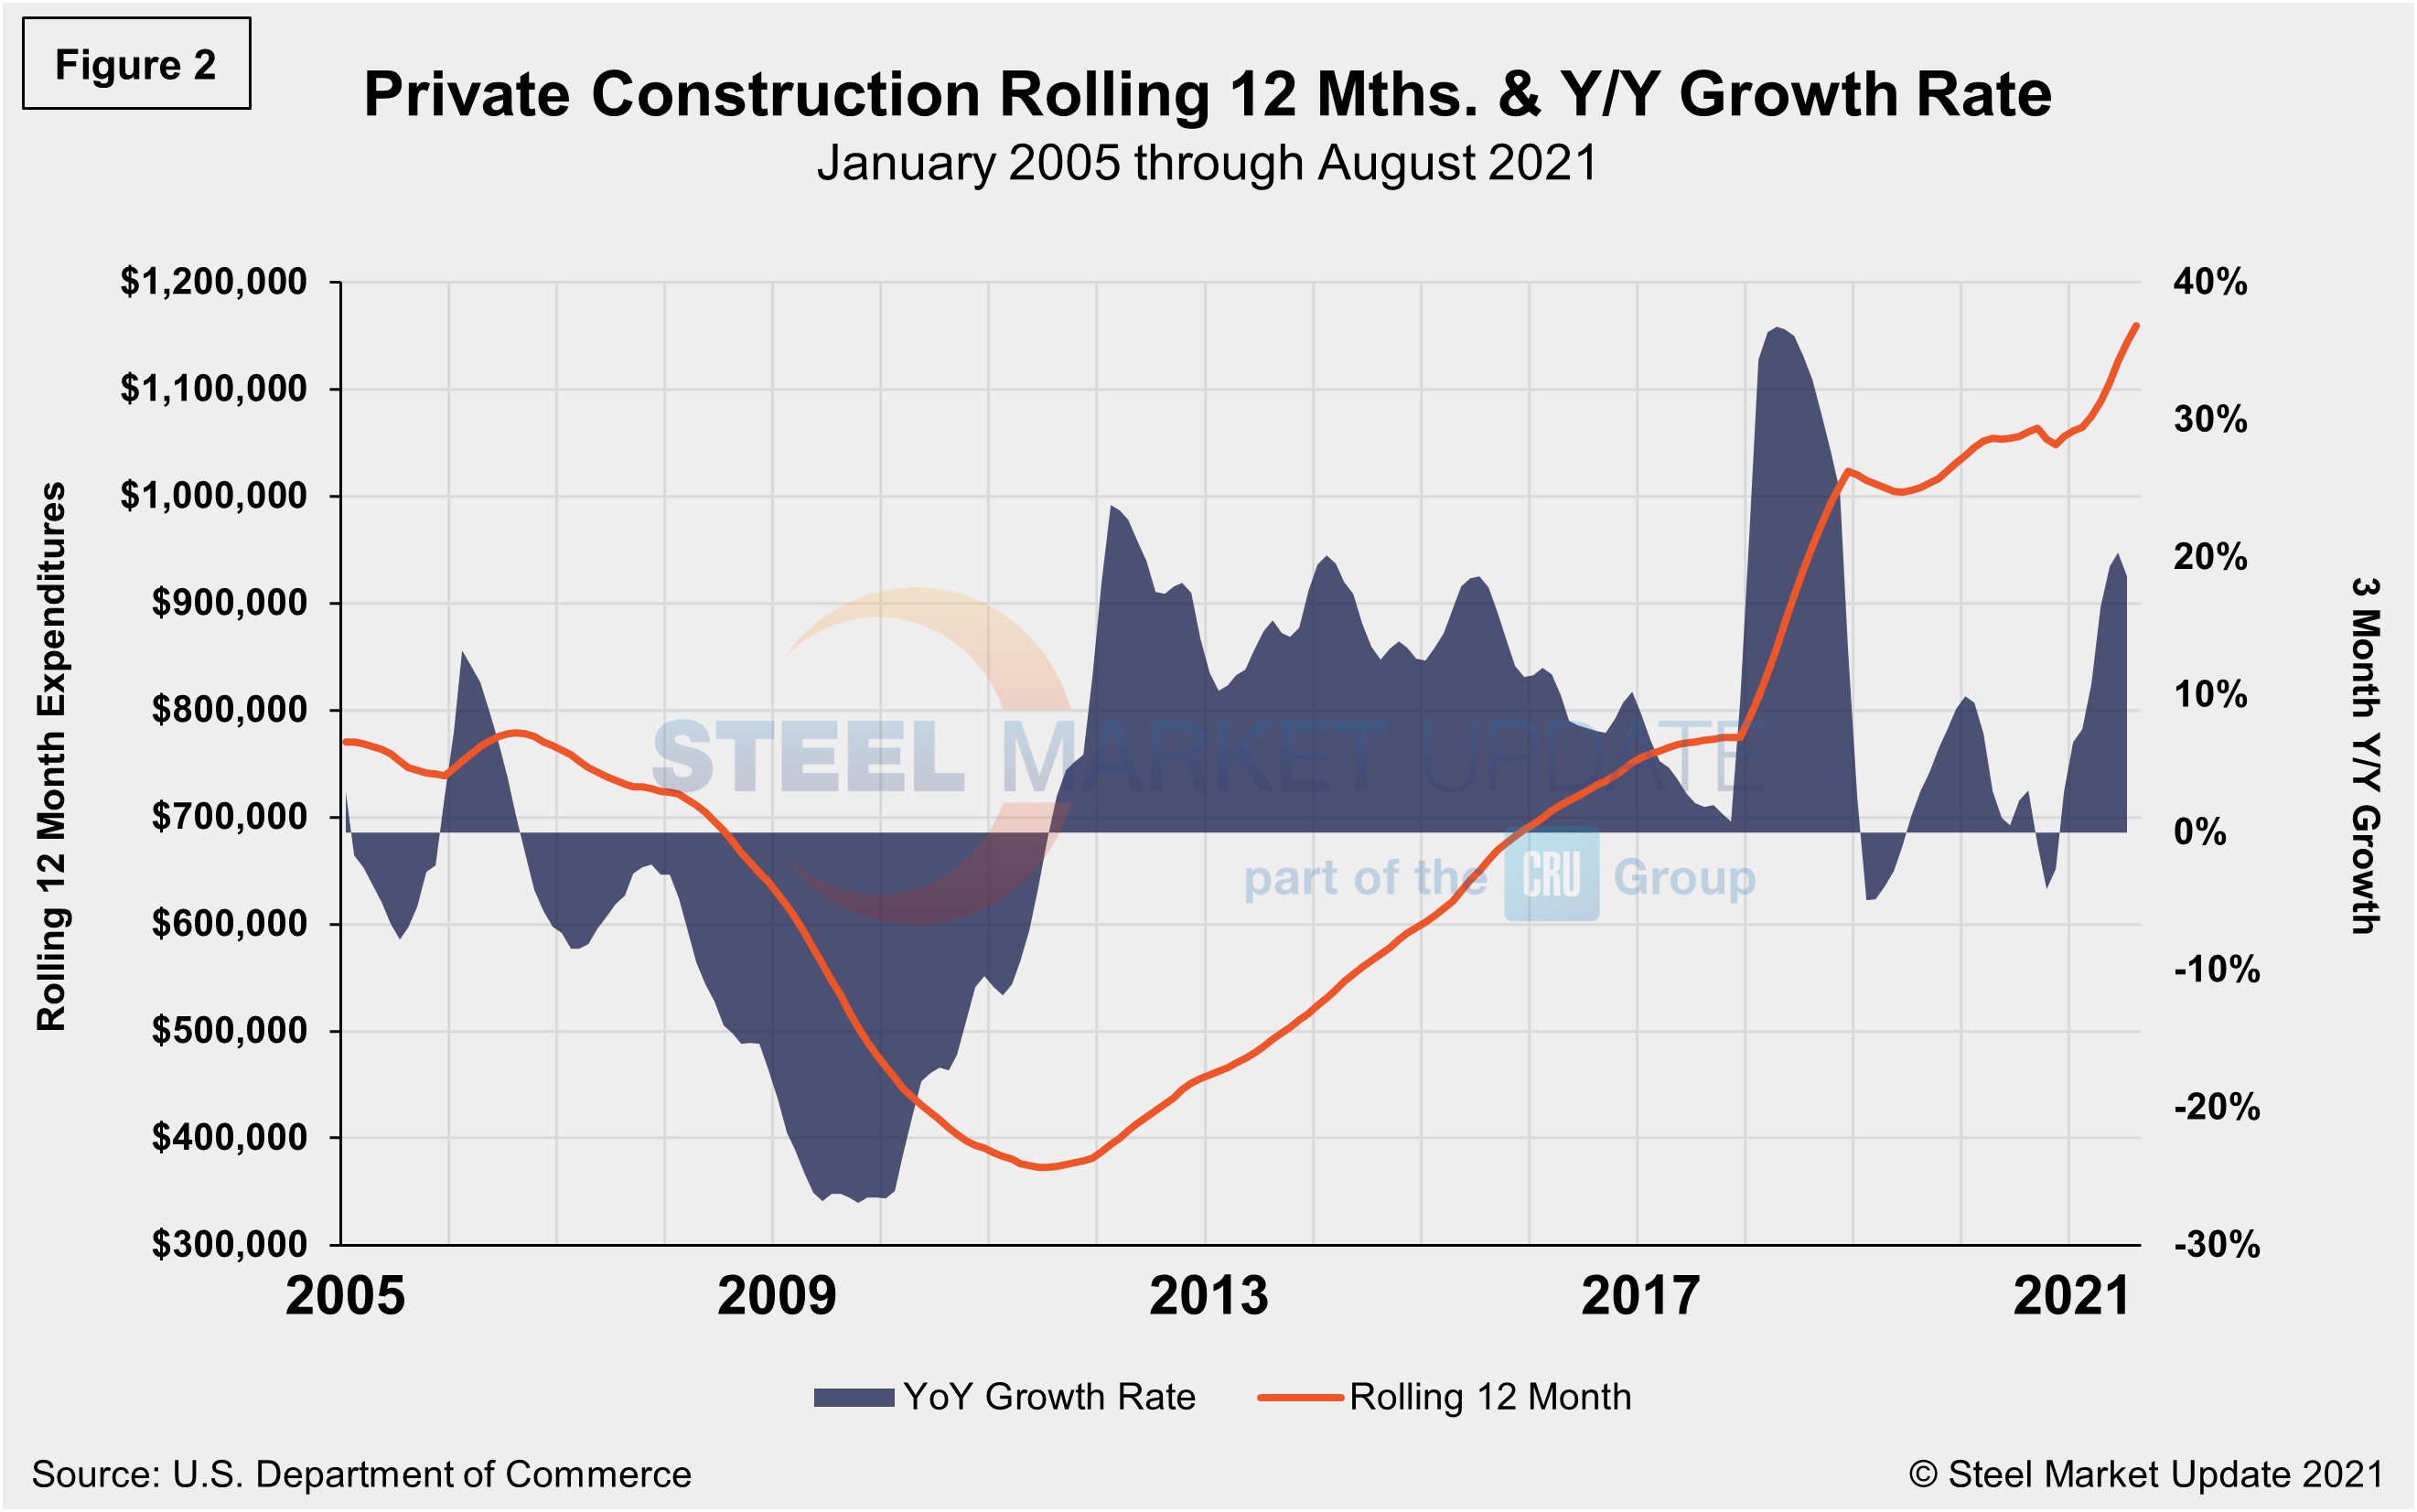
The breakdown of private expenditures into residential and nonresidential and their subsectors are highlighted in the table below. Private construction spending increased 16.2% year over year to an annual rate of $1.242 trillion. Within that category, private residential construction spending rose 36.3% annually while private nonresidential saw the complete opposite, falling 36.0%.
Spending on private construction projects was up 1.7% month on month, after increasing 1.0% in July. Outlays on residential projects advanced 1.2%, with single-family homebuilding spending increasing 0.9% and multi-family homebuilding spending accelerating by 2.3%, driven by robust demand for housing. The pace is still slowing, however, because of expensive building materials as well as land and labor shortages.
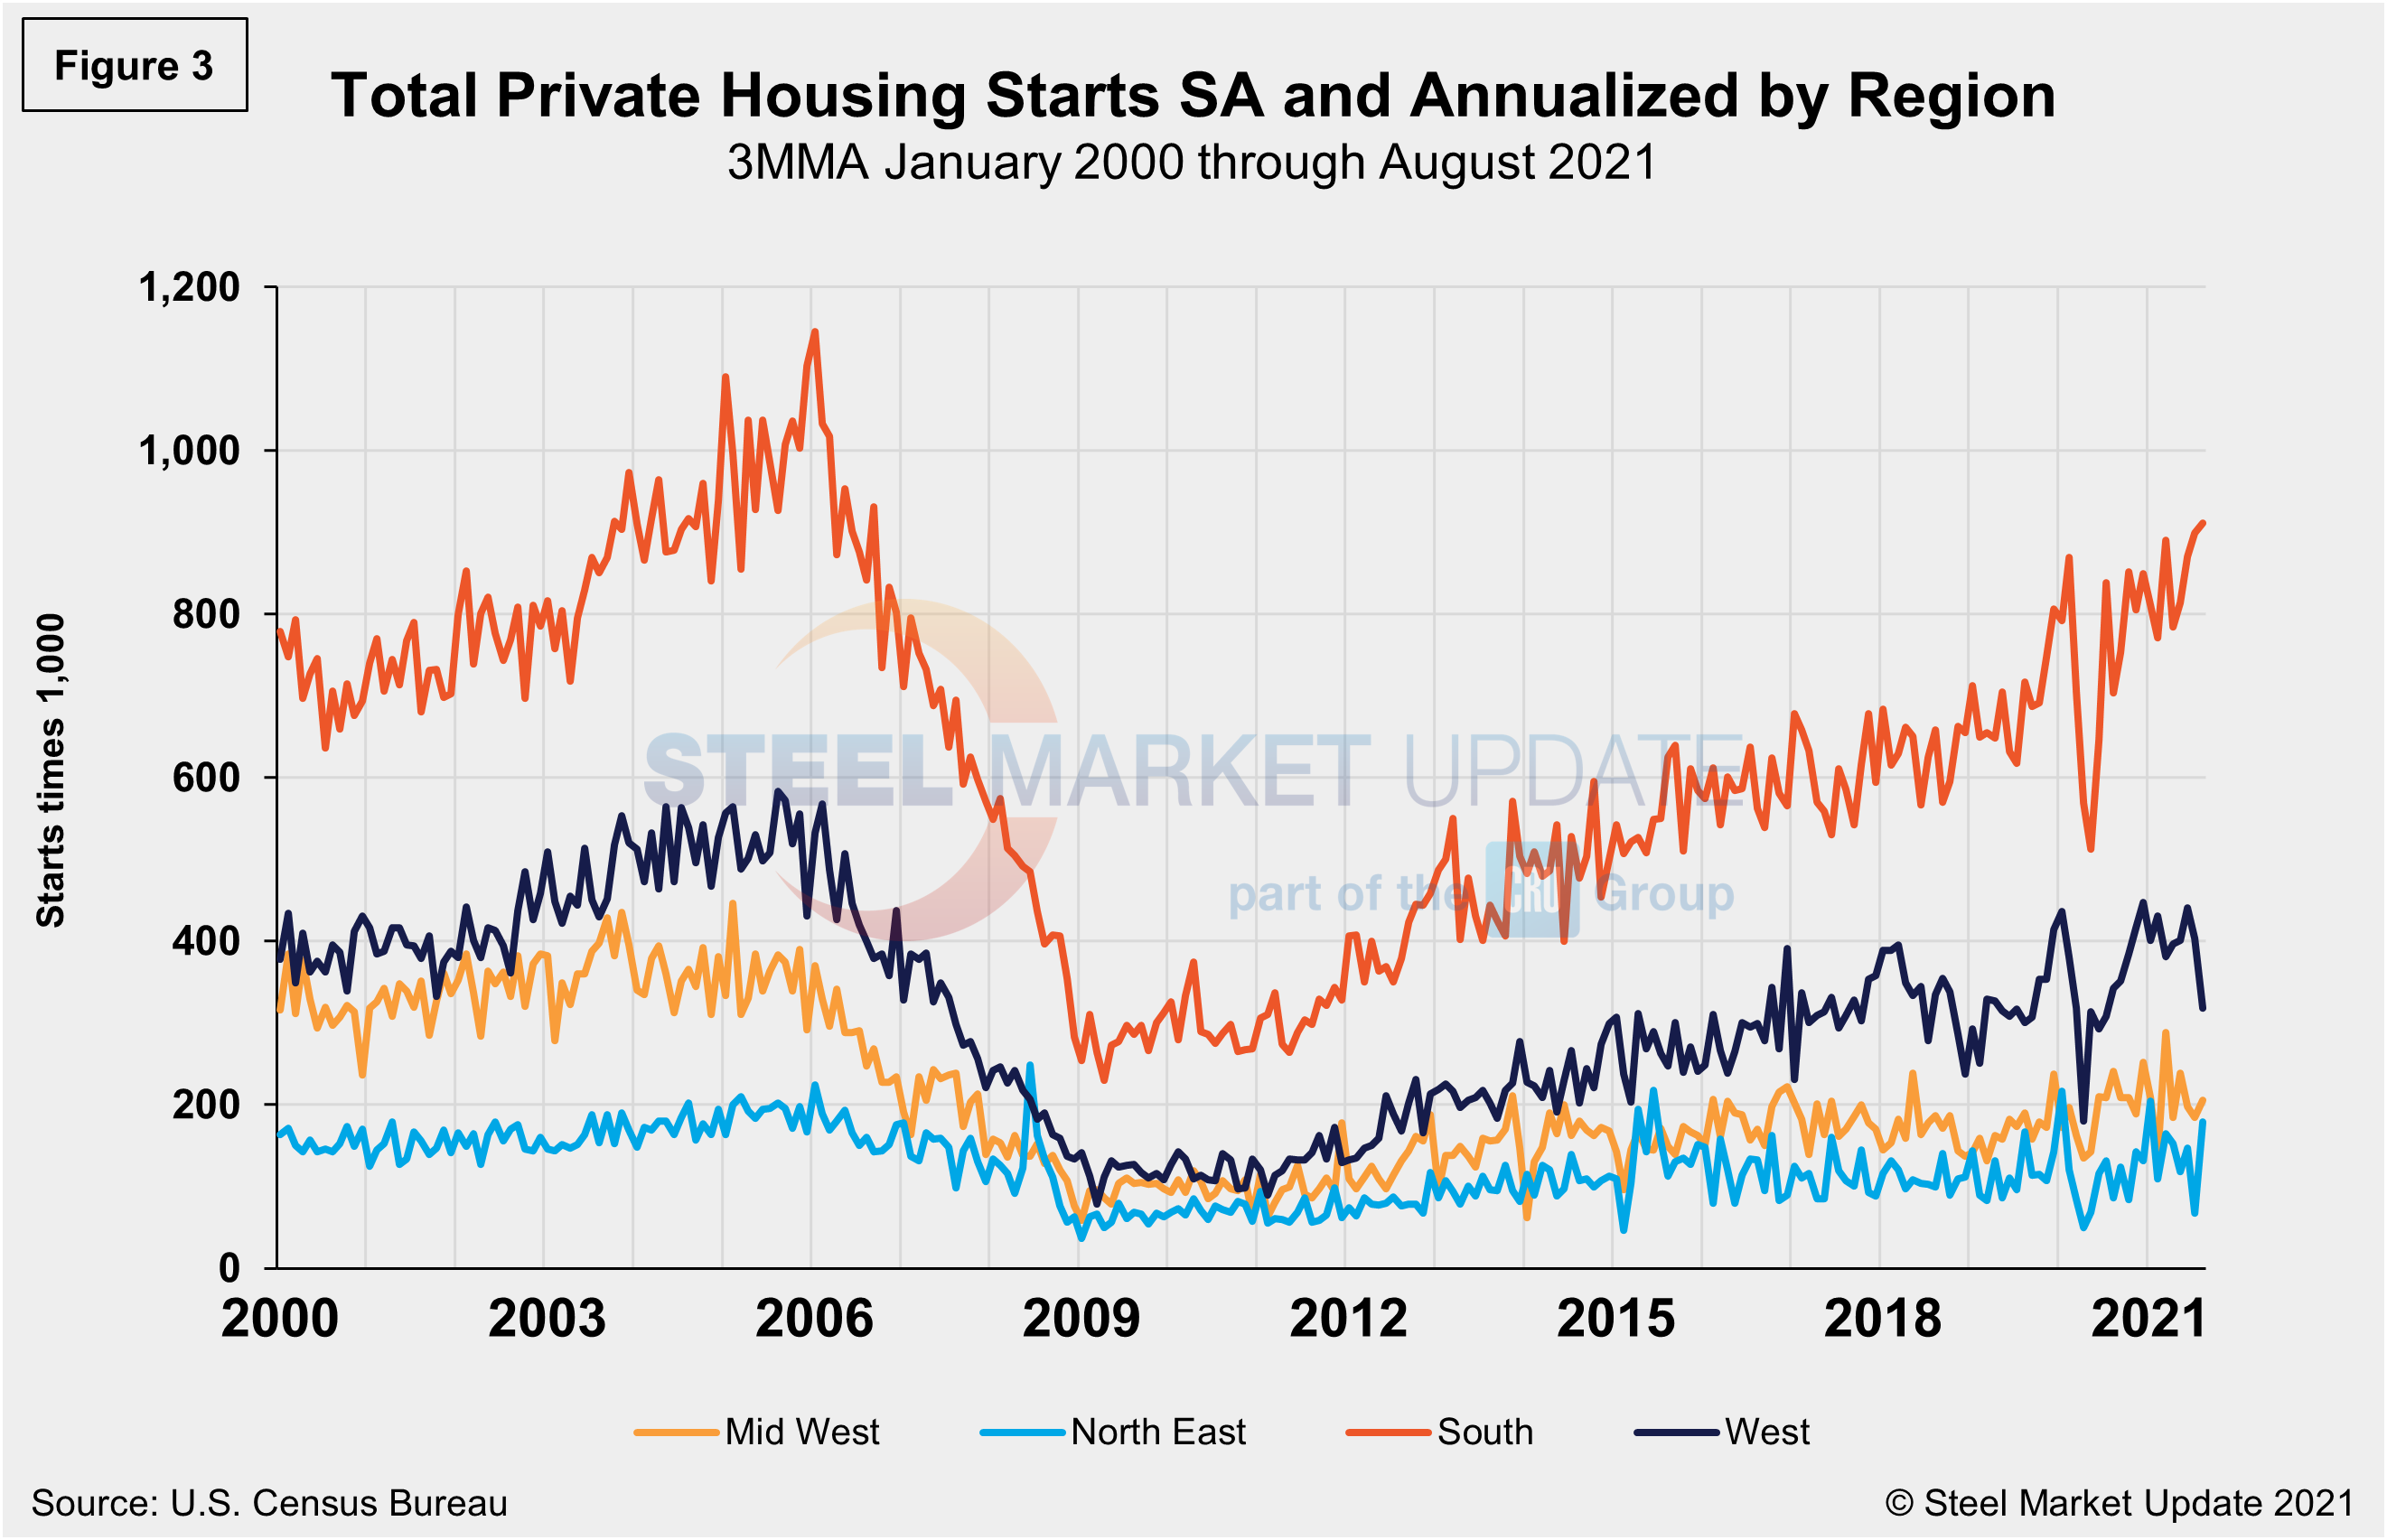
Total housing starts in the four regions are displayed below (Figure 3). Privately‐owned housing starts in August were at a seasonally adjusted annual rate of 1.615 million, up 3.9% from the revised July estimate of 1.554 million. The increase details the strong demand for residential construction despite the continued supply chain disruptions, rising materials prices and labor shortages impacting the sector. August’s rate is 17.4% above the year-ago rate. Single‐family housing starts in August were at a rate of 1.076 million, down 2.8% from the revised July figure of 1.107 million. August’s total is also down by 28.9% from the peak of 1.823 million seen in January 2006.
The South region continues to be the strongest for housing starts at 912,000 in August, besting the West—the second-place region—by nearly three times. The Northeast continued to trail the other three regions with just 179,000 starts in August, but was its highest total since January. All four regions were directly impacted by the widespread COVID-19 shutdowns last year, causing housing starts to fall sharply. Since then, they have recovered to pre-pandemic levels, but have seen recent decreases due to supply-side limitations and rising material costs.
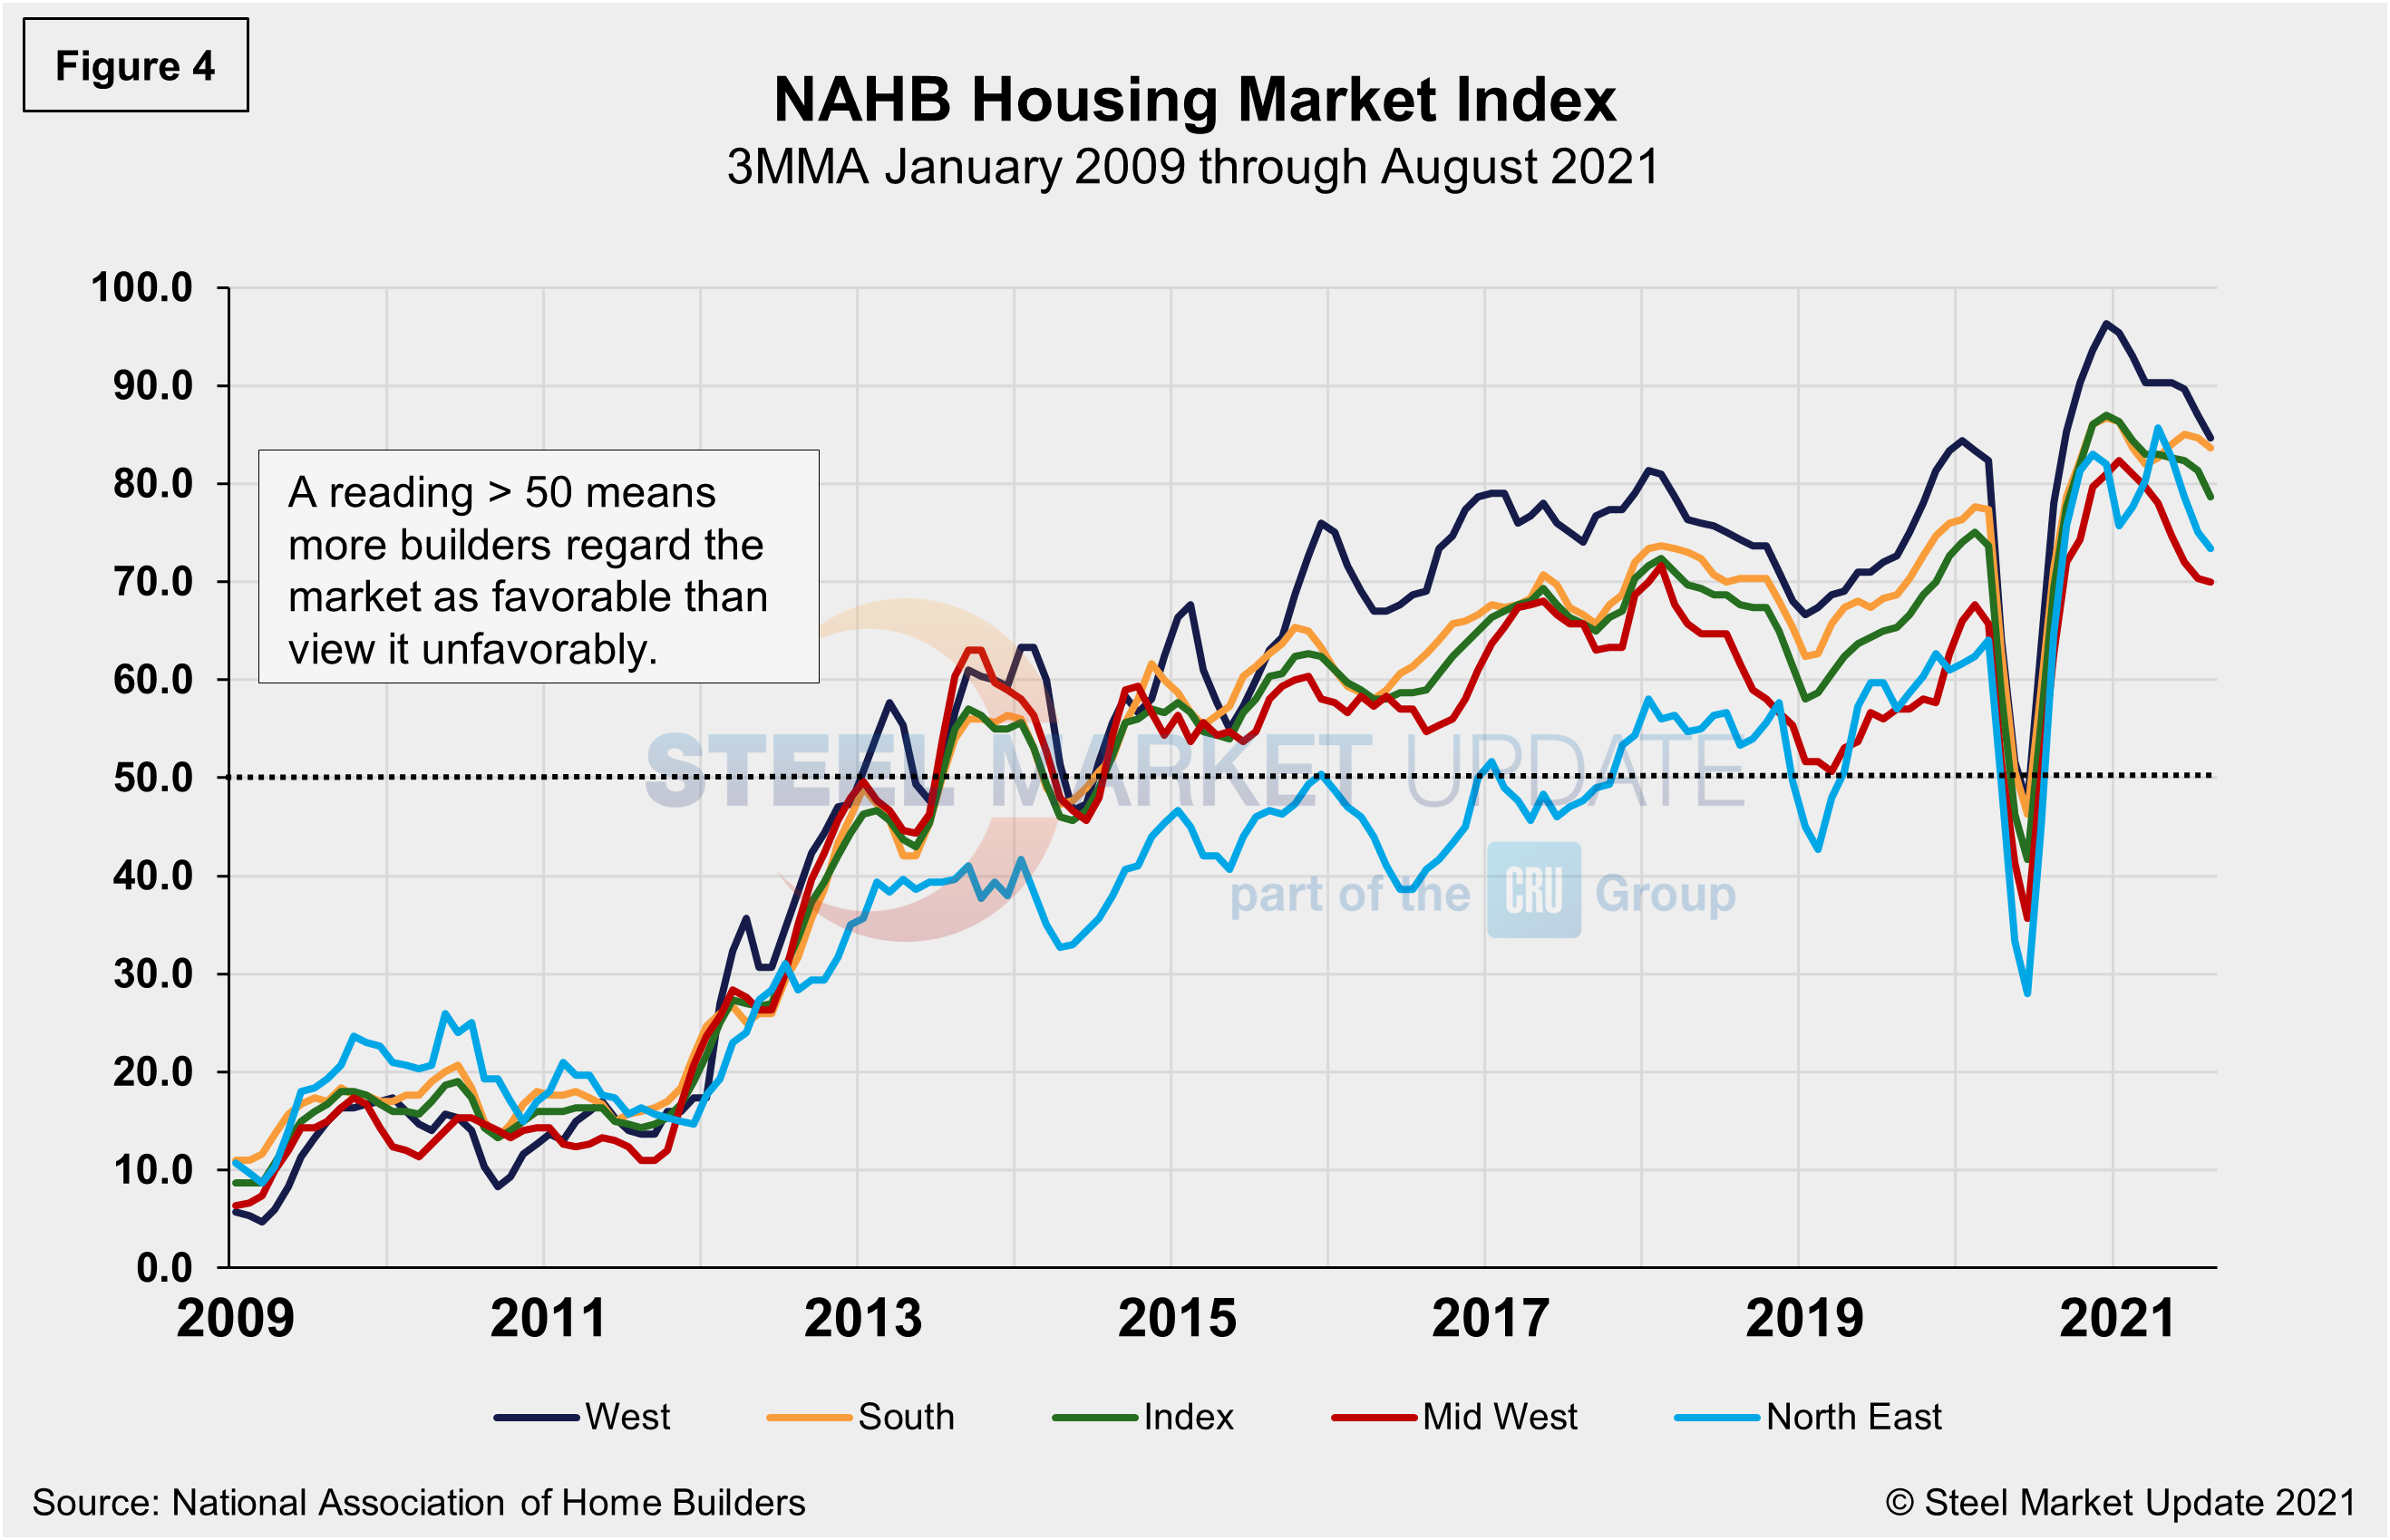
The National Association of Home Builders Optimism Index plummeted in April 2020 at the onset of COVID-19, but then recovered from May through December last year. Since the beginning of 2021, optimism among home builders has wavered up and down within a small range, but has been waning of late due to the high costs of lumber and other building materials and the shortage of skilled labor. The index registered 75 in August, down for the third straight month, and down from 80 the month prior. Advanced reports indicate that the index may slip further in September (Figure 4).
State and Local Construction
Public construction inched up at an annual rate of 0.5% or $341.9 billion, nearly matching the revised July estimate of $340.3 billion. Seasonally adjusted, educational construction’s annual rate was $79.8 billion, or 1.1% above the revised July estimate, while highway construction was $98.3 billion, or 1.6% percent higher than the prior month. Outlays on state and local government construction projects increased 0.8%, but federal government spending dropped 4.6%.
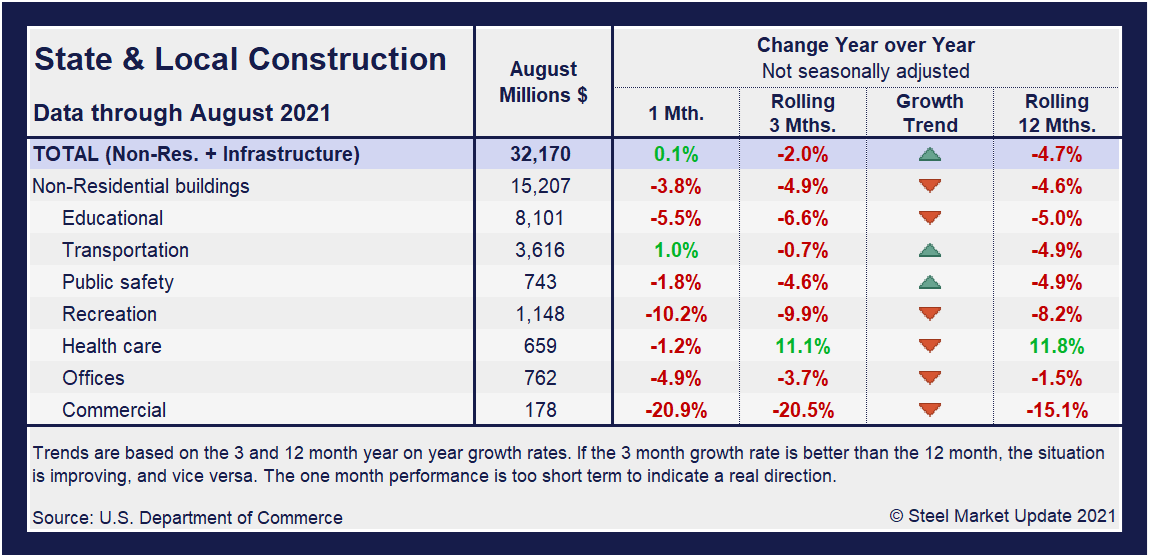
Construction expenditures on a state and local level remain the most impacted by the 17-month-long health crisis. Notably, on a year-on-year and rolling three-month basis, these construction categories and subcategories are still behind pre-pandemic levels – the sole exception being health care outlays – and in many cases trending down. The table below details a struggling sector where nearly three-quarters are still trending down.
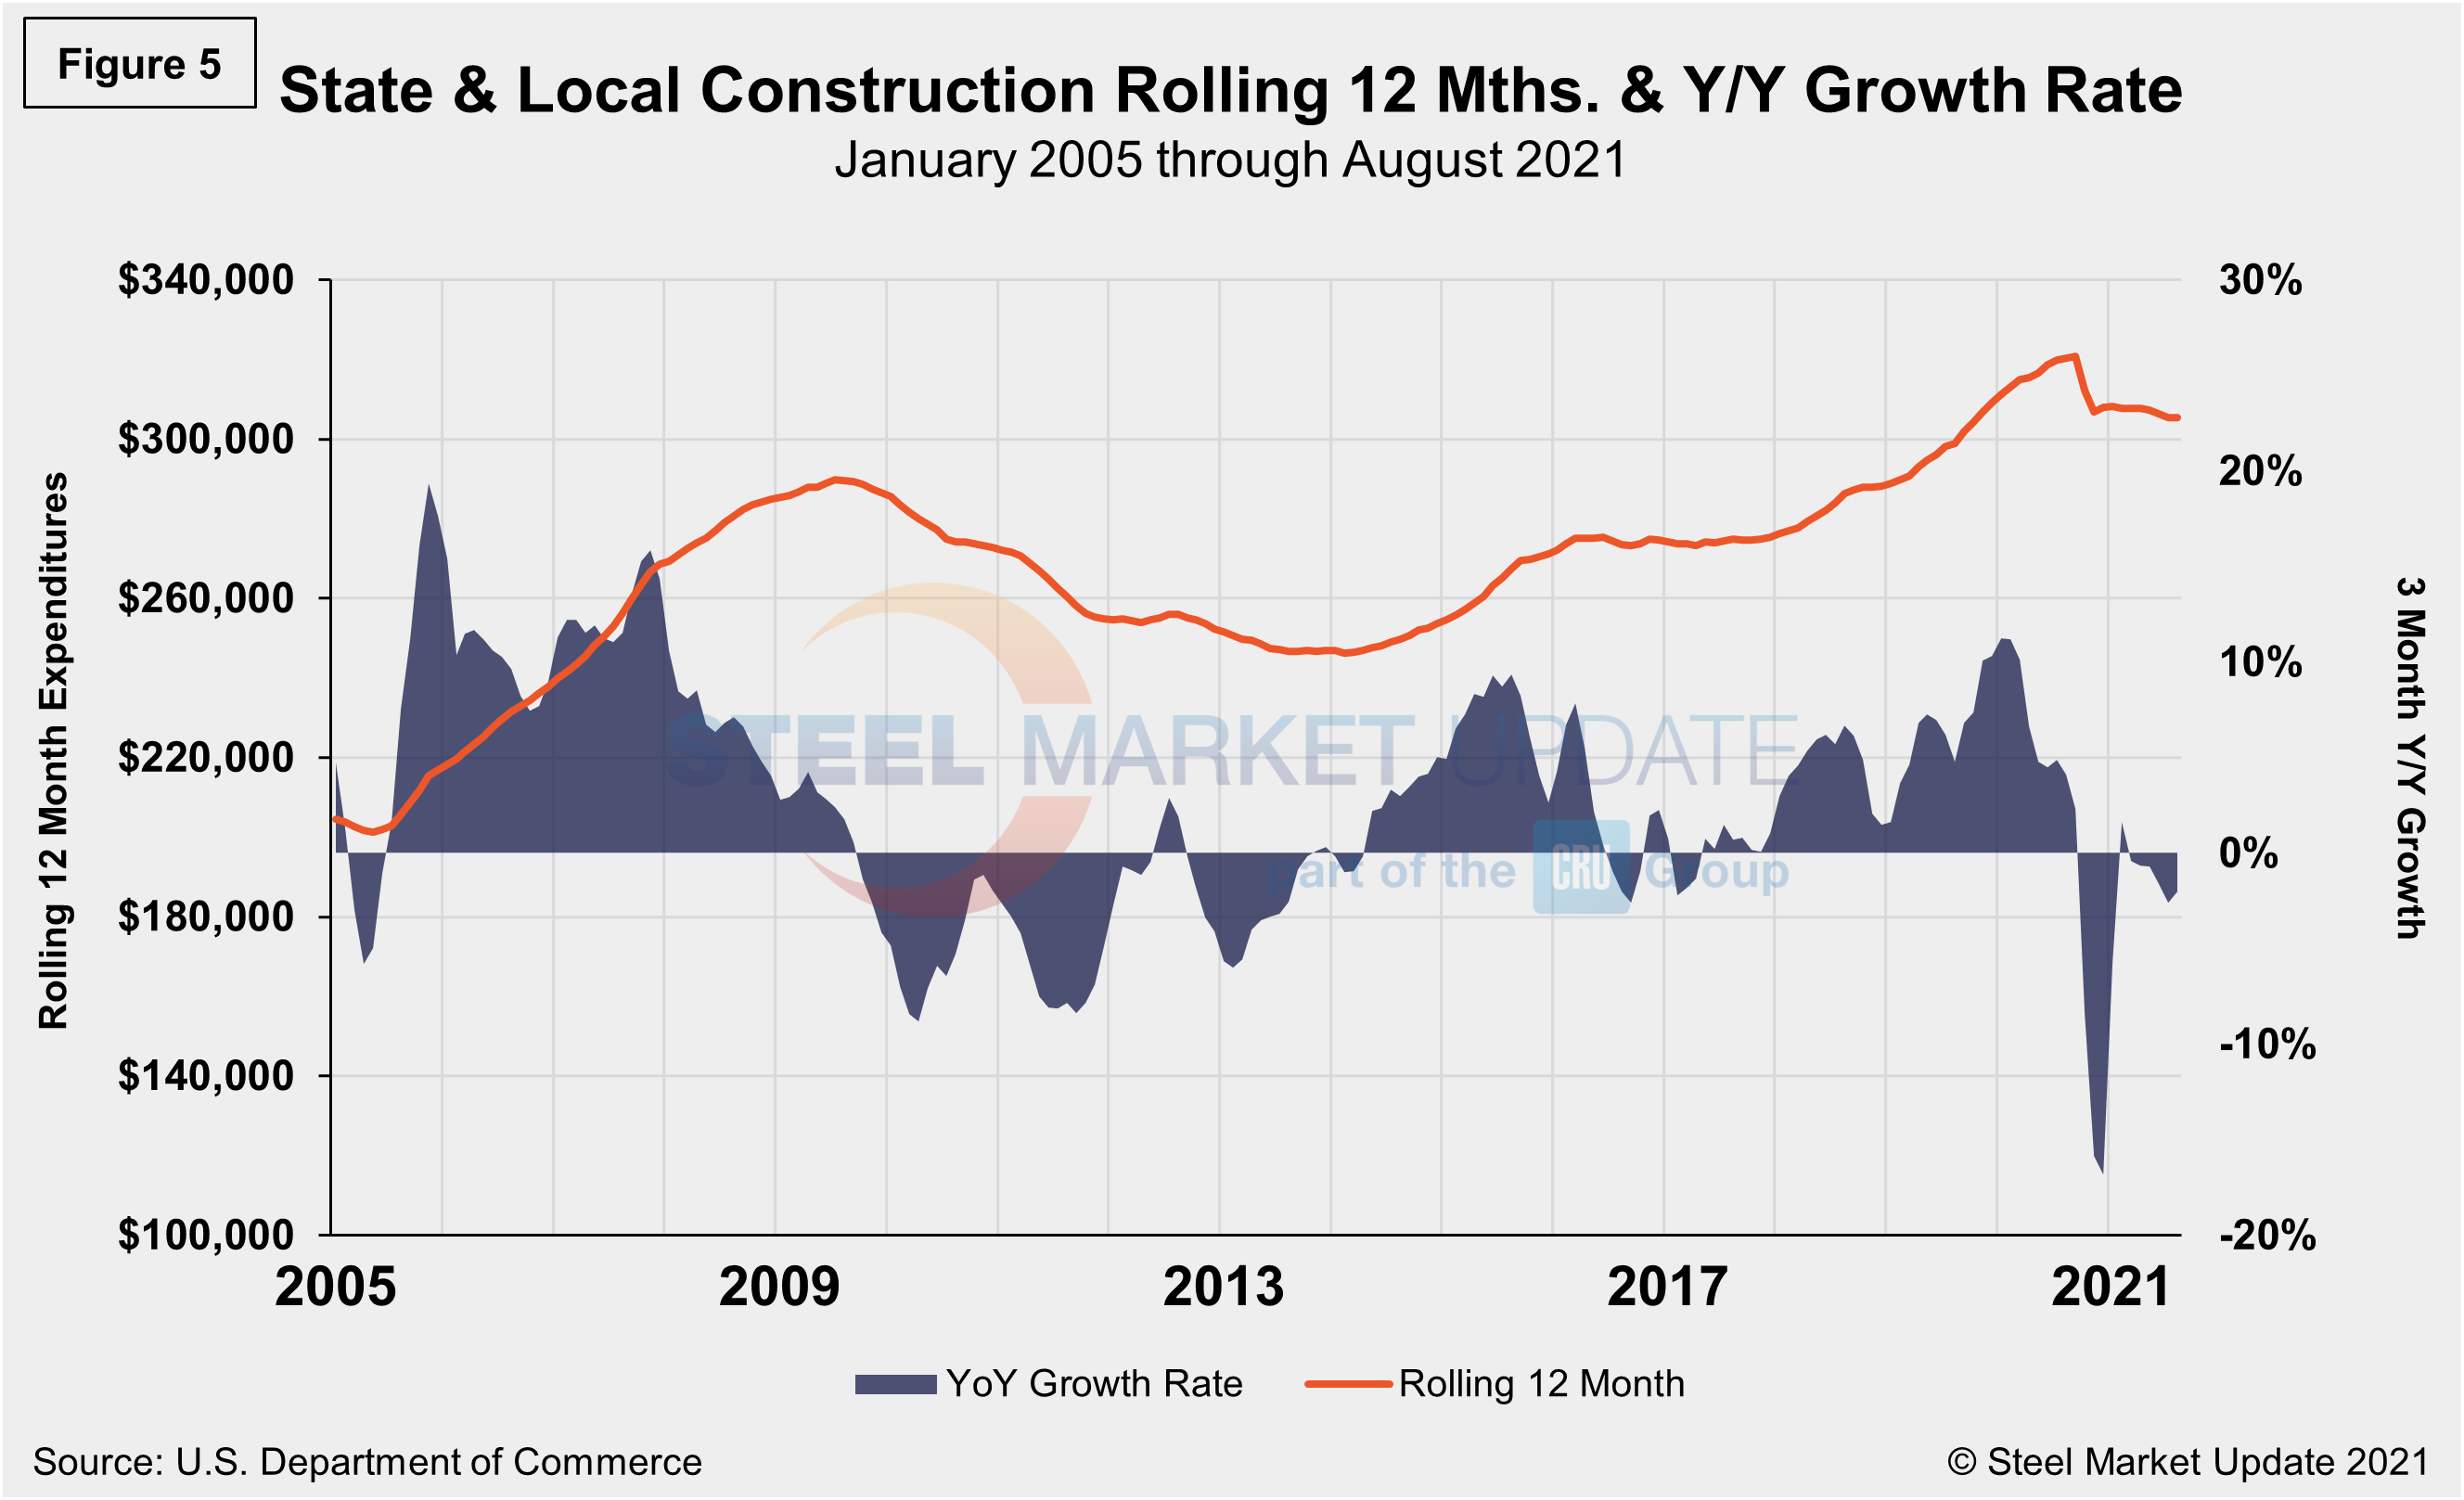
In three months through August, overall state and local construction was down 2.0%, a slight improvement from the month prior when the sector was down 3.3%. Transportation and public safety, although still lagging pre-pandemic levels, are the subcategories currently trending up. Figure 5 shows the history of total S&L expenditures.
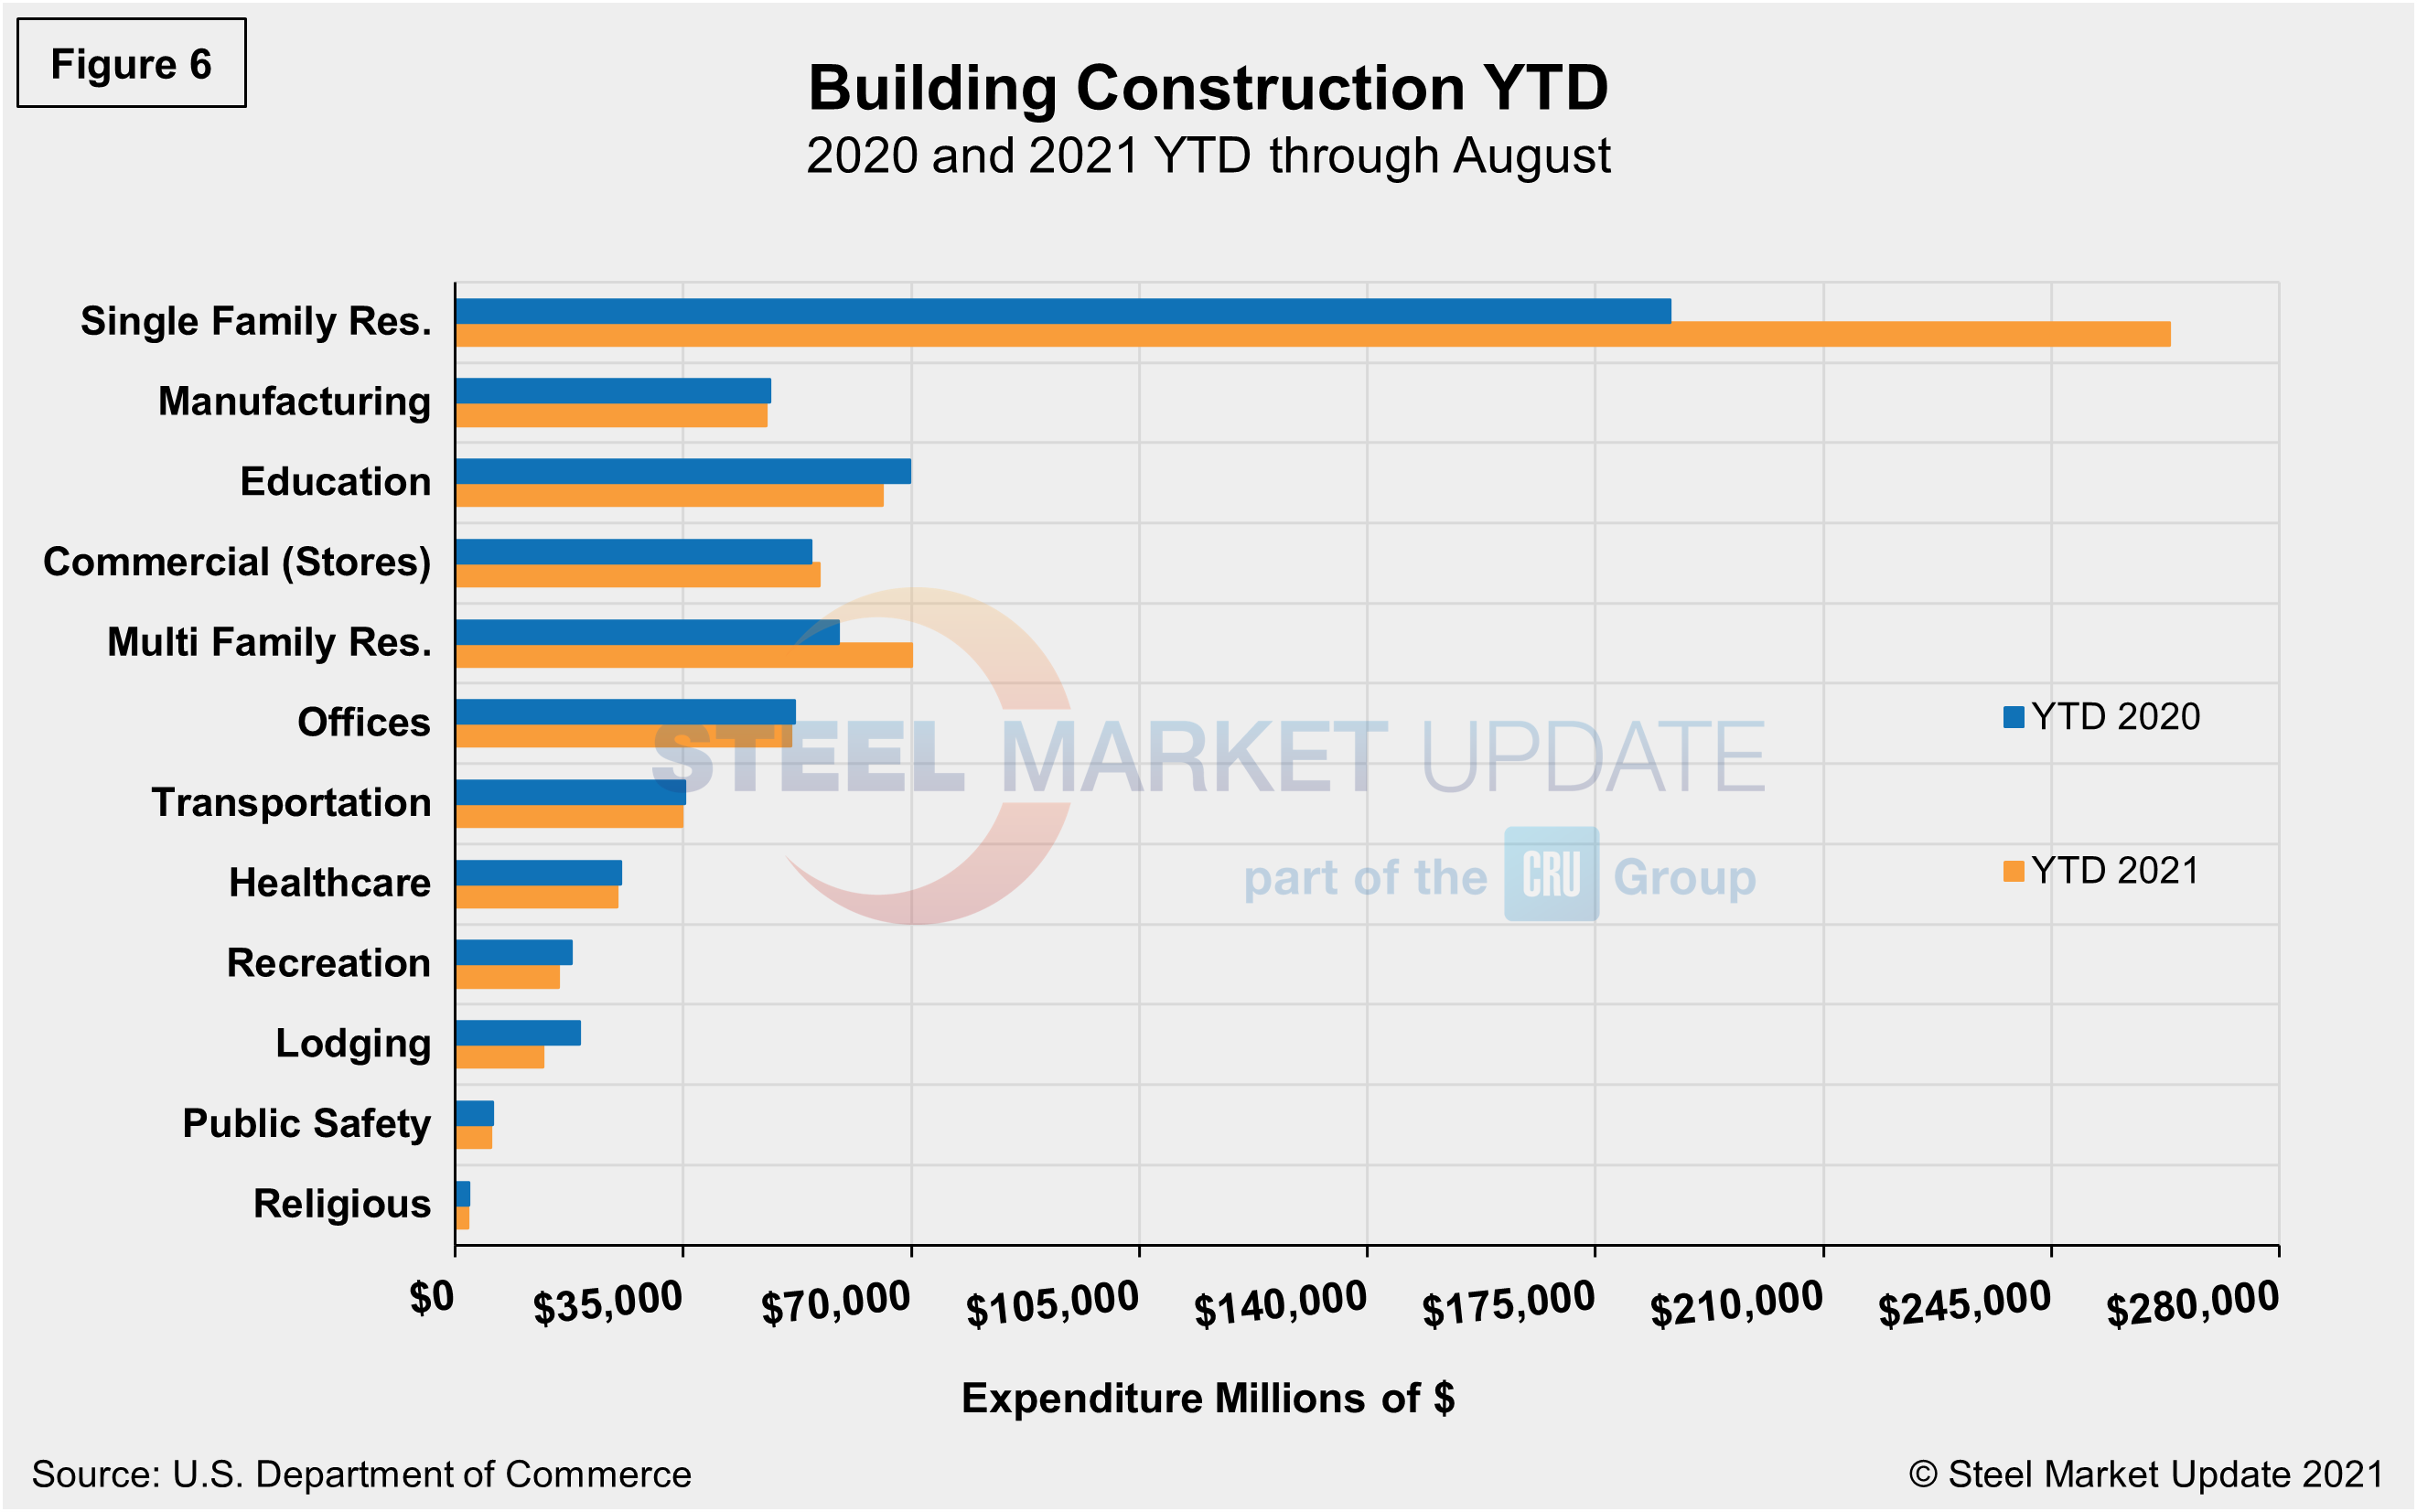
Year-to-date expenditures for construction of the various building sectors for 2020 and 2021 are compared in Figure 6. Single-family residential construction was dominant in 2020 with expenditures totaling an annualized $301.9 billion. To date, 2021 has been the same. Through August, expenditures for single-family construction were $263.1 billion or 41.2% above year-ago levels when expenditures were $186.4 billion. Multifamily residential at 19.3% and Commercial at 2.3%, are the only other subsectors experiencing year-to-date expansion compared to the same year-ago period. Lodging and recreation are behind by double digits, 29.4% and 10.6%, respectively.
Explanation: Each month, the Commerce Department issues its Construction Put in Place (CPIP) data, usually on the first working day covering activity one month and one day earlier. There are three major categories based on funding source: private, state and local, and federal. Within these three groups are about 120 subcategories of construction projects. SMU analyzes the expenditures from the three funding categories to provide a concise summary of the steel-consuming sectors.
By David Schollaert, David@SteelMarketUpdate.com


