

Market Data

October 6, 2021
Steel Product Shipments and Inventories Through August
Written by David Schollaert
U.S. steel product shipments rose for a fourth consecutive month in August, but at a slower pace, just 0.6% above July’s total. Despite the slow pace of growth, steel product shipments have been on a steady upward trend for much of the year.
Although the expansion in steel product shipments and new orders continued, the rate of growth eased in August, in line with mill outages, labor shortages, supply chain disruptions, and other factors impacting the steel and manufacturing industries.
Manufacturing inventories saw a much slower rate of rise in August, according to the latest available Census Bureau data on inventories, shipments and new orders for total U.S. manufacturing and steel products. Total manufacturing inventories were up fractionally in August, just 0.6% versus the month prior, but up 6.7% and 6.3% when compared to the same 2020 and 2019 months, respectively. Steel product inventories have seen a far more pronounced growth rate over the same period. Although August’s total is up just 1.6% from the month prior, it’s up 19.8% versus the same 2020 period. The strong recovery in steel product inventories has rebounded above the 2019 pre-pandemic year by 7.5%.
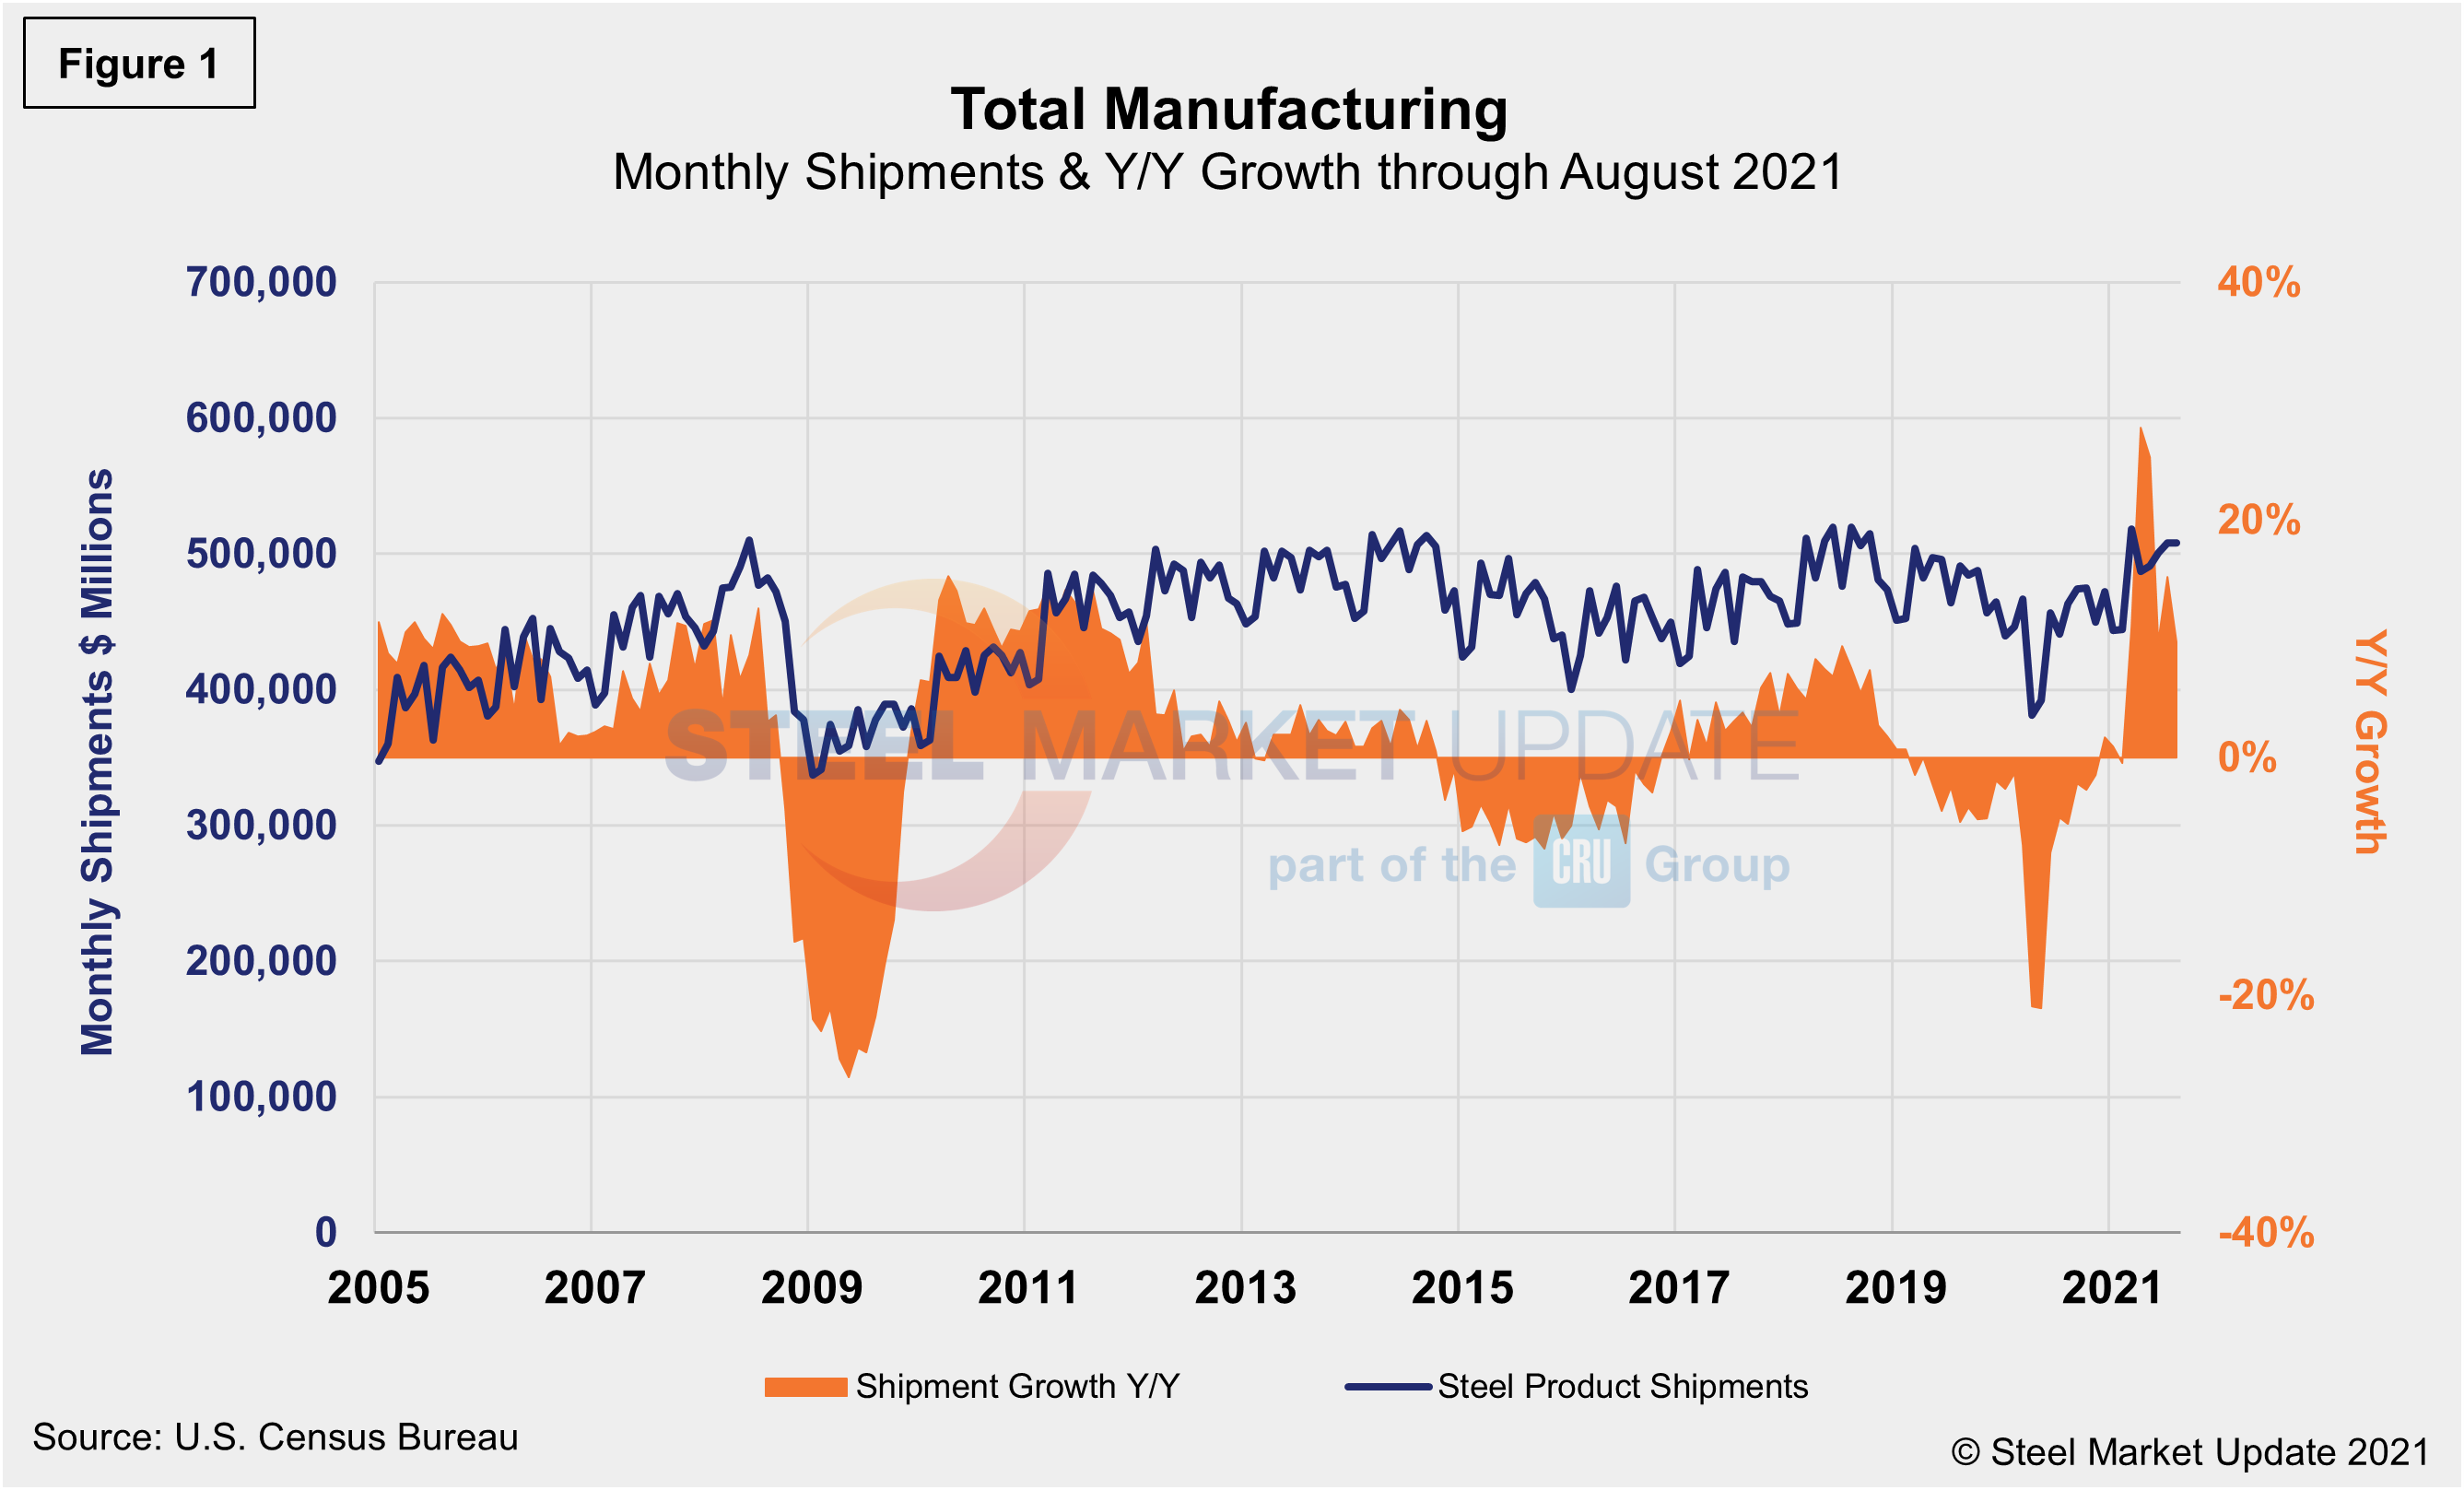
Total shipments and inventories are reported in millions of dollars, seasonally adjusted. Total steel shipments in August were 38.5% higher than in the same year-ago period and 18.8% higher when compared to the same pre-pandemic period in 2019. Year over year through August, total manufactured product shipments rose by 11.9%, and were up 1.9% when compared to the first eight months of 2019. During the first wave of the global pandemic last April, total manufacturing shipments plunged by 19.4% and steel product shipments fell by 21.4% compared with the prior year. Both have steadily recovered since. Figure 1 and Figure 2 show the history of both since 2005.
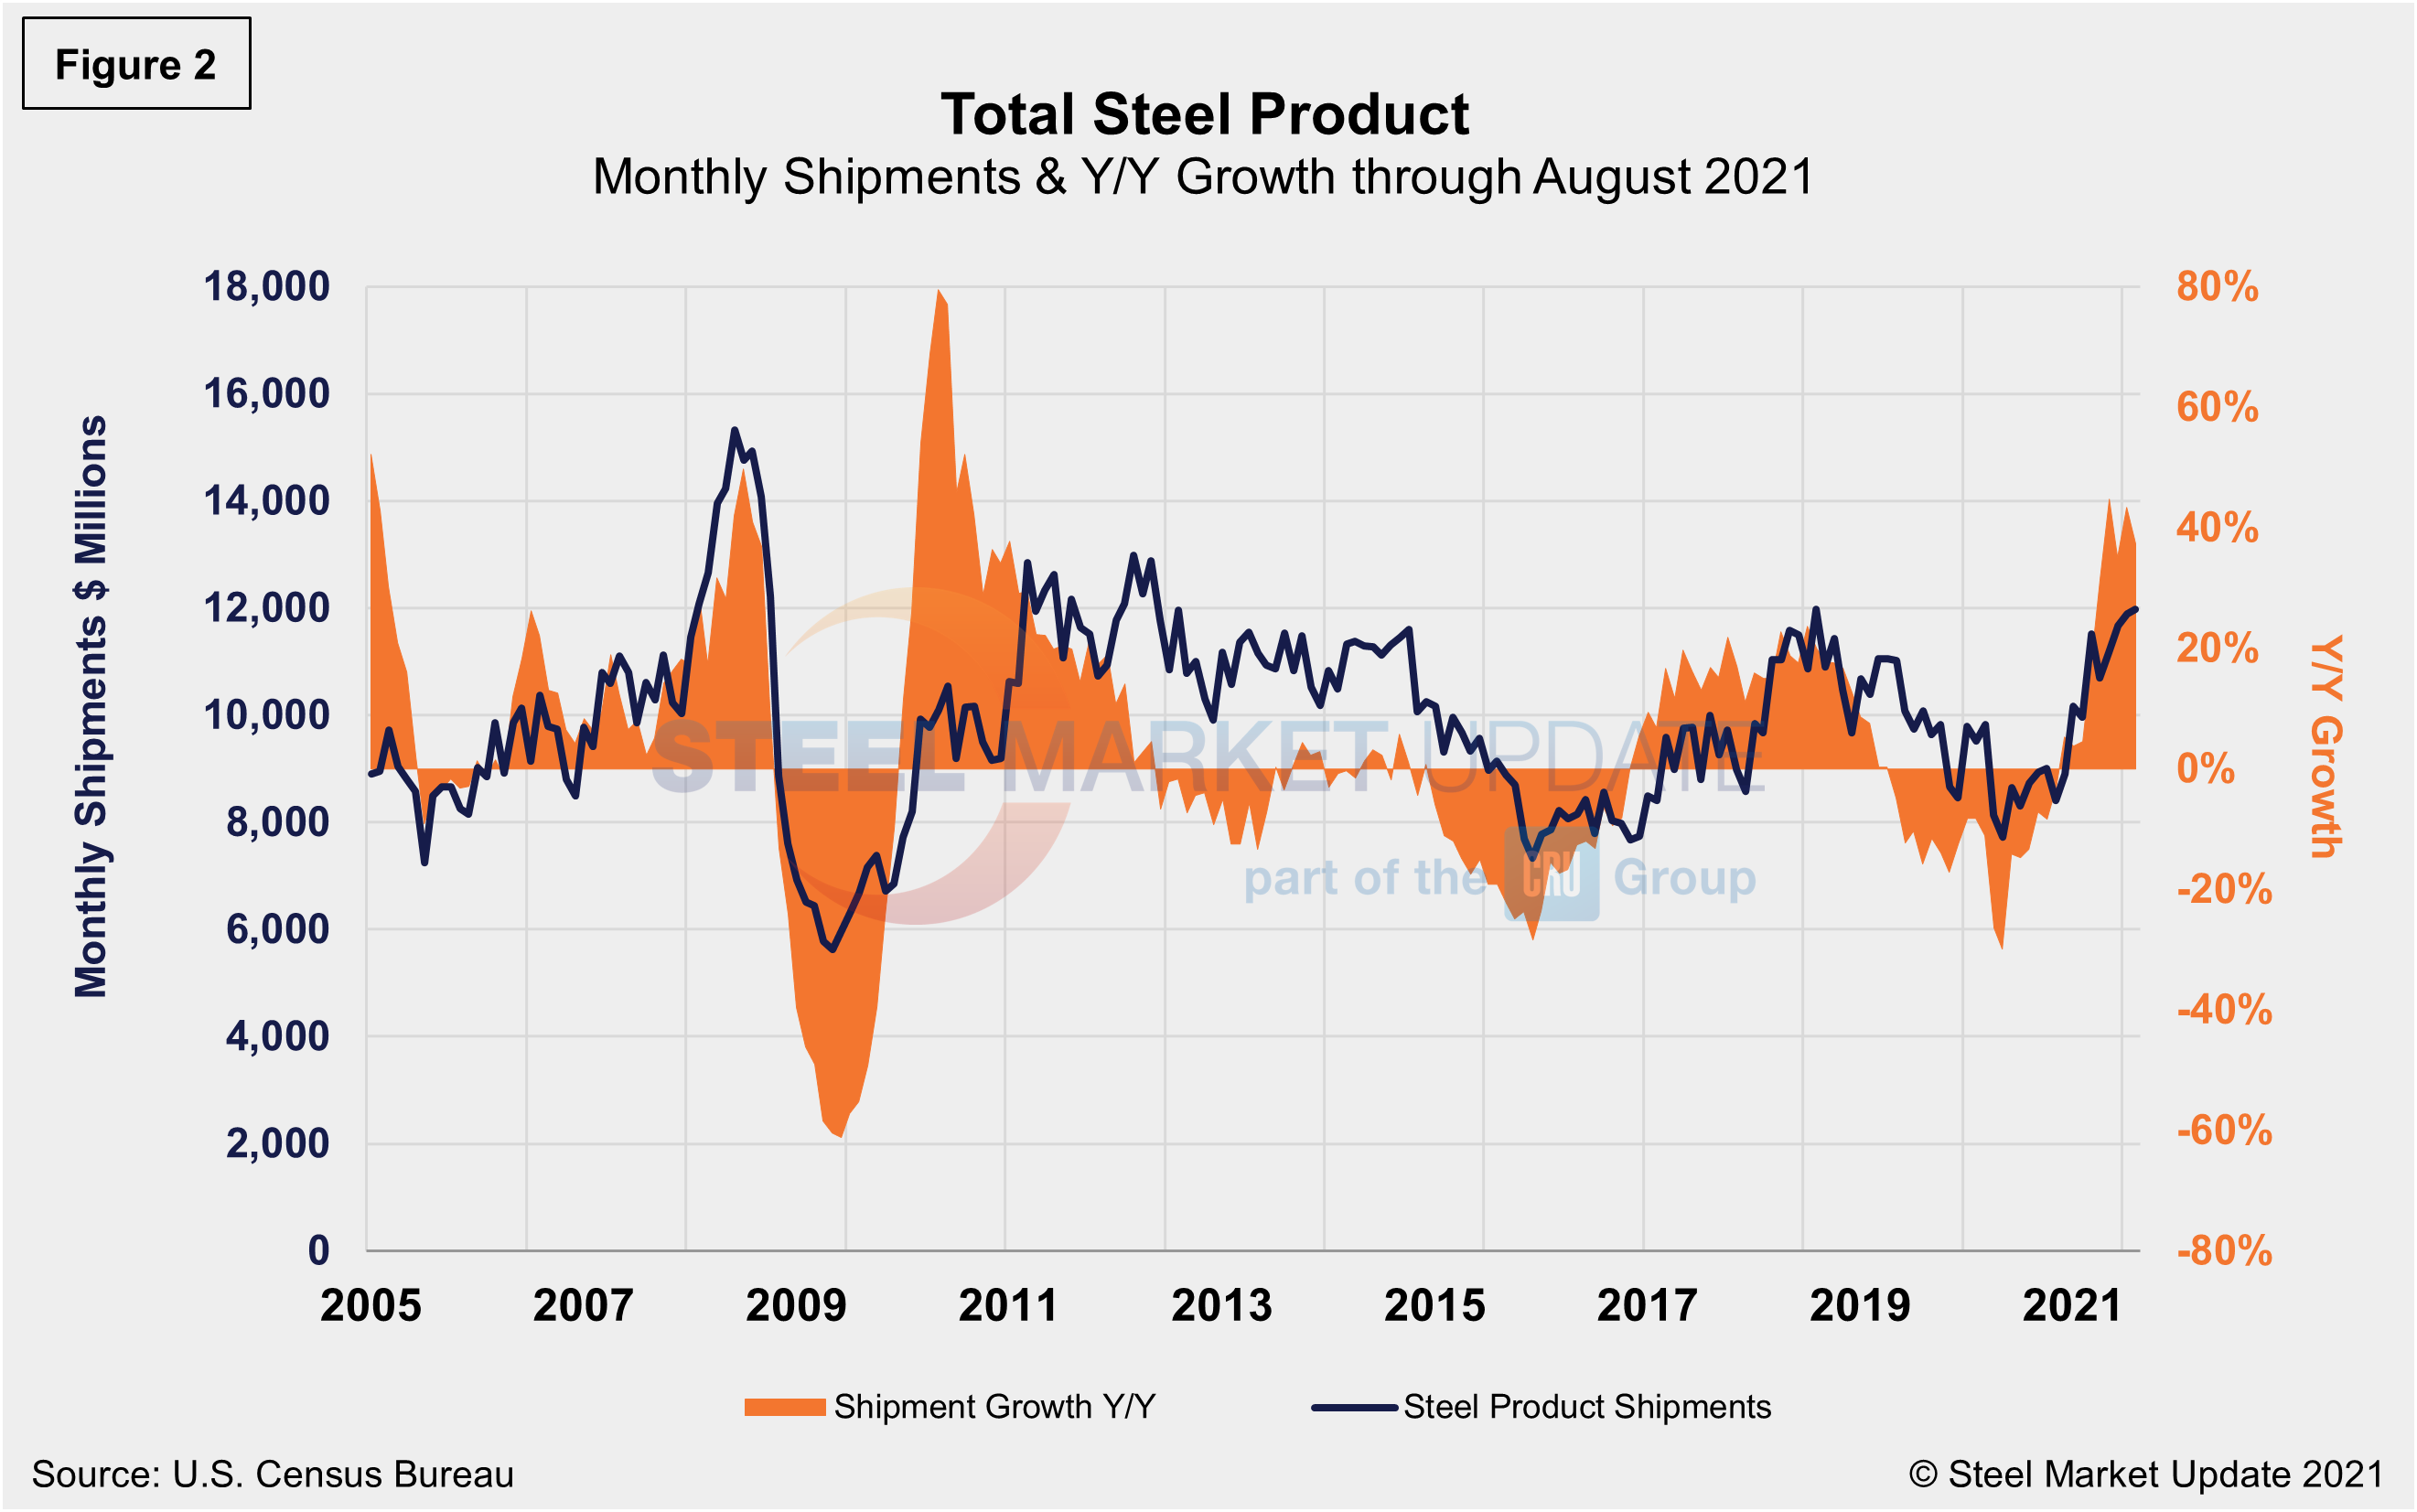
Monthly steel product shipments through August are detailed in Figure 2. Shipments of steel products totaled $11.968 billion in August, up 0.6% from $11.895 billion in July, and up 38.5% from year-ago levels when shipments were $8.720 billion. Shipments of steel products had most recently peaked in August 2018 at $11.980 billion, then began a 20-month decline through May 2020. Although the growth rate declined from 23.6% in July 2018 to 3.8% through January 2021, the steady growth since has pushed shipments of steel products to their highest level to date.
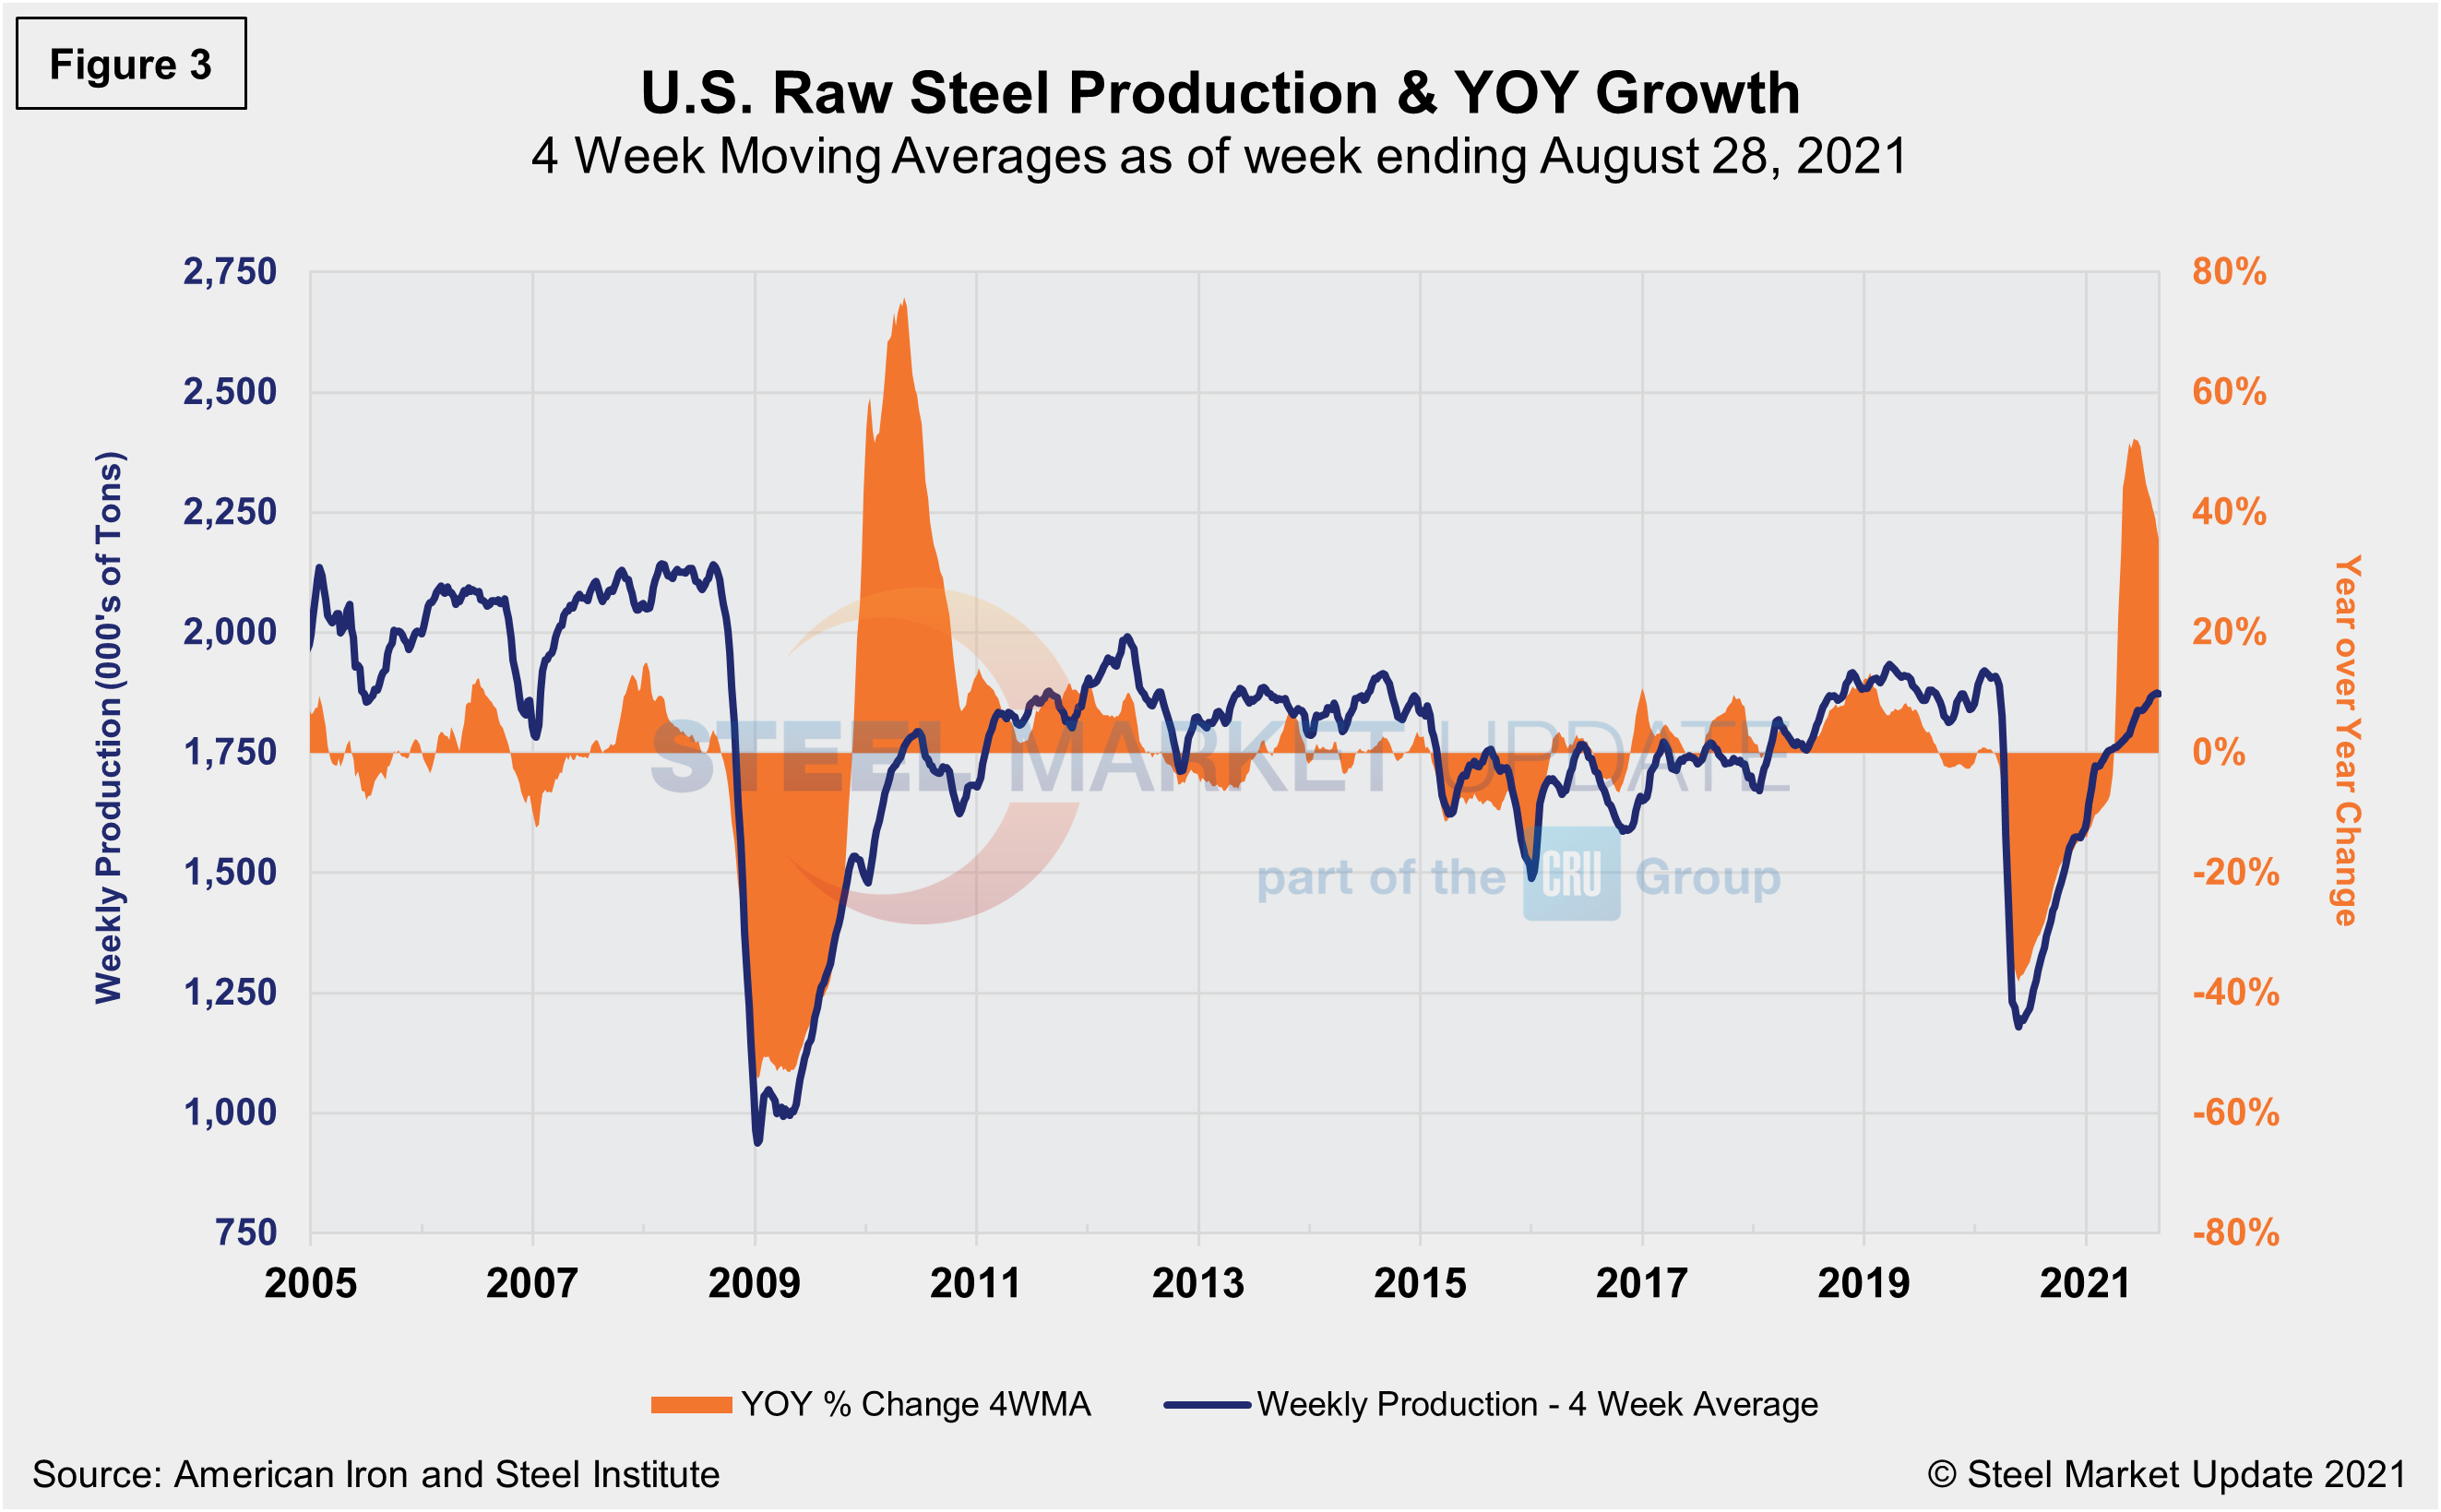
The Census data in Figure 2 compares well over the long term with the American Iron and Steel Institute (AISI) weekly crude steel production shown in Figure 3. Figure 2 is in dollars and Figure 3 is in tons, but they paint a similar picture. Steel production has rebounded since the freefall seen during the first wave of the pandemic, according to AISI data shown on a four-week moving average basis. Crude steel production was up 35.6% in the week ending Aug. 28 compared the same period a year ago.
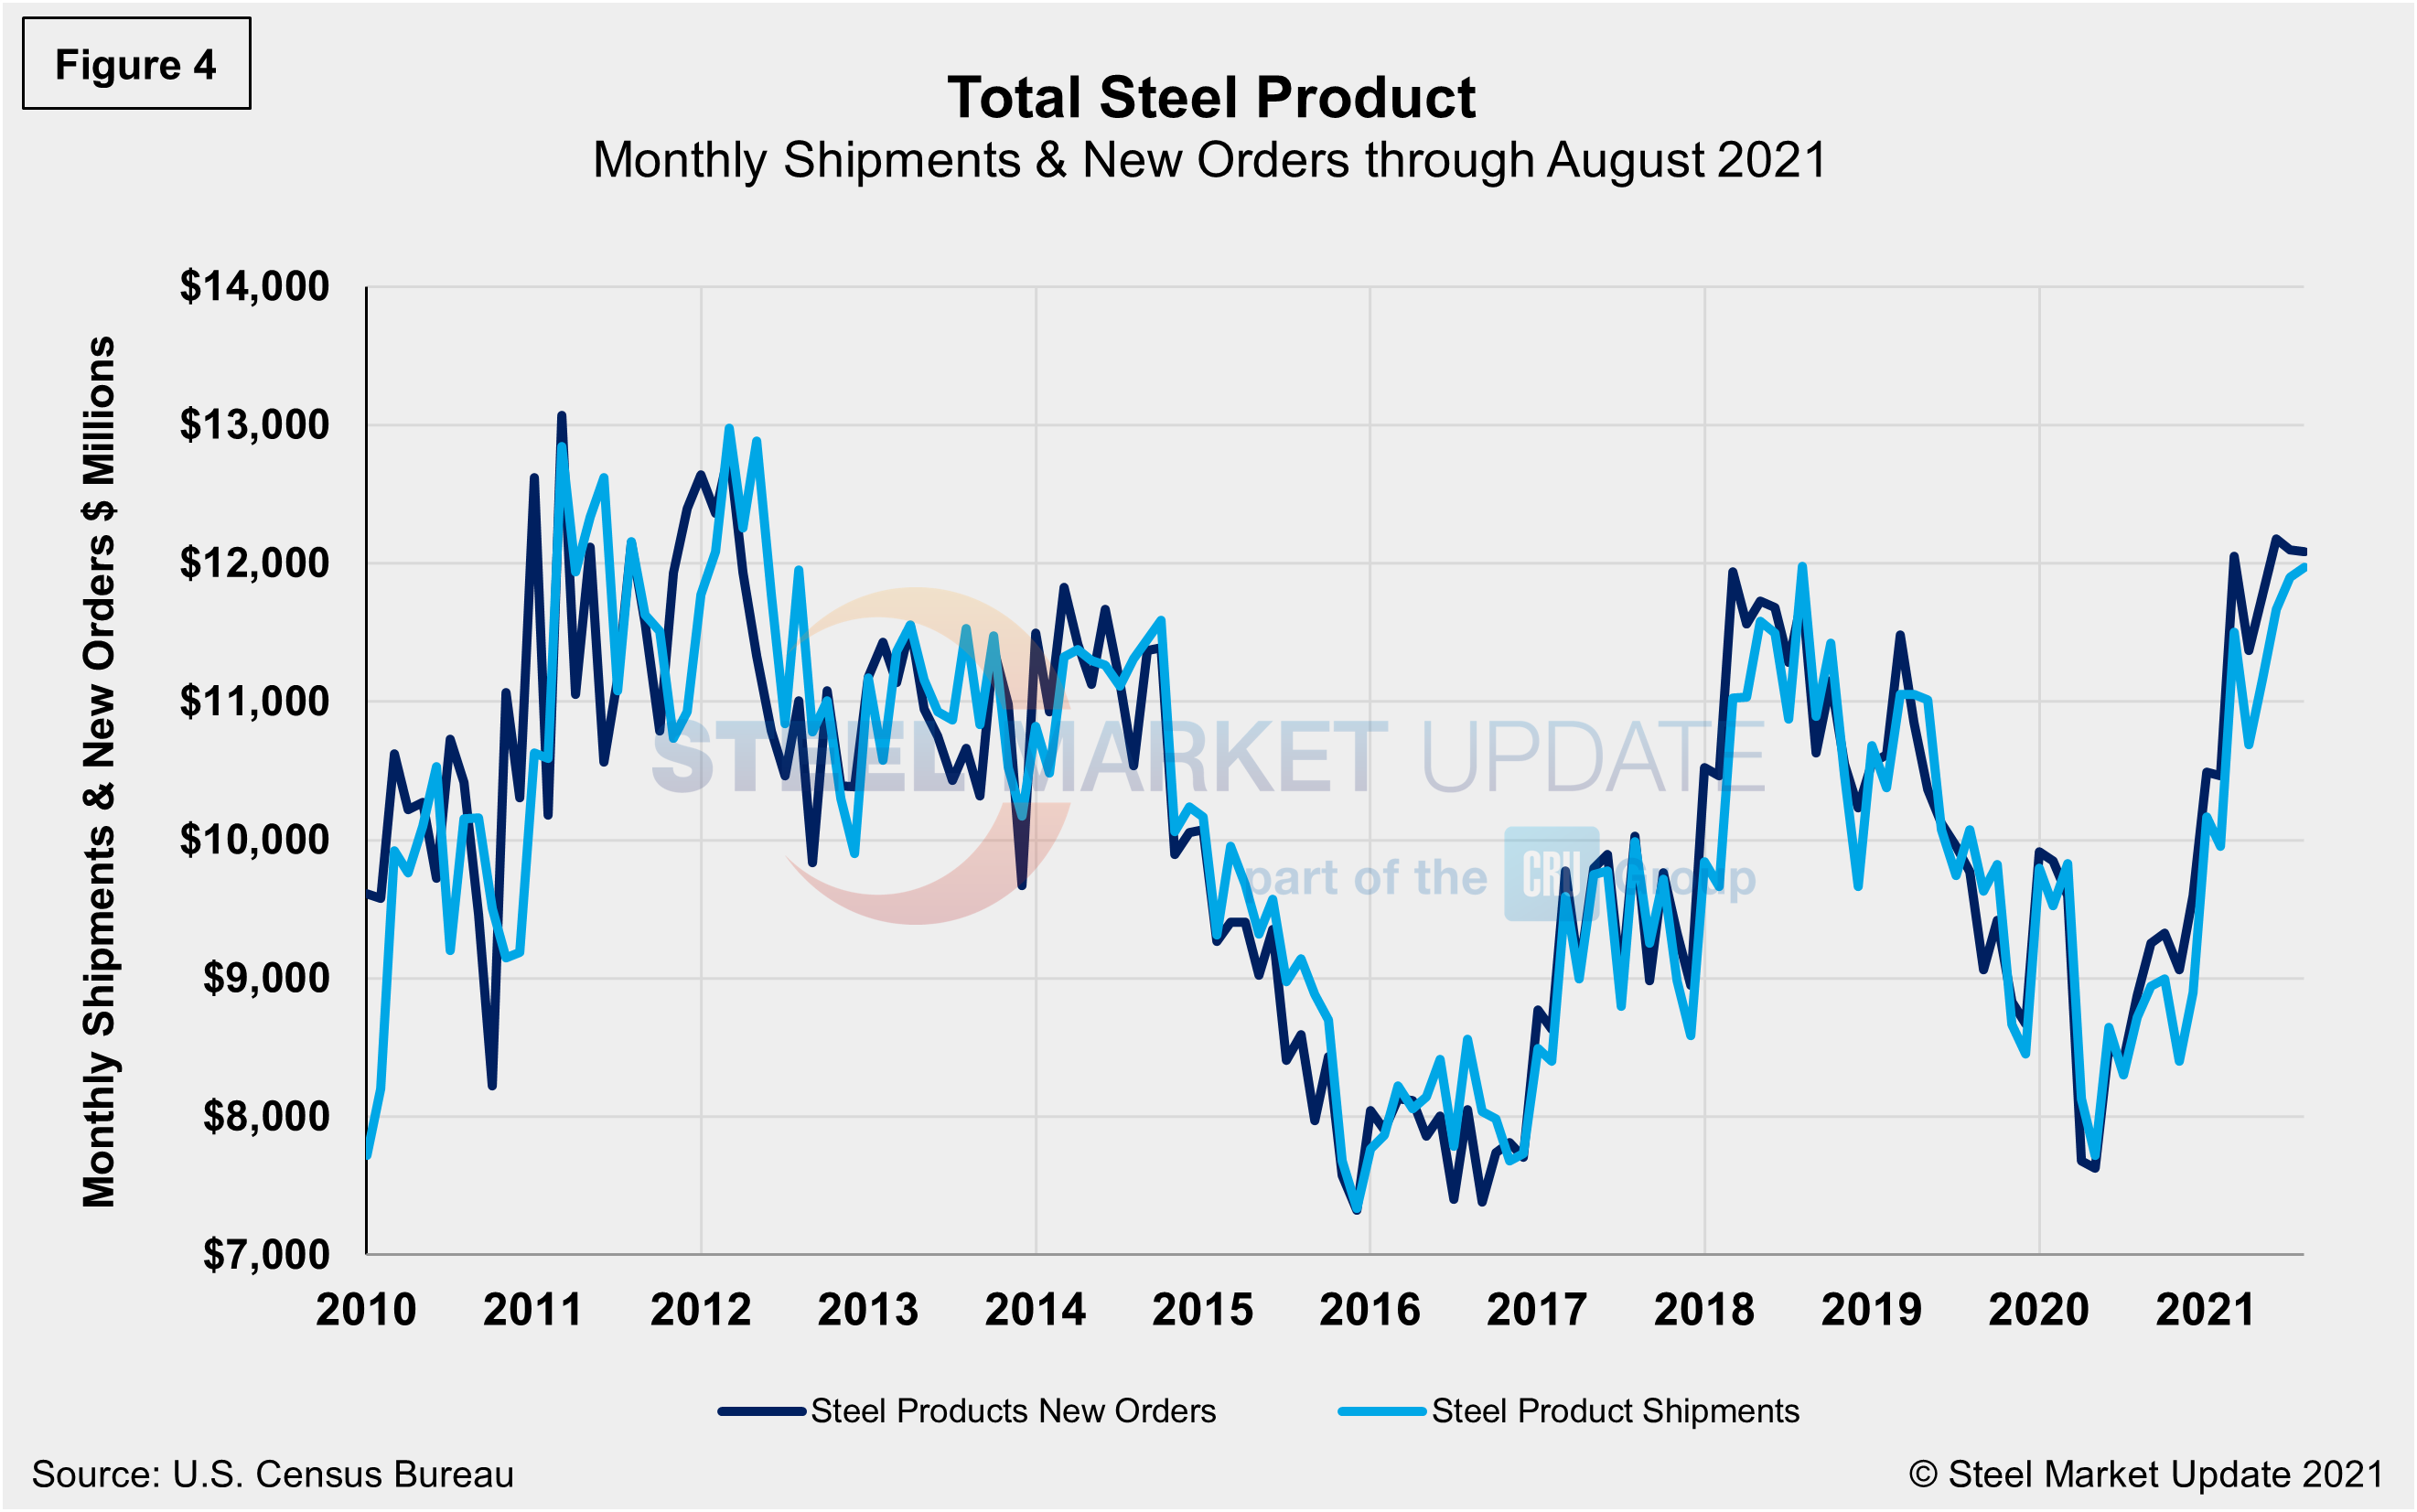
Steel product shipments and new orders on a monthly basis since 2010 are shown in Figure 4. New orders and shipments saw similar declines last April but were back in balance by June. Since then, however, new orders have exceeded shipments and continue to steadily outpace them. In August, even though steel product shipments grew month on month compared to a contraction in new orders—0.6% versus -0.1%, respectively—shipments were still $115 million less.
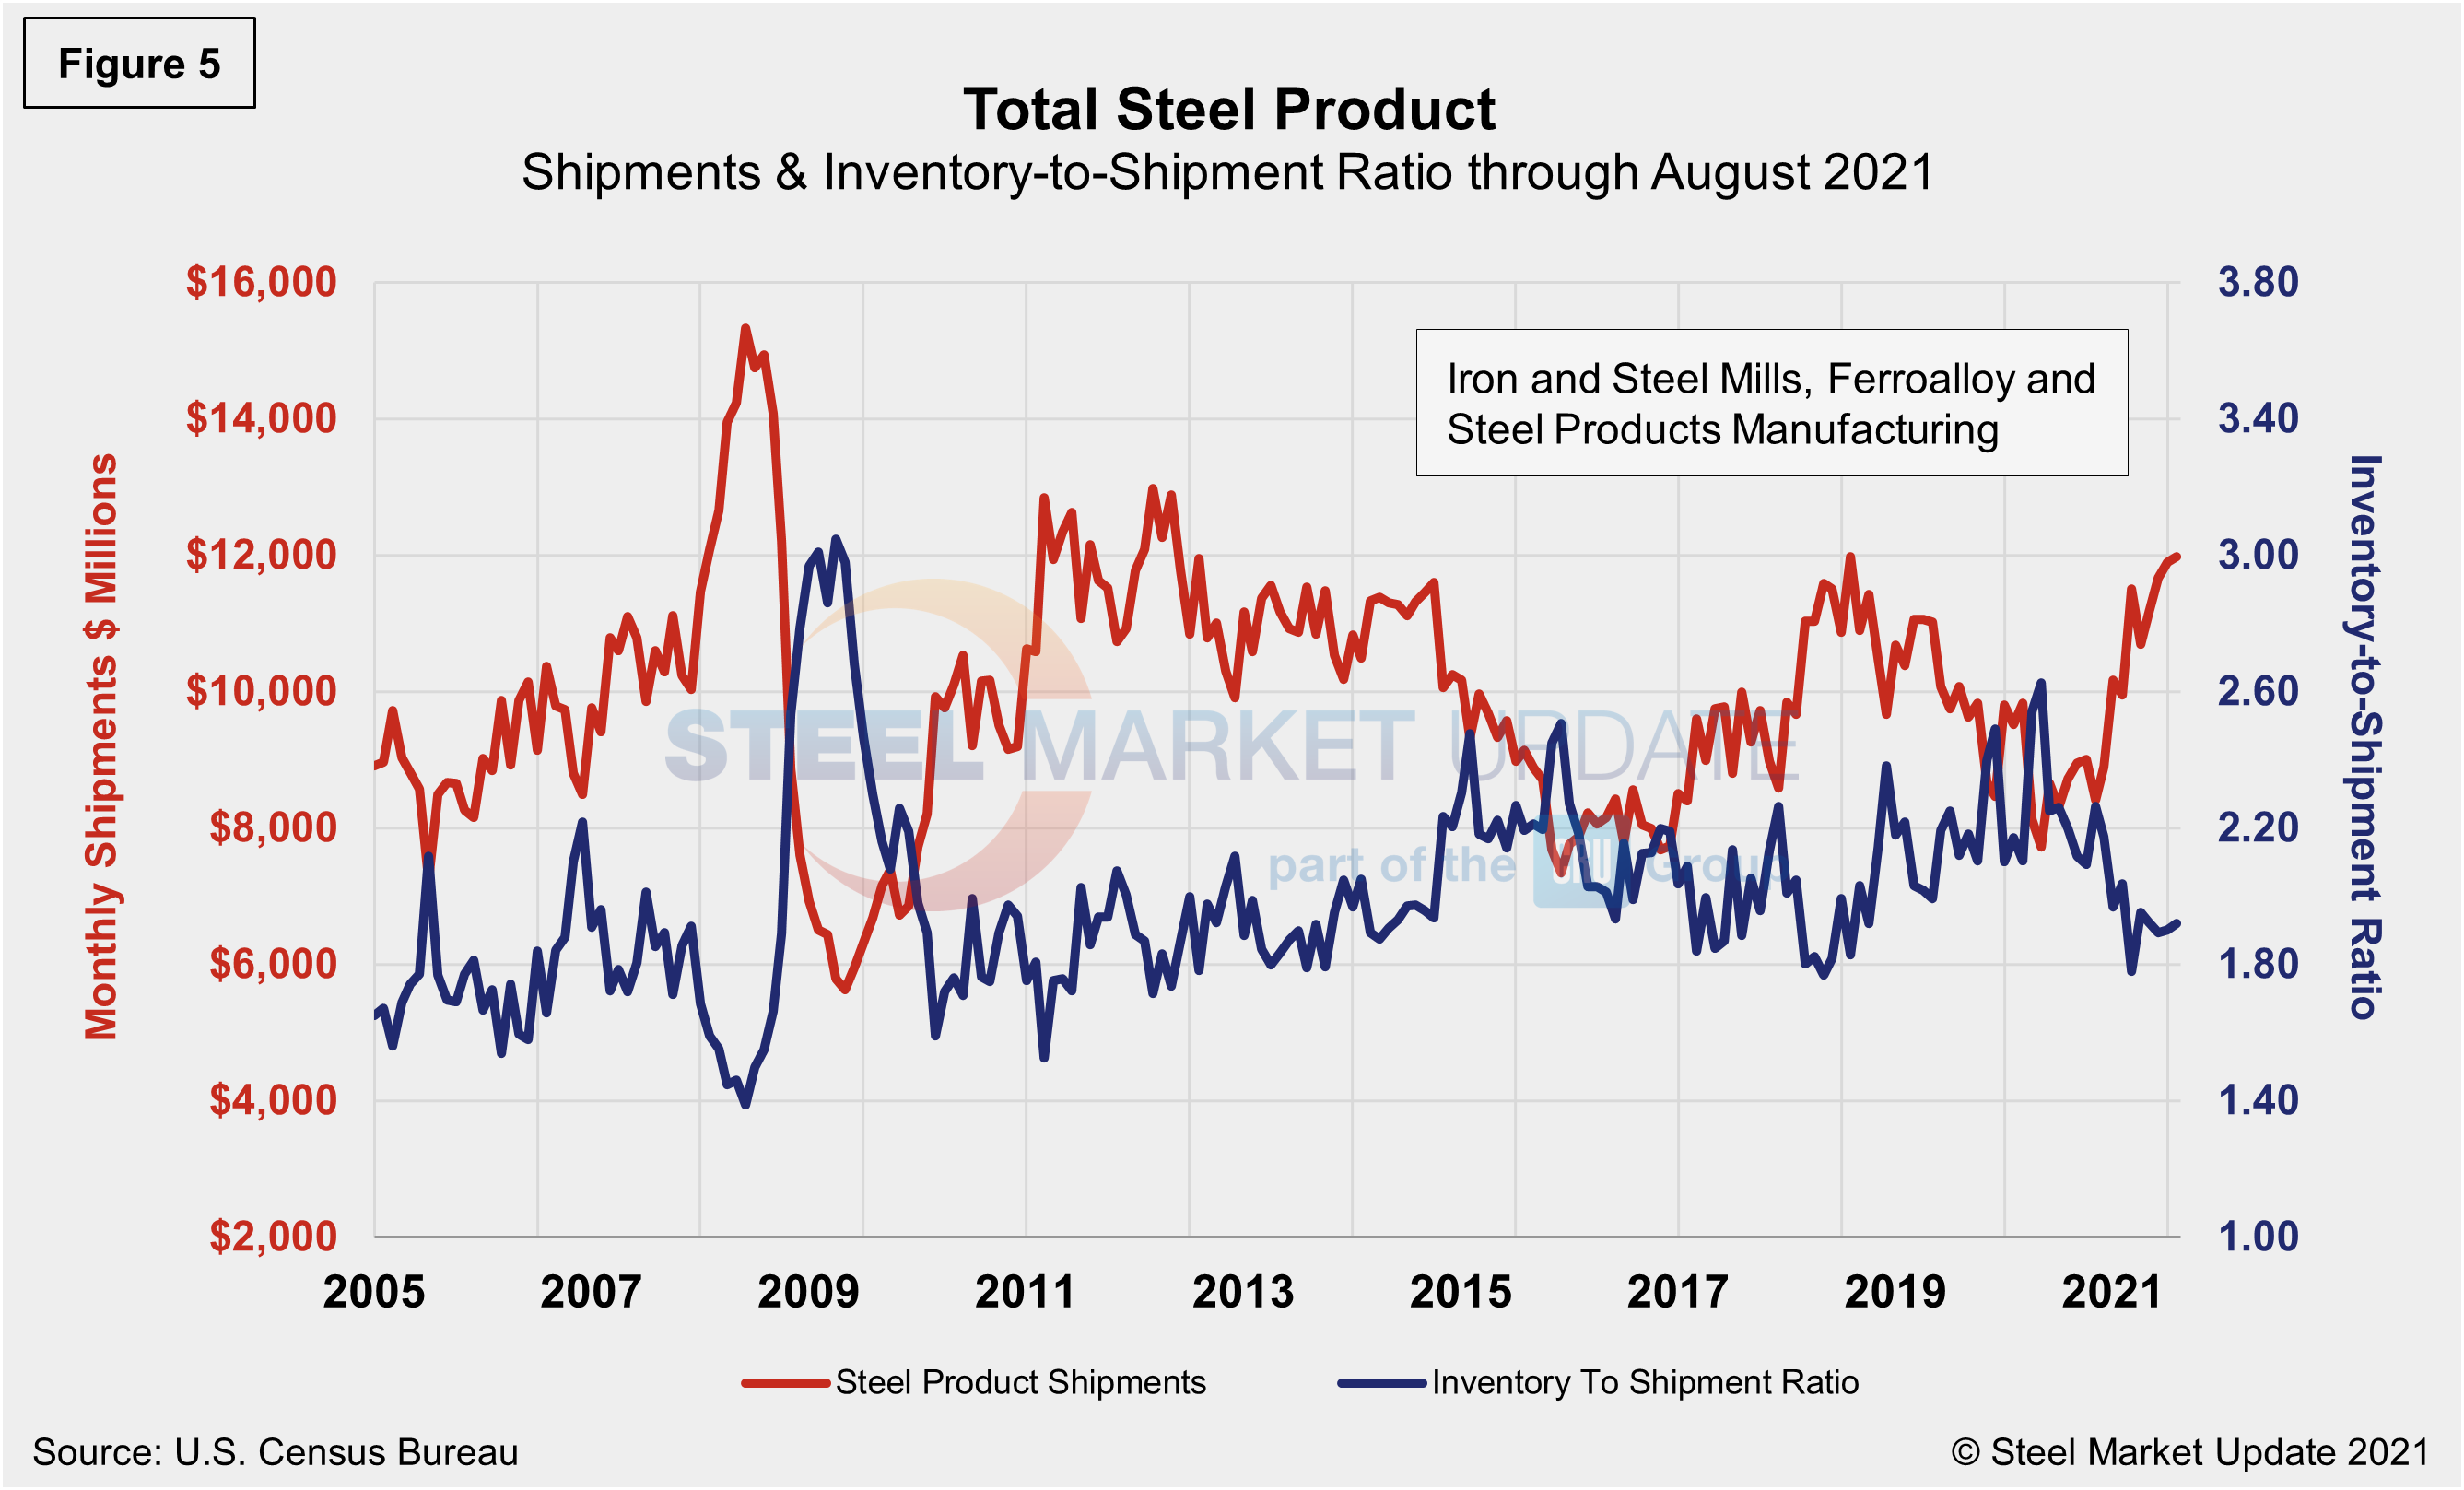
The same total shipment line as in Figure 2 is shown below in Figure 5, but now includes the inventory-to-shipment (IS) ratio. The IS ratio is a measure of how much inventory is necessary to support the level of shipments. Thus the lower the IS ratio, the better. The IS ratio for steel products shot up in May 2020 to 2.62% as shipments declined due to supply-chain disruptions from COVID-19-related closures. Now, a little more than a year removed, the IS ratio was at 1.90%, up a fraction of a percentage point, as demand was still outpacing supply through August.
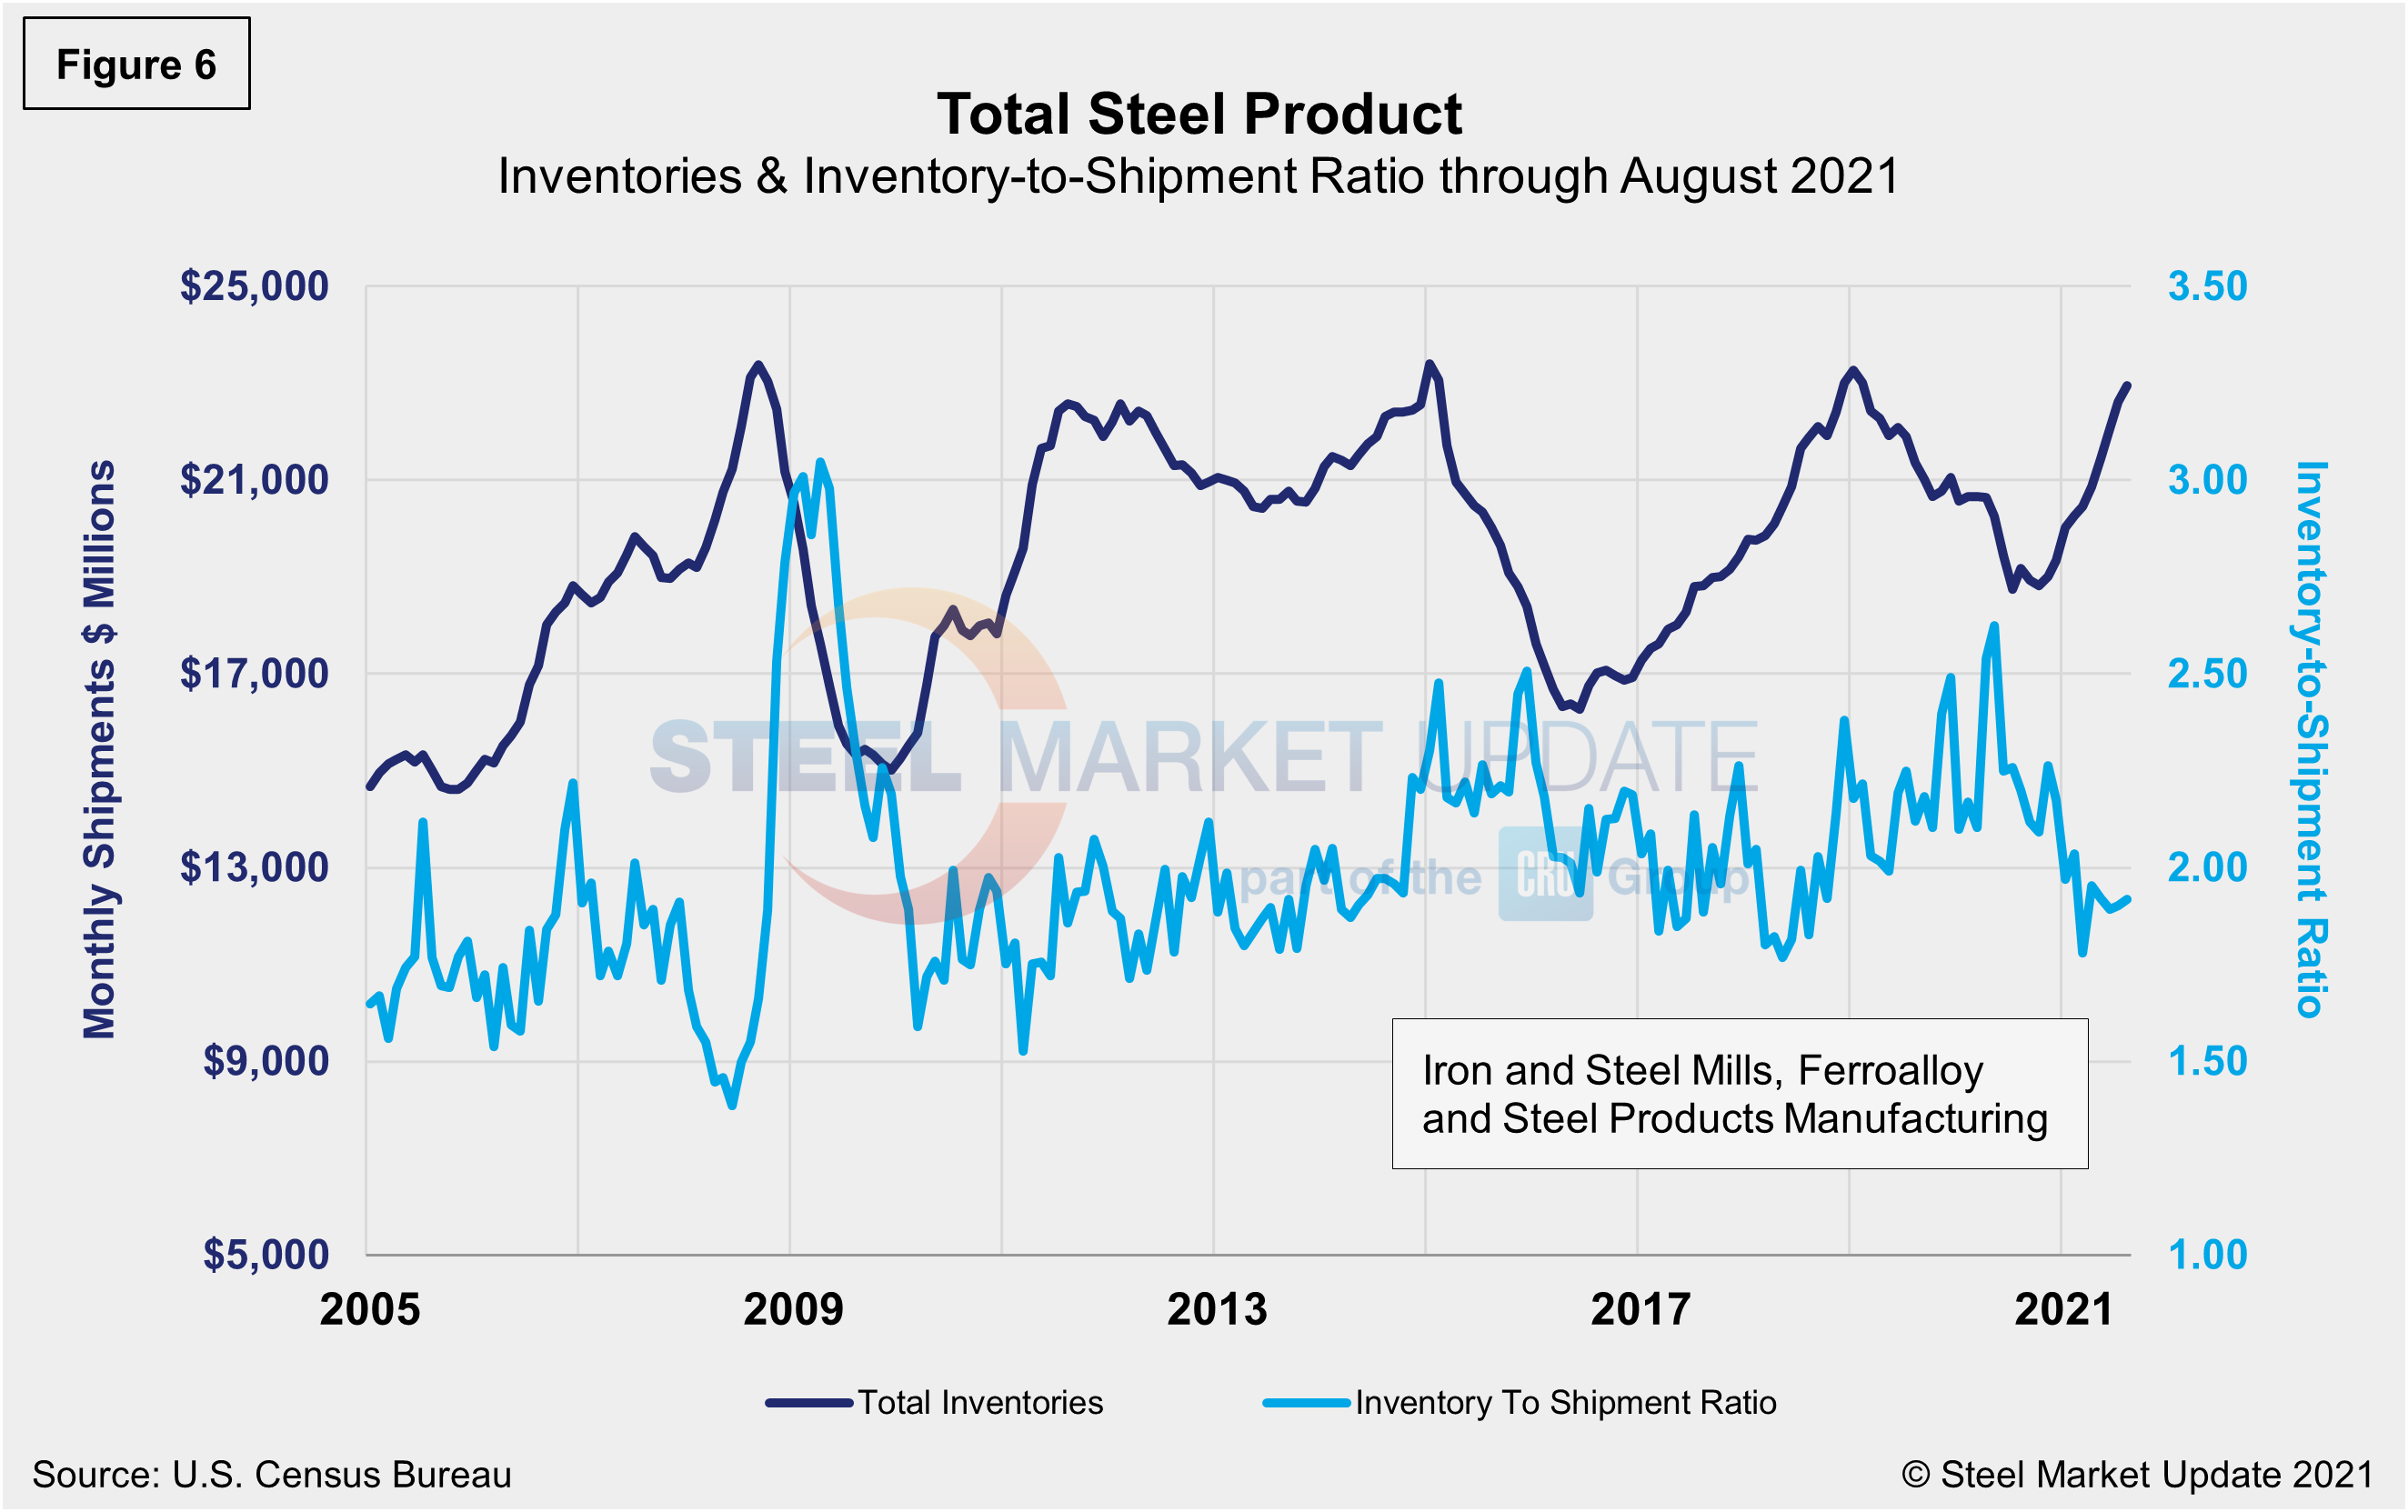
The IS ratio had been inconsistent through the first few months in 2021, reflecting weather-related delays, temporary disruptions, and maintenance outages. Total inventories were up 19.8% in August when compared to the same year-ago period, while shipments were up 4.1% during the same period. These dynamics highlight a continued tight spot market for steel. Overall, steel shipments have improved by 55.1% since May 2020, when the market reached bottom. Total inventory in millions of dollars is displayed in Figure 6 and echoes the inventory-to-shipment ratio shown in Figure 5.
By David Schollaert, David@SteelMarketUpdate.com


