

Market Data

October 11, 2021
Employment by Industry: September’s Results Disappoint
Written by David Schollaert
September saw the worst monthly performance for the U.S. labor market since January, according to the U.S. Bureau of Labor Statistics’ (BLS) job report. The latest data showed the economy created a stingy 194,000 new jobs in September to mark the second disappointing monthly increase in a row. The sharp dive from the 1.091 million positions added in July suggests a lack of labor could frustrate U.S. economic growth in the months ahead.
September’s employment report fell well short of several market forecasts and far below the monthly average of 561,000 jobs created since the start of the year. The size of the labor force shrank by 183,000, partly explaining the unexpected drop in unemployment, which slipped to 4.8% and touched a new pandemic low.
Leisure and hospitality returned as the primary driver of job creation after a poor showing the month prior. The total was underwhelming, however, adding just 74,000 positions and a far cry from 350,000 jobs added per month during the first six months of the year. The unemployment rate for the sector fell 1.4 percentage points to 7.7% in September. The hospitality industry is among the most sensitive to the pandemic and its weak performance was likely a casualty of the Delta surge.
Notable job gains also occurred in professional and business services, in retail trade, and in transportation and warehousing. The number of public education jobs fell, with 161,000 fewer positions across local and government education.
The BLS noted that seasonal factors were also an issue. “Recent employment changes are challenging to interpret, as pandemic-related staffing fluctuations in public and private education have distorted the normal seasonal hiring and layoff patterns,” it said.
Employment in food service and other dining establishments was little changed for the second straight month. From January to July, that sector reported average monthly gains of 197,000.
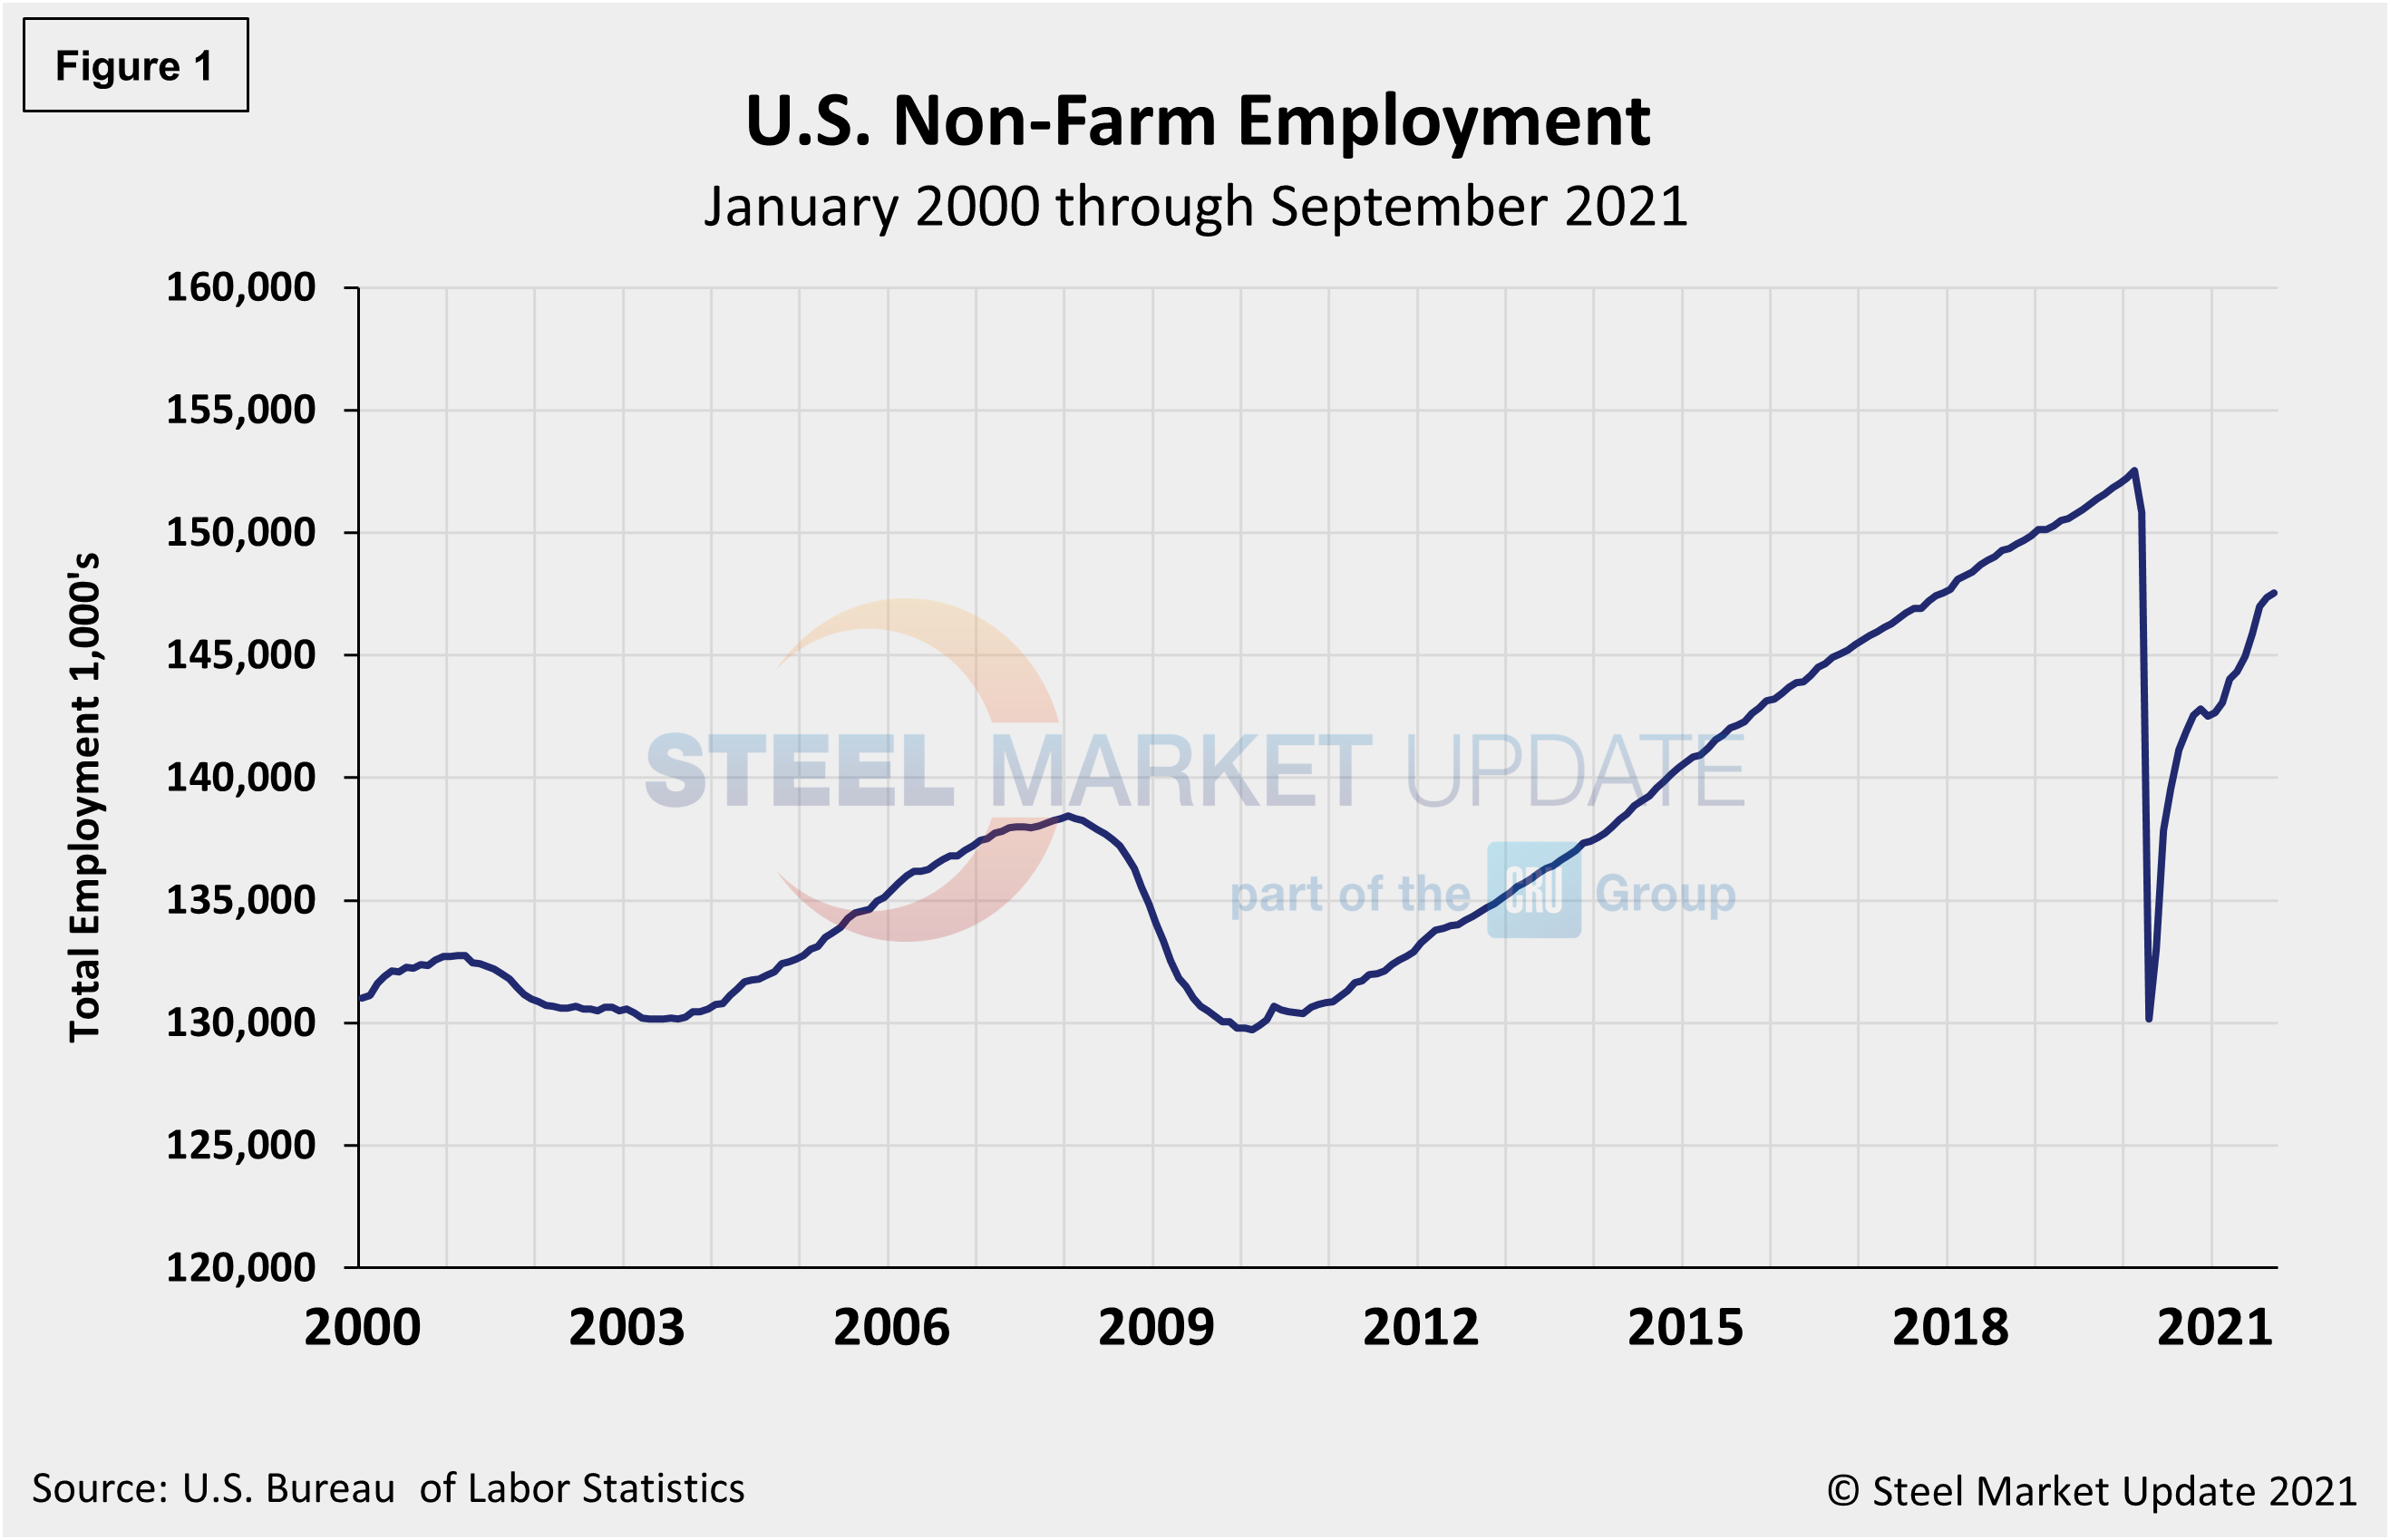
The number of unemployed persons fell by 710,000 to 7.7 million last month. To date, the U.S. has recovered nearly 15.1 million or 67% of the 22.5 million jobs lost last spring. There are still 5 million more Americans out of work than at the start of the pandemic, a sign that the labor market recovery has lost momentum. Figure 1 shows the total number of people employed in the nonfarm economy.
Designed on rolling time periods of 1 month, 3 months, 1 year and 2 years, the table below breaks total employment into service industries and goods-producing industries, and then into private and government employees. Most of the goods-producing employees work in manufacturing and construction. Comparing service and goods-producing industries in September shows service jobs have increased by just 0.1%, while goods-producing jobs rose by 0.3% from August’s result. Despite the slight month-on-month gains, both industries are behind pre-pandemic levels by nearly 3.0%. Note, the subcomponents of both manufacturing and construction shown in this table don’t add up to the total because we have only included those with the most relevance to the steel industry.
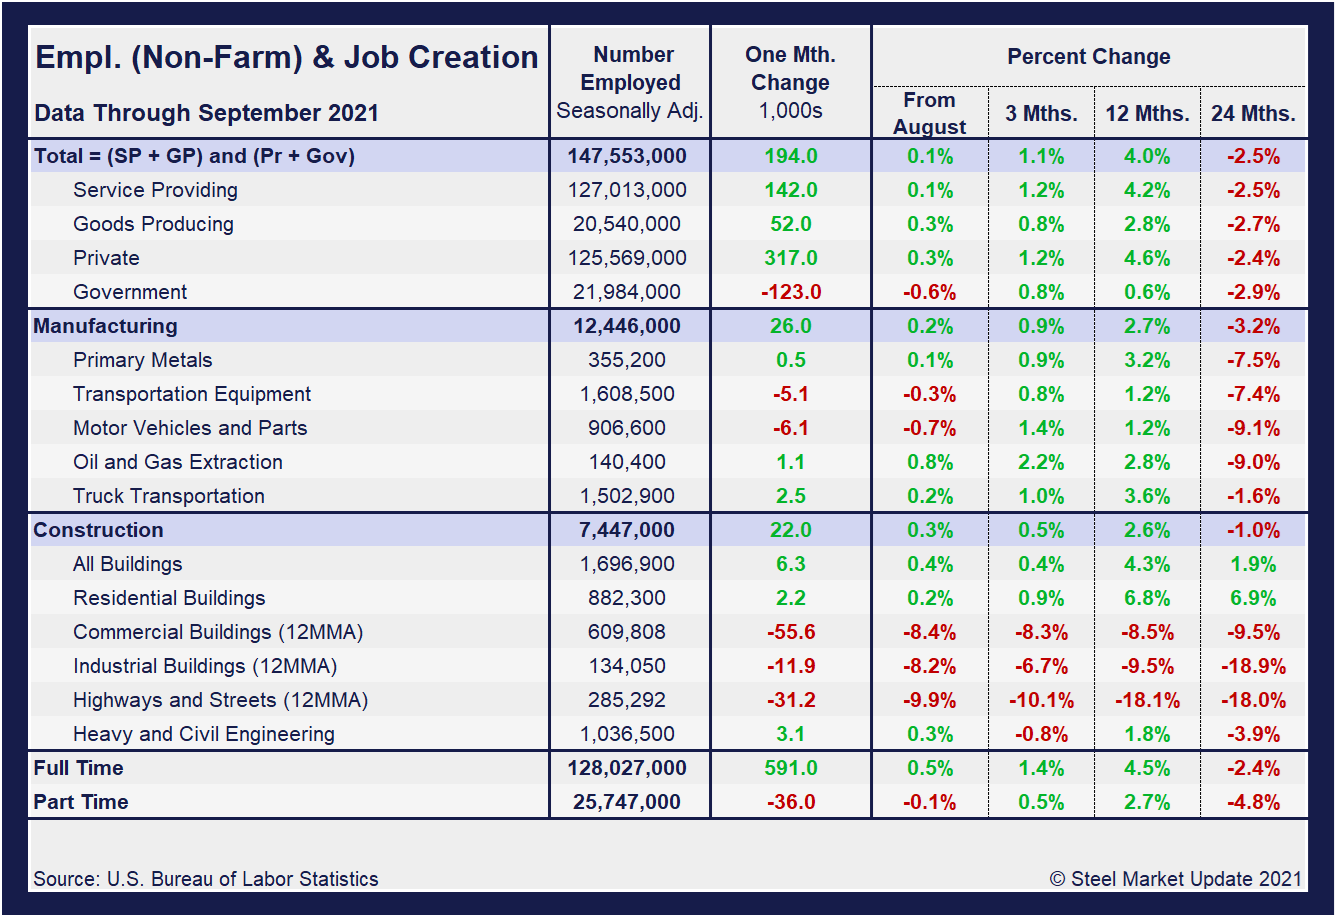
Comparing September to August, manufacturing employment was up 0.2% versus a gain 0.4% the month prior. Construction was up 0.3% month on month compared to a 0.1% decline in August. Despite the strong gains from May through July, the results in August and September, though positive, underscore the inconsistencies and struggles across some subcomponents and the potential that the recovery and rate of growth is stalling. The construction sector, especially, shows the significant obstacles facing the U.S. economy and domestic job creation. And three-month, 12-month and 24-month comparisons remain problematic due to the extensive losses resulting from pandemic. In the year-over-year contrast, manufacturing is up just 2.7% and construction is up 2.6%. Further growth is still expected as the marketplace advances from the freefall seen during the second quarter of 2020, but the pace may be slowing.
Manufacturing employment increased by 26,000 jobs in September compared to an increase of 37,000 the month prior, led by gains in durable goods, specifically 8,000 in fabricated metal products, 6,000 in machinery and 4,000 new jobs in printing and related support activities. Gains were partially offset by a decline of 6,000 in motor vehicles and parts. Manufacturing employment is down by 353,000 since February 2020.
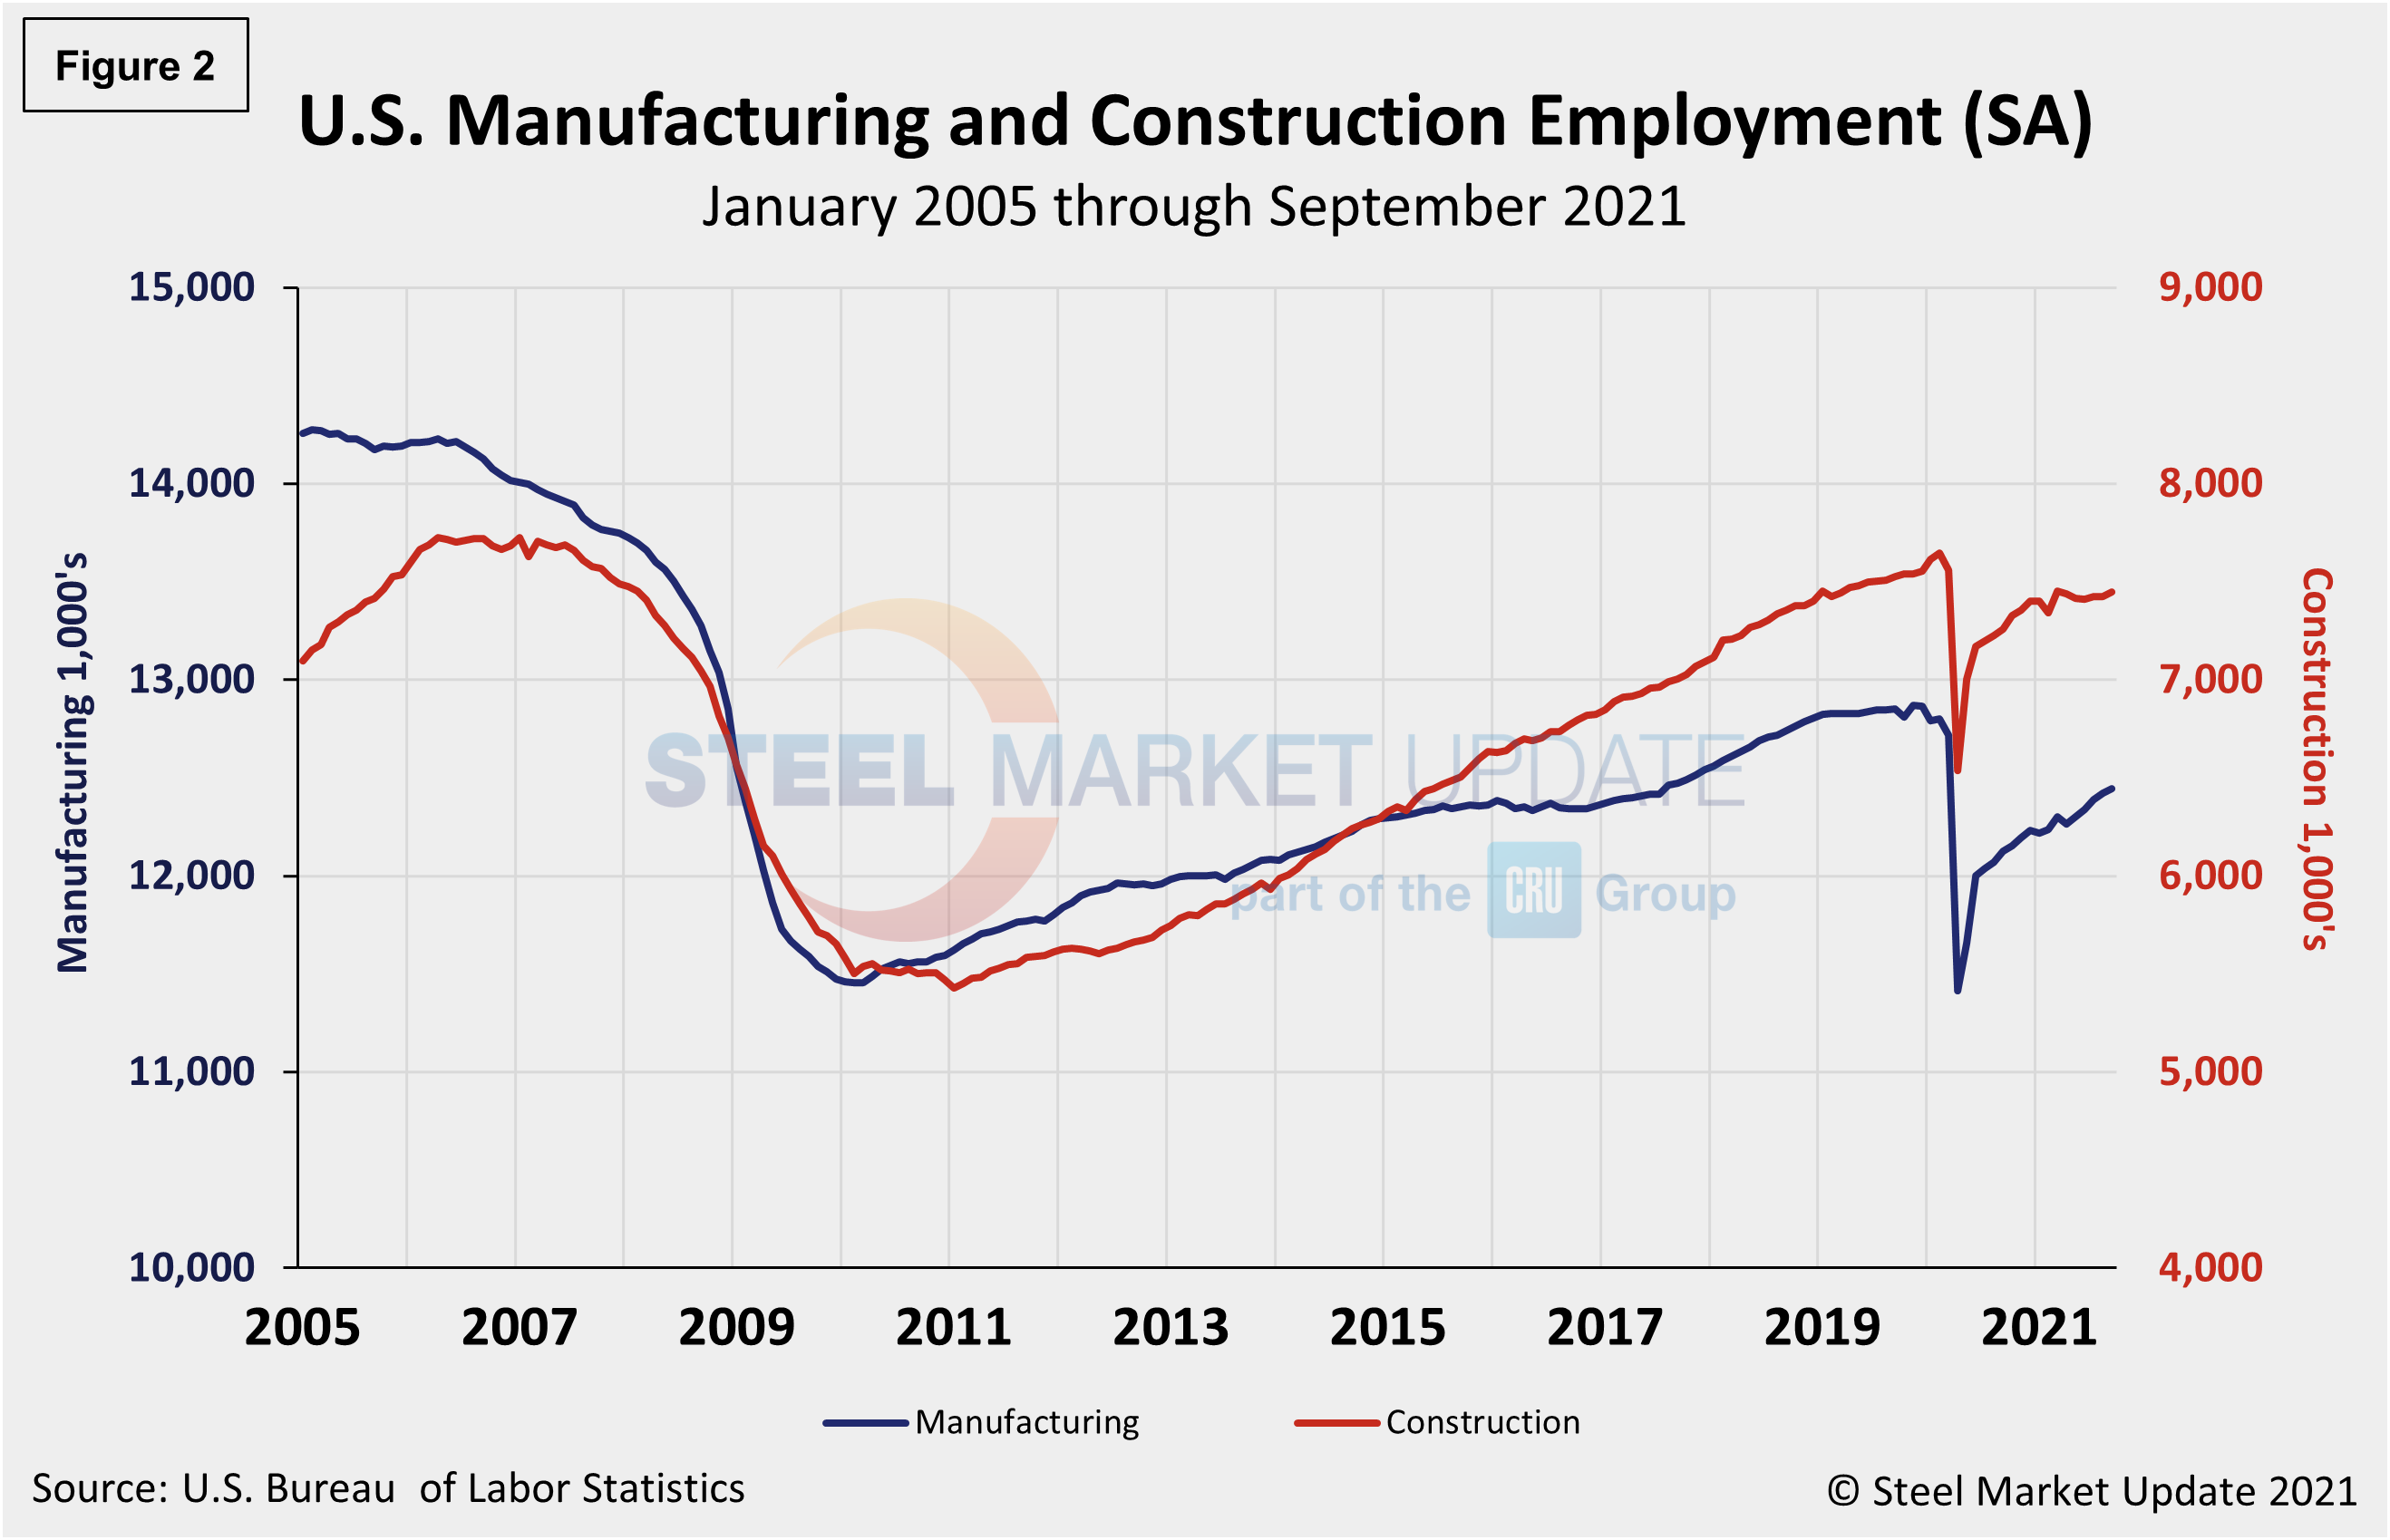
Construction employment rose by 22,000 in September, but has shown little net change thus far this year. Employment in construction is 201,000 below its February 2020 level, according to the BLS data. The history of employment in manufacturing and construction since January 2005 is show below in Figure 2, seasonally adjusted.
Industrial goods manufacturers announced the second-most job cuts in September with 2,328, and warehousing followed with 1,936. Both industries have been plagued by ongoing supply-chain issues. The services sector announced 1,679 job cuts in September, while technology companies announced 1,546.
According to human resources consulting firm Challenger, Gray and Christmas Inc, the number of job cuts and announcements are still very low. “While job cuts are at record lows, hiring announcements exploded in September, a month when many big box retailers, shipping and warehousing companies announce seasonal hiring plans. This year, many hiring announcements are for permanent workers rather than seasonal ones,” said Challenger.
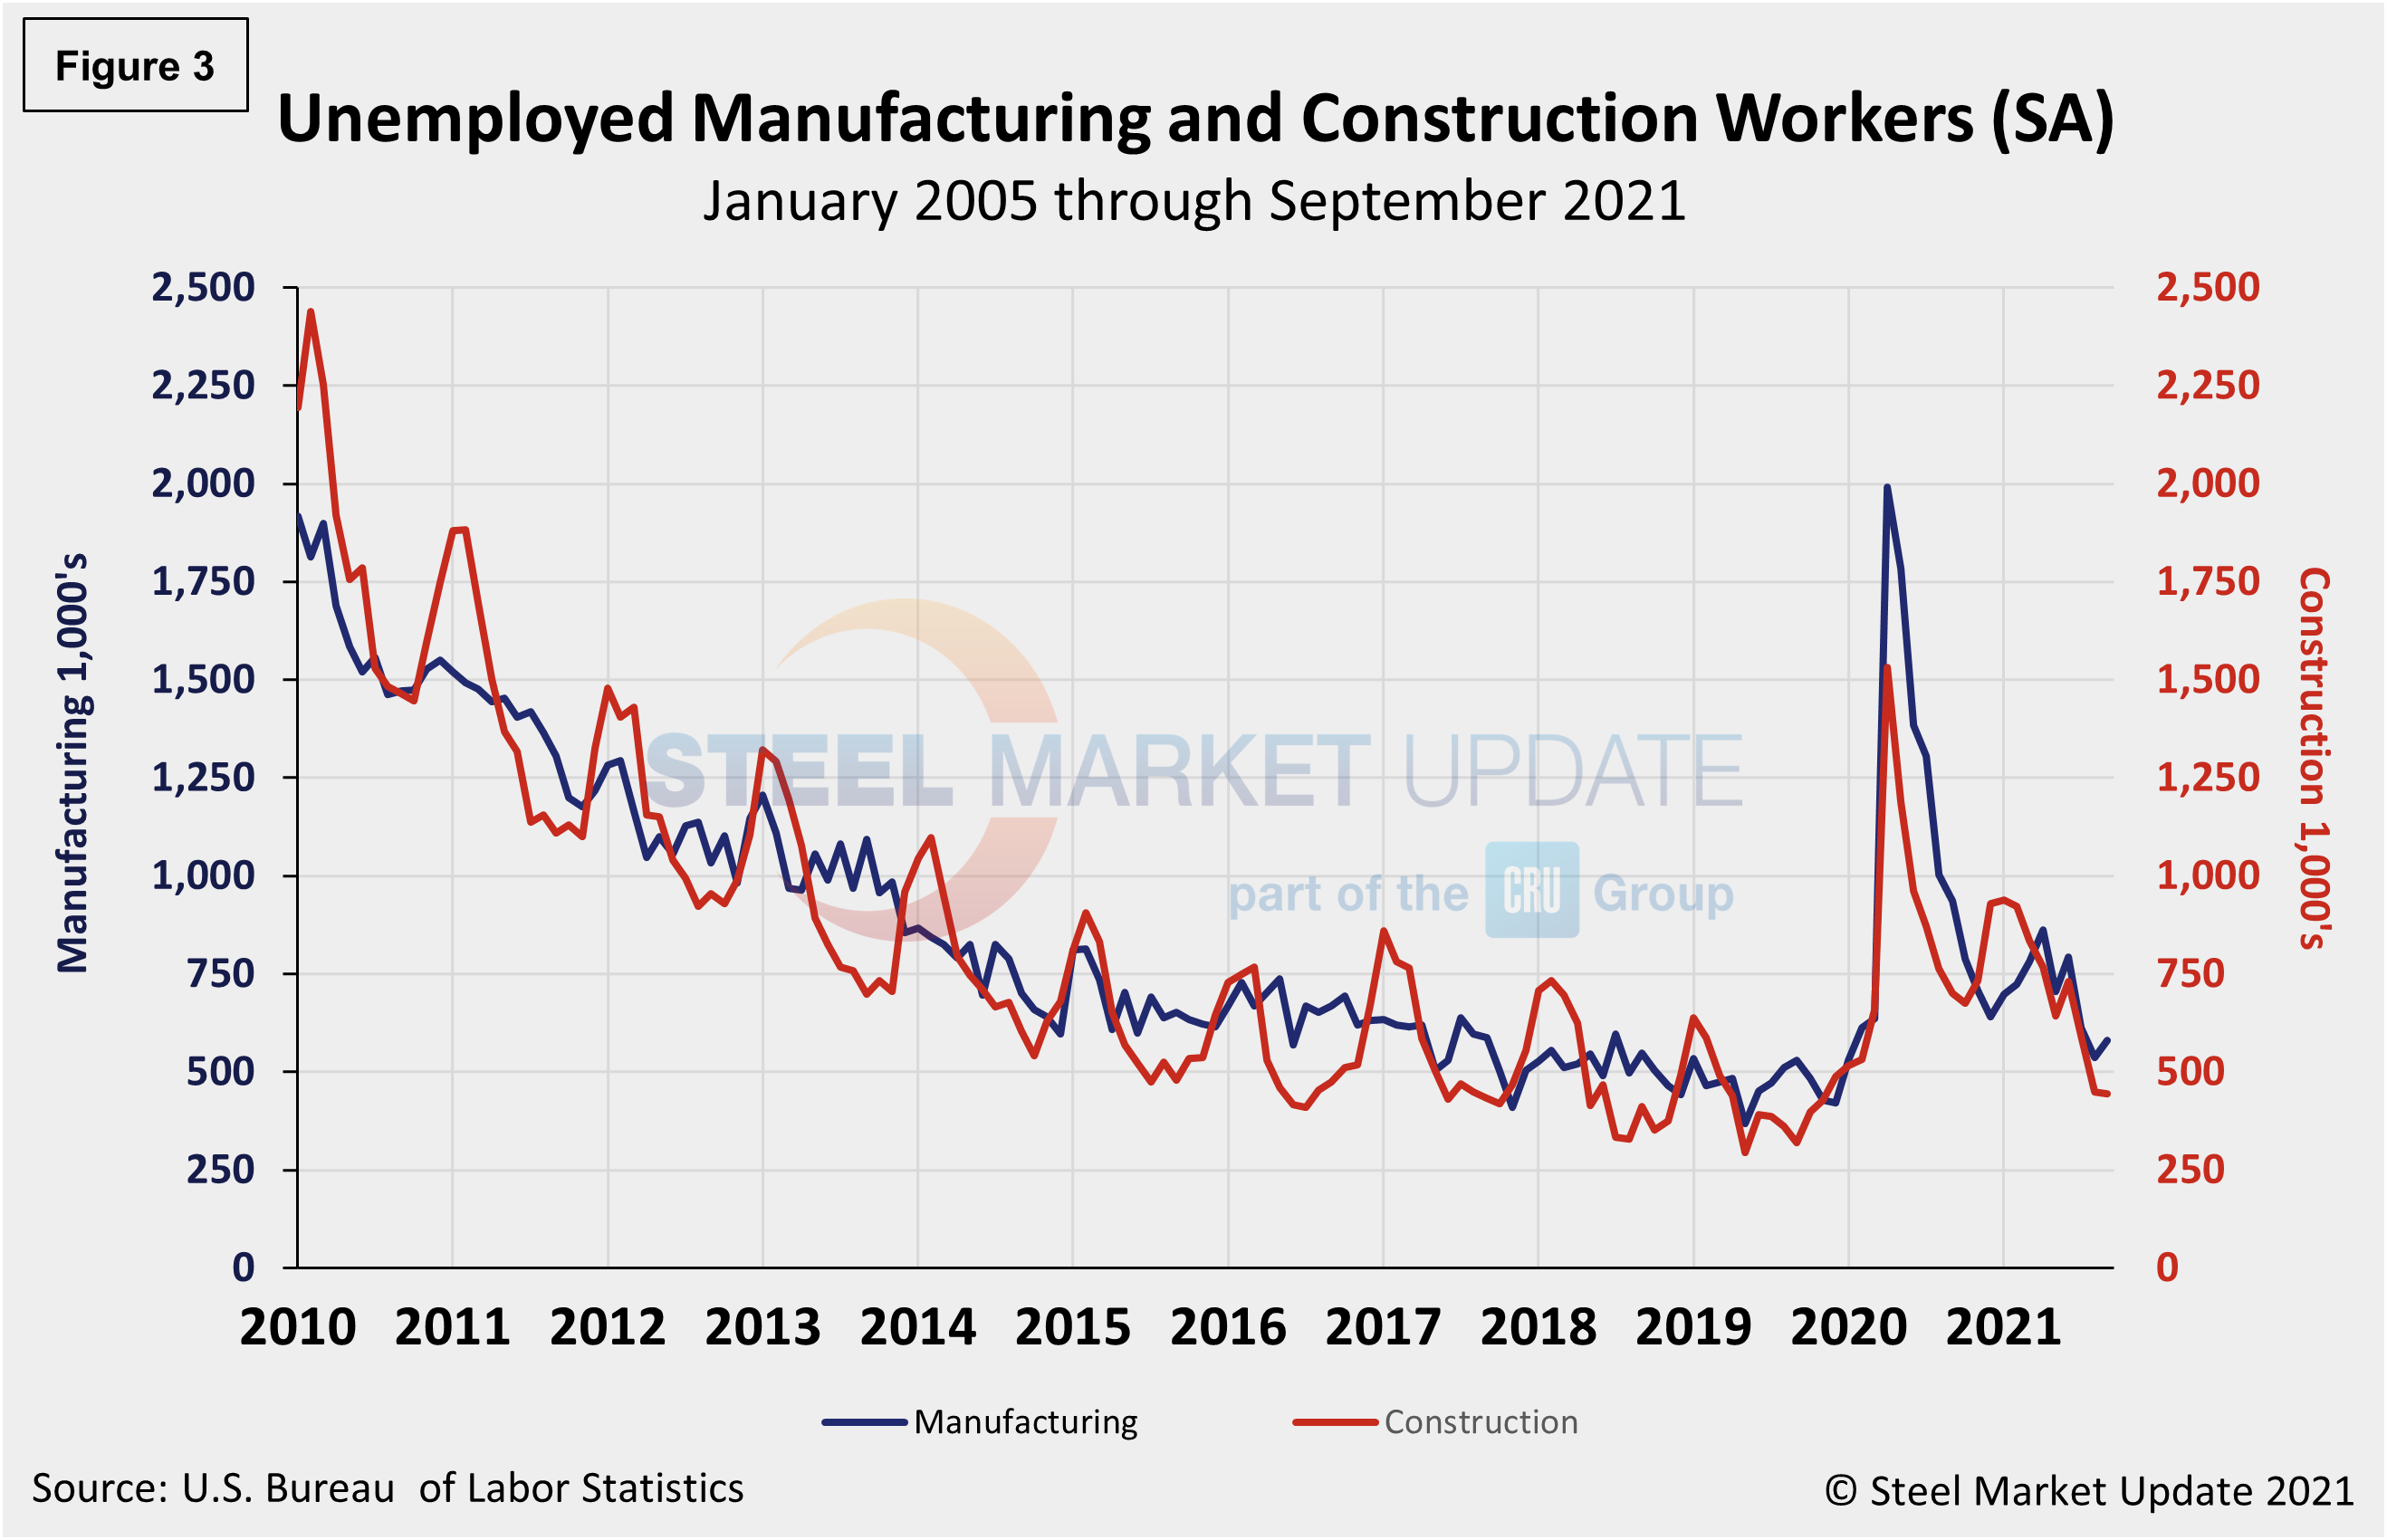
The reported number of unemployed manufacturing and construction workers is shown in Figure 3. While construction unemployment decreased in September, manufacturing unemployment rose month on month. Construction unemployment was down 0.9% month on month, from 448,000 in August to 444,000 in September. Manufacturing’s unemployed persons rose from 536,000 in August to 580,000 in September, an 8.2% increase month on month. Both sectors have been heavily impacted by supply-chain disruptions and labor force constraints.
Explanation: On the first or second Friday of each month, the Bureau of Labor Statistics releases the employment data for the previous month. Data is available at www.bls.gov. The BLS employment database is a reality check for other economic data streams such as manufacturing and construction. It is easy to drill down into the BLS database to obtain employment data for many subsectors of the economy. The important point about all these data streams is not necessarily the nominal numbers, but the direction in which they are headed.
By David Schollaert, David@SteelMarketUpdate.com


