

Market Data

October 11, 2021
U.S. Job Creation: September Report Deflating
Written by David Schollaert
U.S. job creation came up short again in September with just 194,000 added, marking the second disappointing monthly increase in a row. U.S. economic growth continued to decelerate in September on COVID concerns, driving hiring to its slowest pace since January. Surprisingly, the unemployment rate dropped to its lowest level since February 2020, down 0.3 percentage points to 4.8%, according to the Bureau of Labor Statistics (BLS).
The deflating report comes as the labor market recovery has stalled following sizable jumps in employment from May through July when more than 2.5 million jobs were added. The headline number was hurt by a 123,000 decline in government payrolls, while private payrolls increased by 317,000.
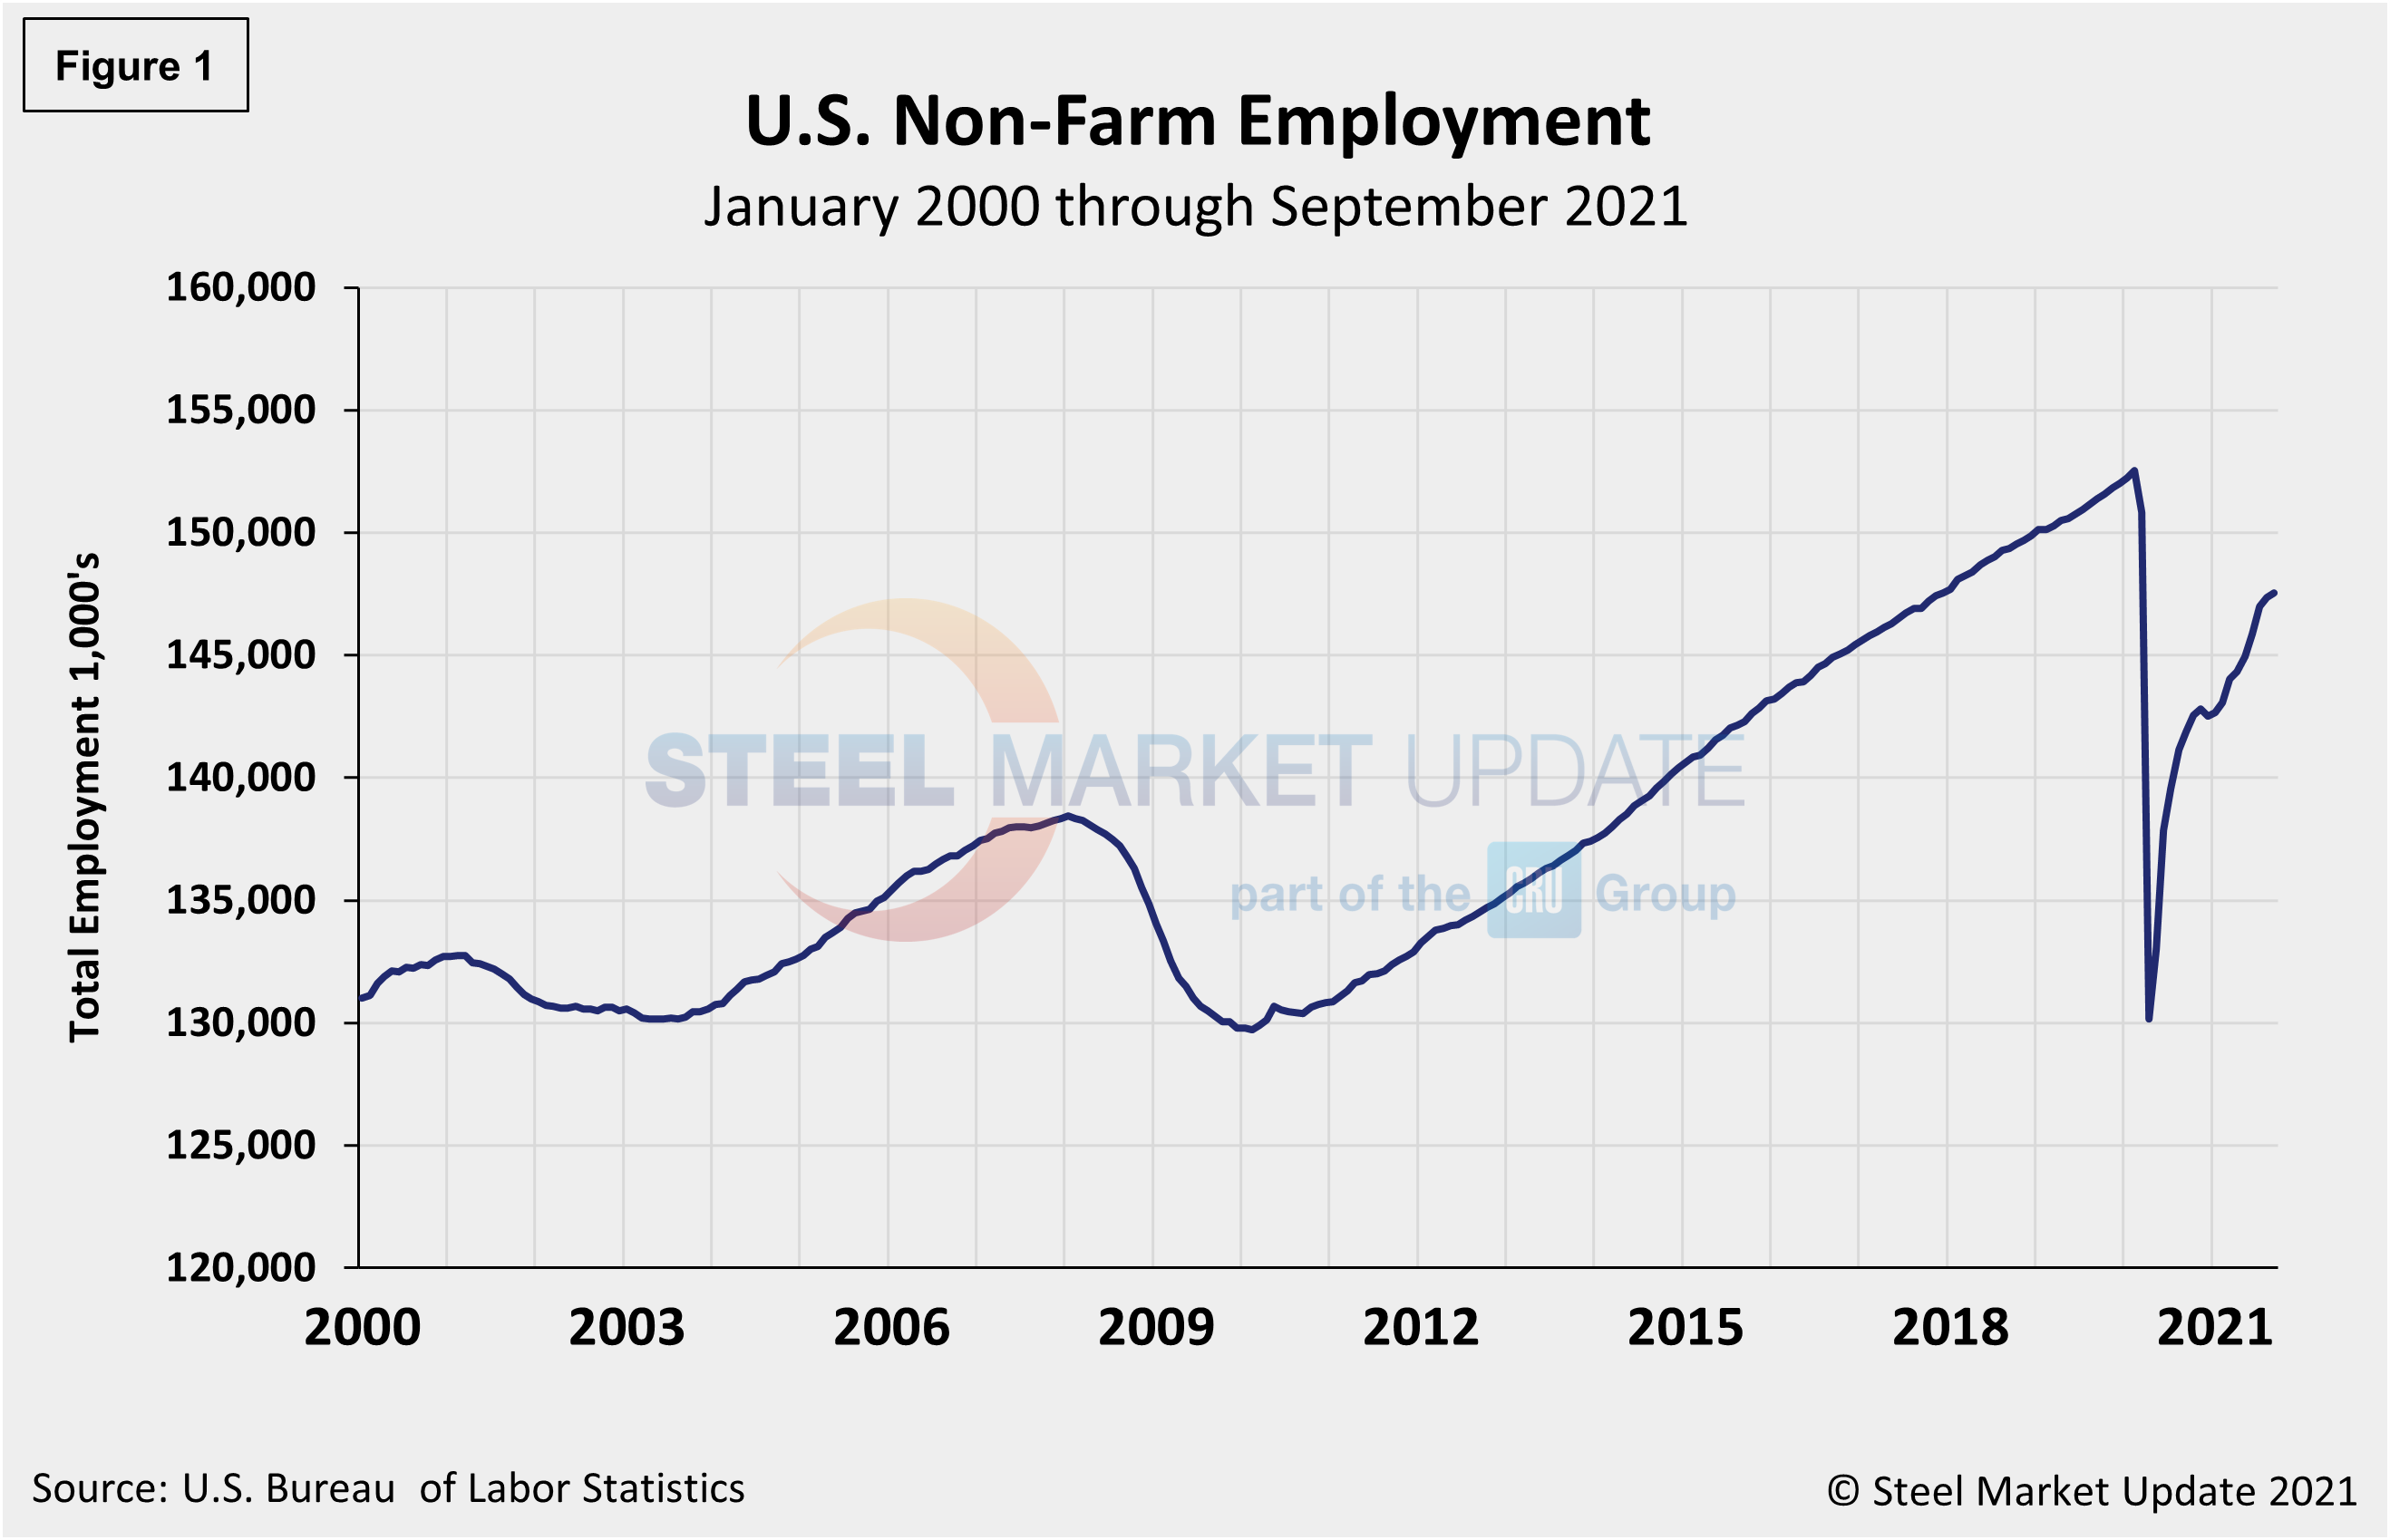
Leisure and hospitality again led job creation, adding 74,000 positions. The unemployment rate for the sector fell to 7.7% from 9.1%, while professional and business services contributed 60,000, and retail increased by 56,000. Added job gains were spread across a variety of other sectors, including transportation and warehousing, which rose by 47,000, while information gained 32,000 jobs. Social assistance payrolls increased by 30,000, manufacturing improved by 26,000 positions, construction added 22,000 jobs and wholesale trade increased by 17,000. Local government education jobs fell by 144,000. Figure 1 shows the total number of nonfarm workers employed in the U.S. since 2000.
The tepid September jobs report adds to growing evidence the recovery has slowed, yet record U.S. job openings show there’s plenty of demand for labor. And with the Delta variant of COVID starting to fade, companies may be feeling even greater urgency to add staff.
The number of long-term unemployed (out-of-work for at least 27 consecutive weeks) decreased by nearly 500,000 in September, while the employment-to-population level increased to 58.7%, its highest since March 2020. The labor force participation rate slipped 0.1 percentage point to 61.6%, still well below the 63.3% in February 2020, the month before the pandemic hit.
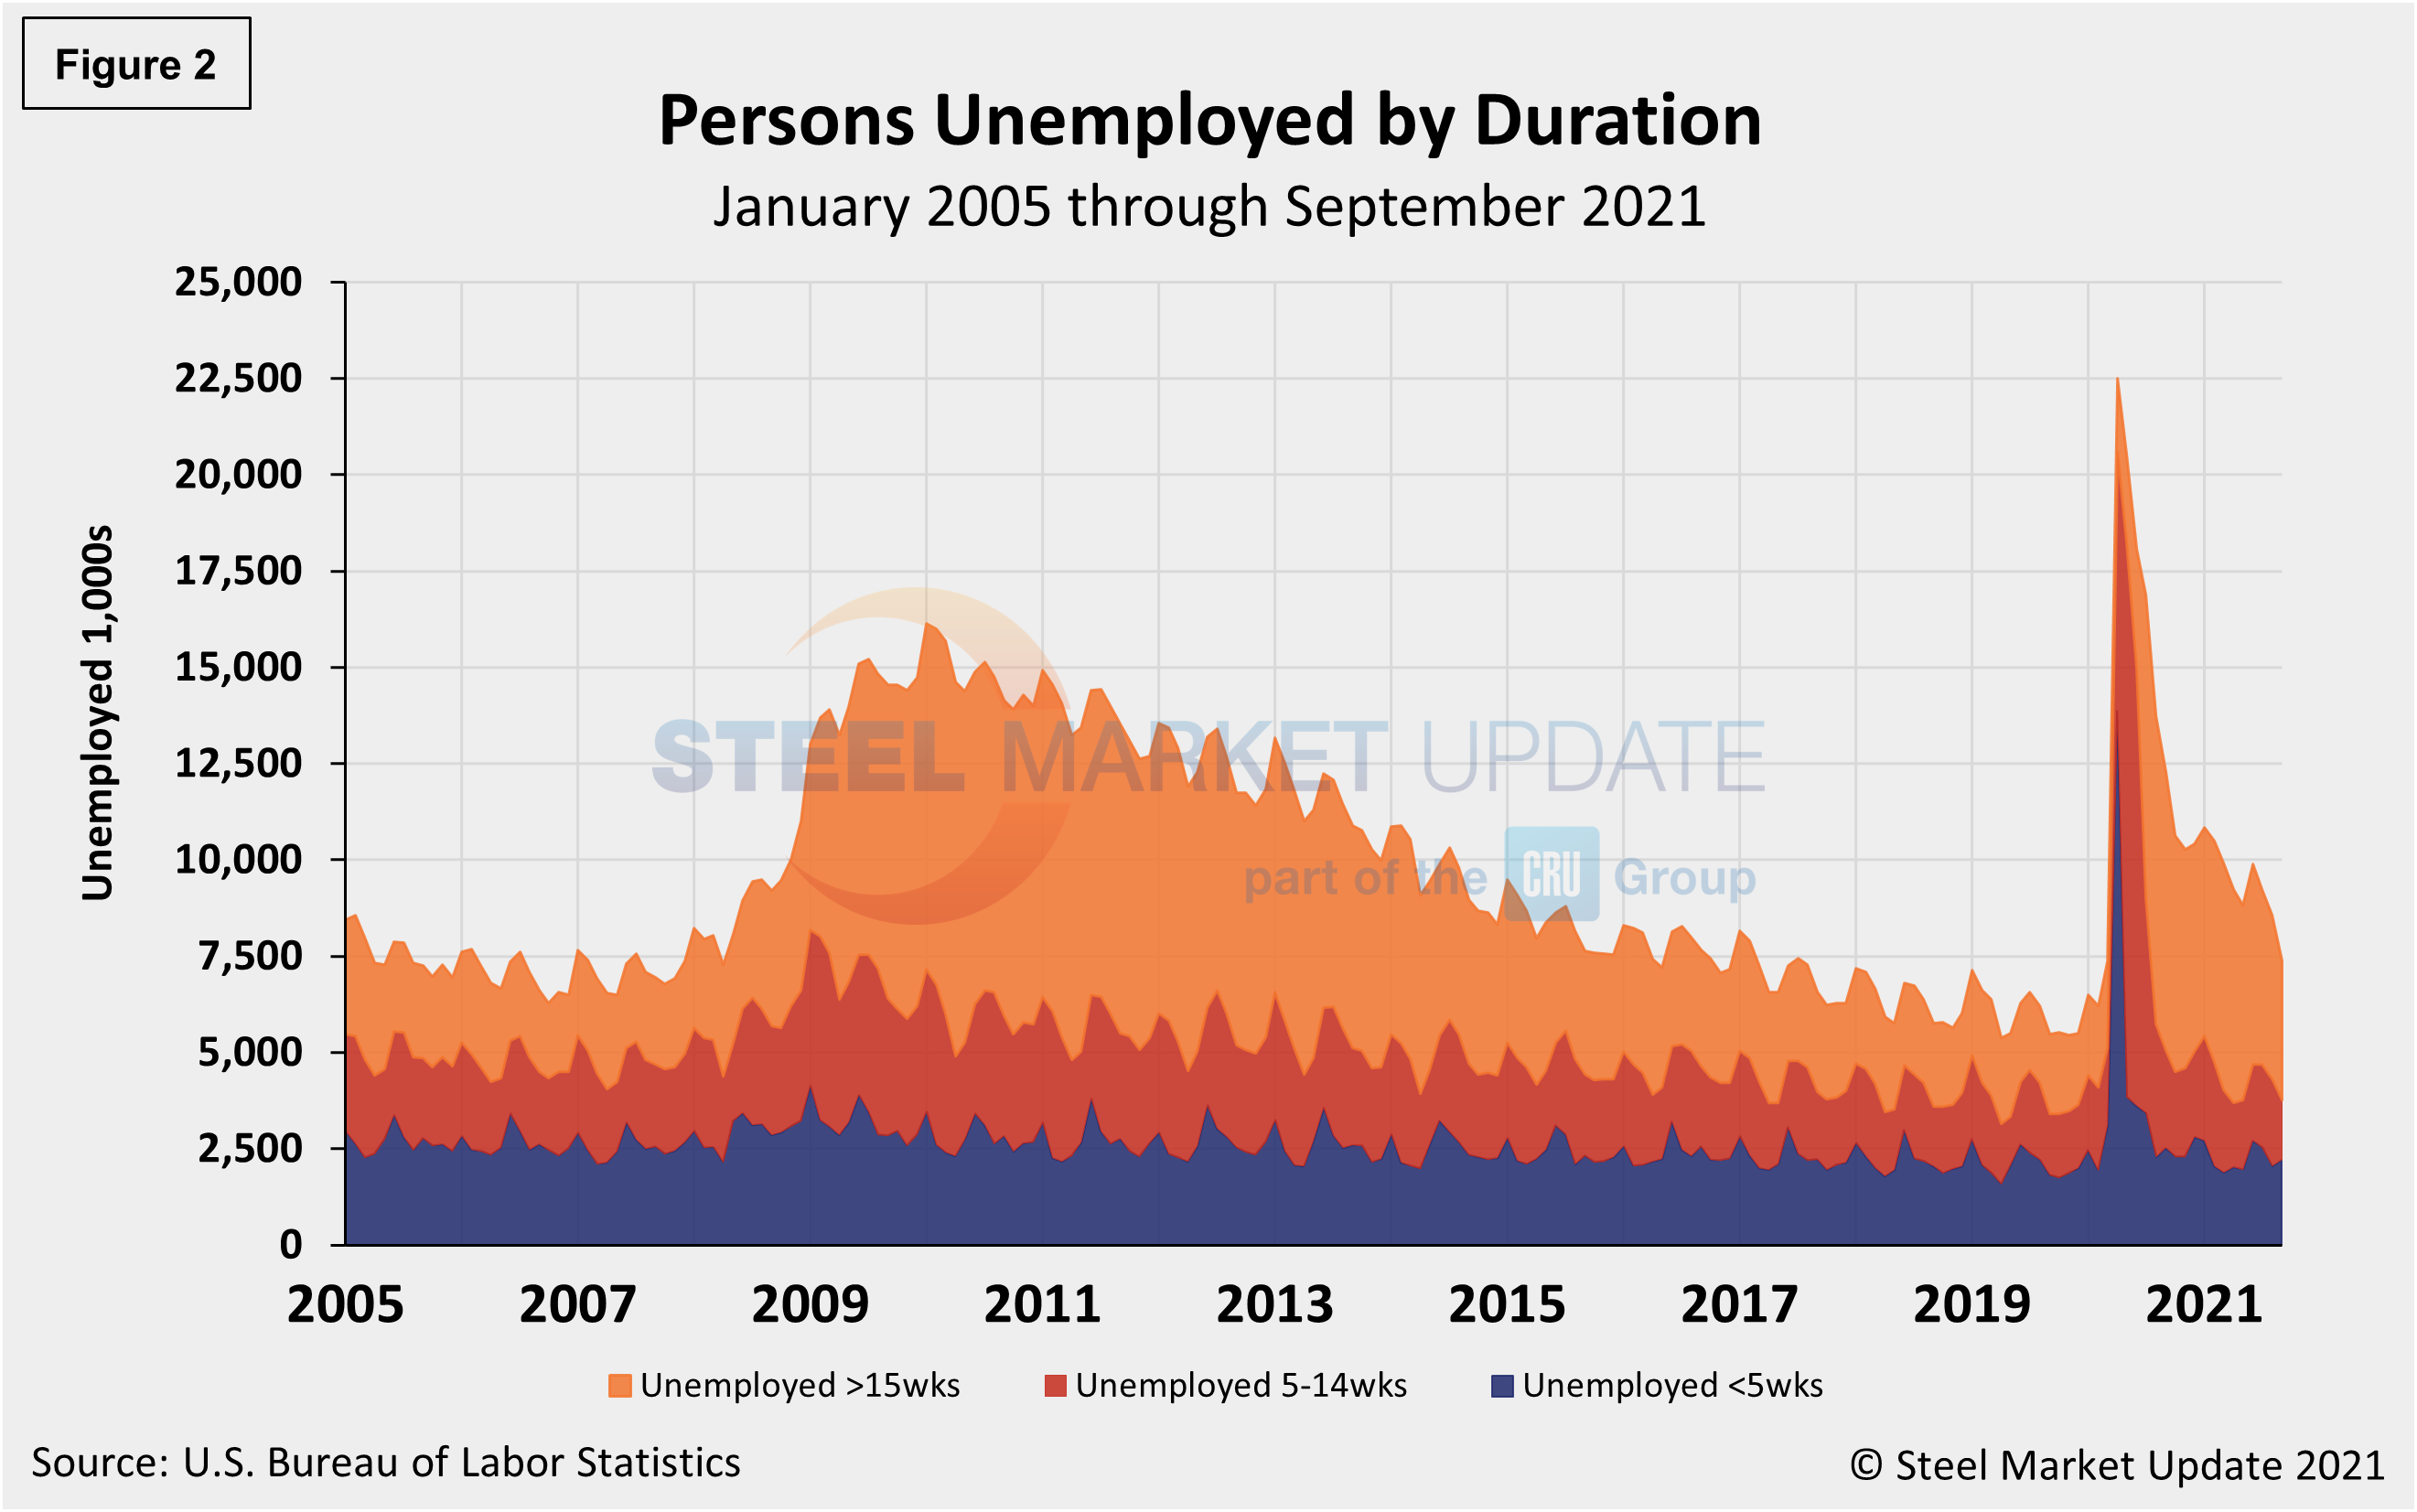
The historical picture for the duration of unemployment since January 2000 is broken down into <5 weeks, 5 to 14 weeks, and >15 weeks, noted below in Figure 2. The total number unemployed was 7.366 million at the end of September, a decrease of 1.190 million compared to August. Although unemployment remains above pre-pandemic levels by roughly 1.148 million people, about 15.1 million more people now have jobs compared to the 22.5 million thrown out of work during the worst of the pandemic in April of 2020. As of Oct. 11, 48.8% had been unemployed for more than 15 weeks, 21.2% for 5 to 14 weeks, and 30.0% for less than 5 weeks.
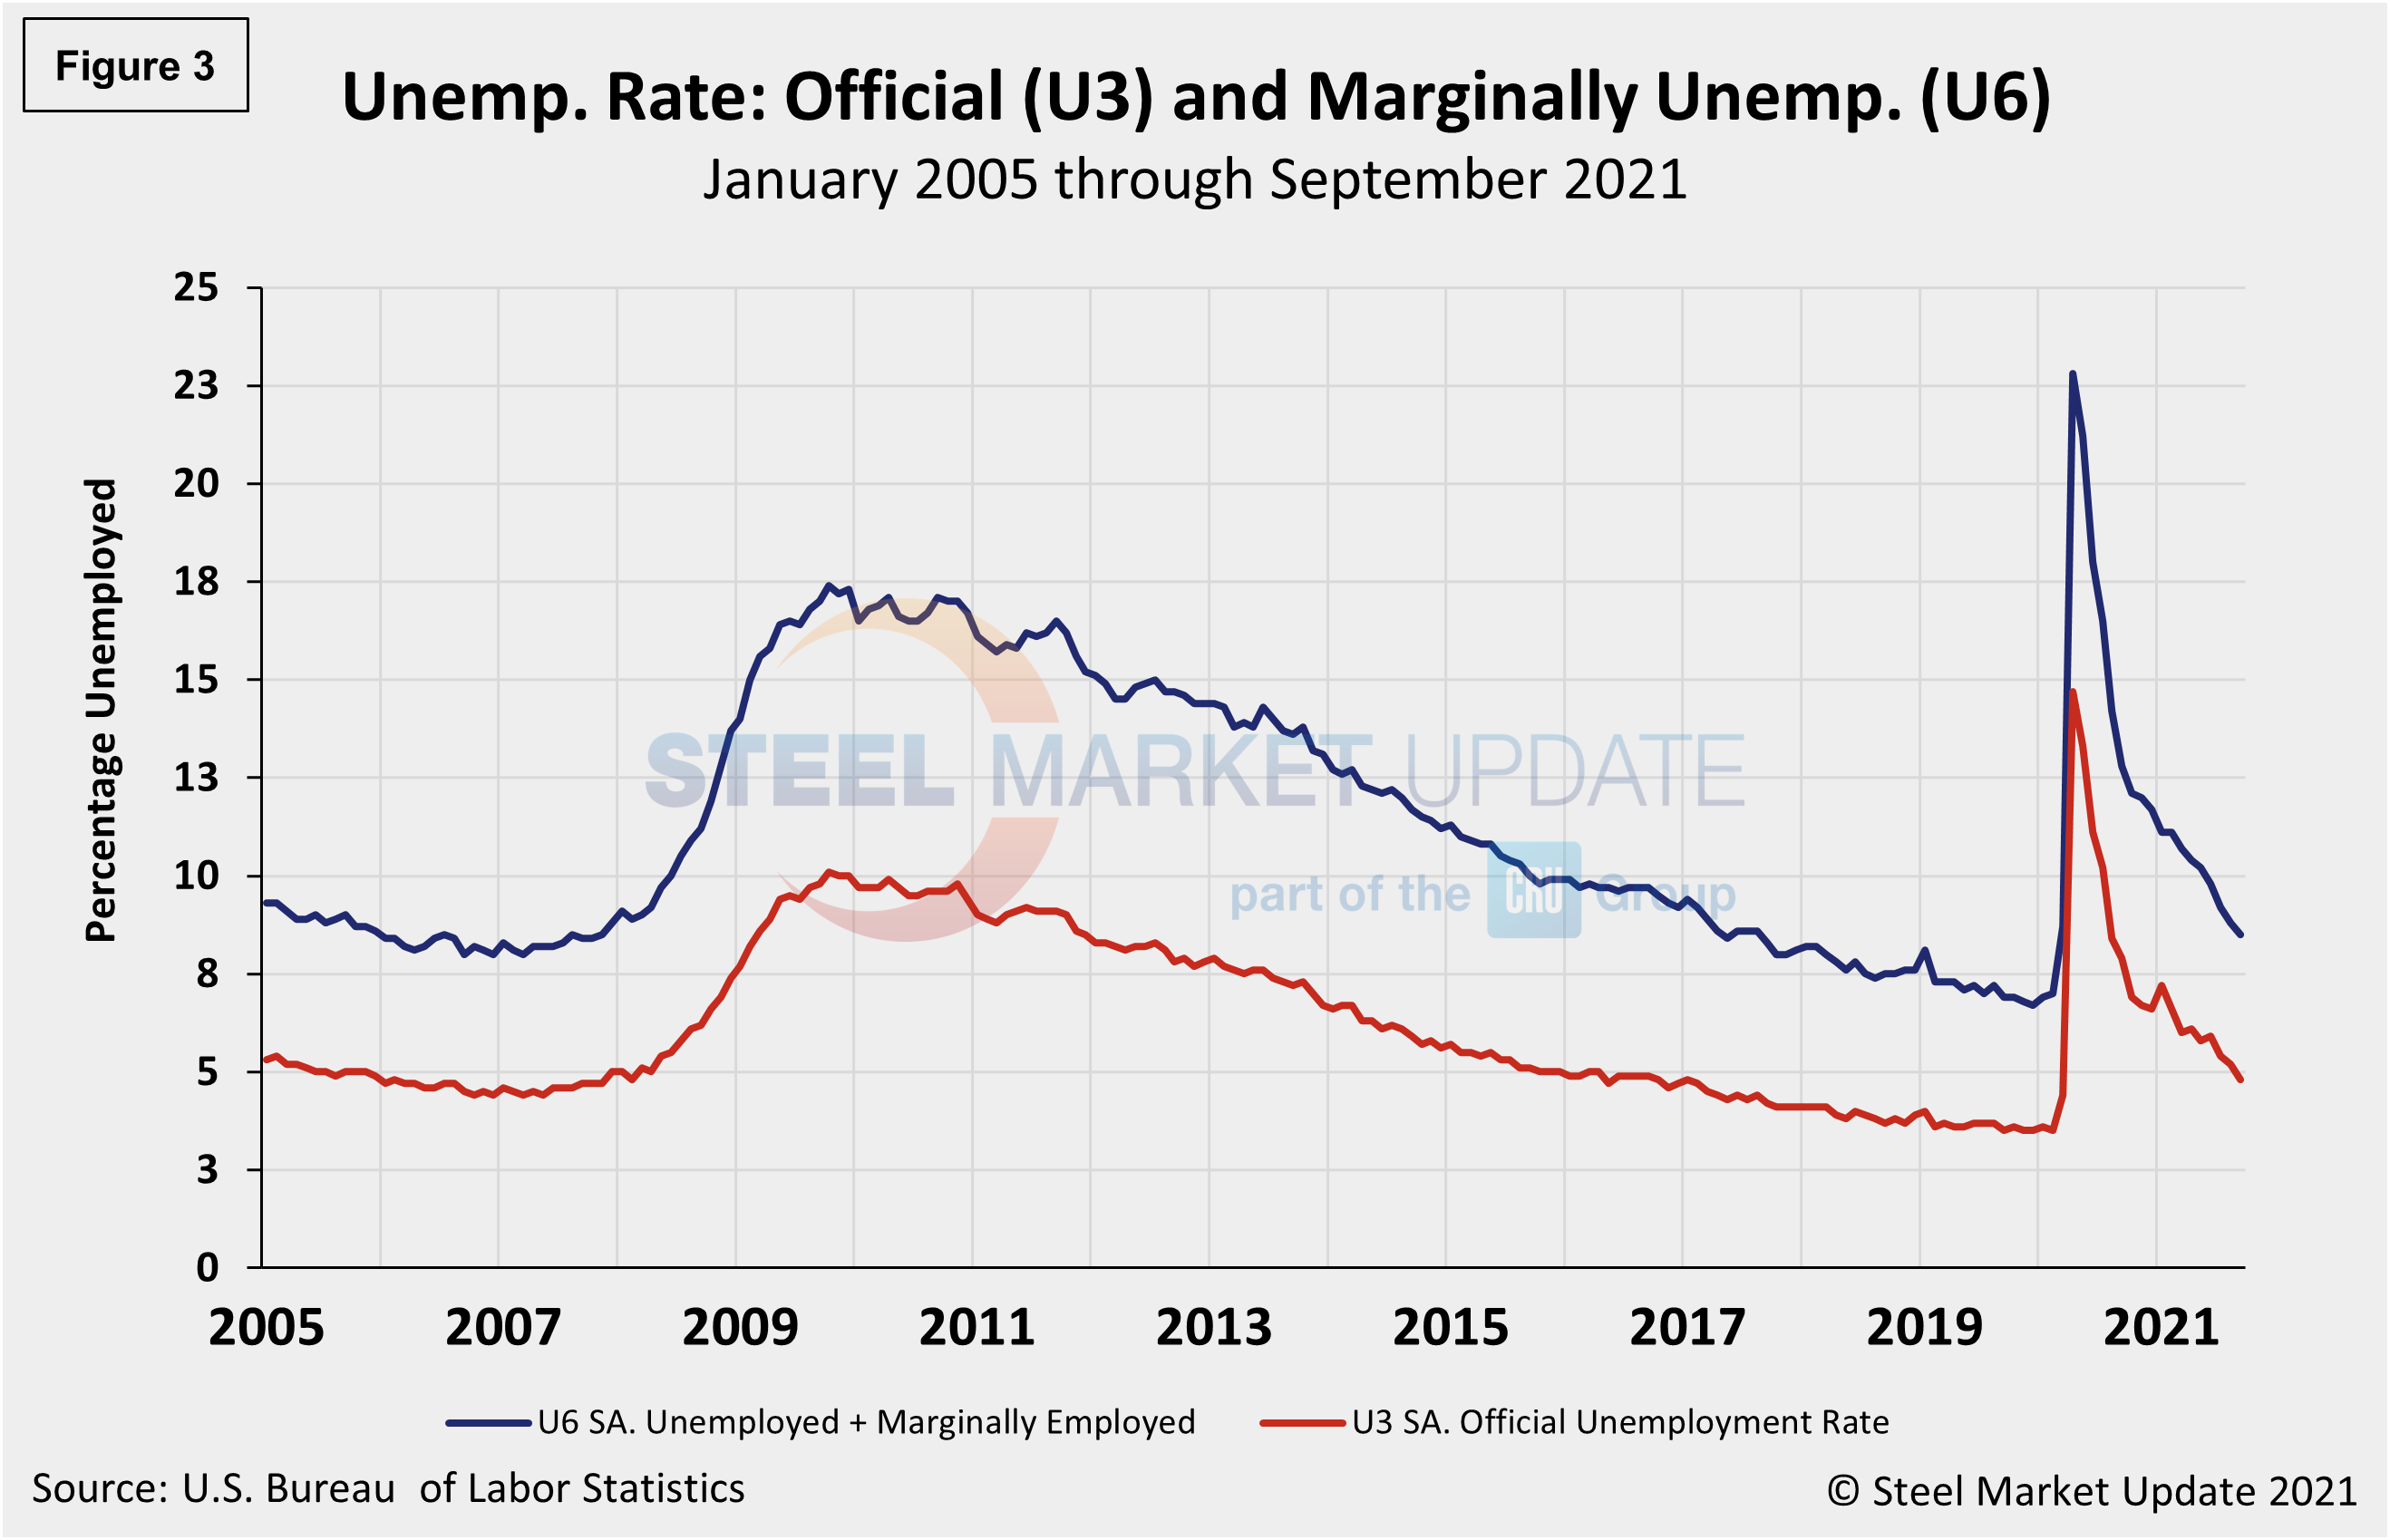
The official unemployment rate, U3, reported in the BLS Household survey (see explanation below) increased from 3.5% in February 2020 to 14.7% in April 2020. Since then, it has trended down at a slow pace. September’s fall to 4.8%, however, was the lowest mark in 17 months as approximately 194,000 people re-entered the labor force. At the same time, the labor force shrank by 183,000 in September, partly explaining the drop in the level of unemployment. The more comprehensive U6 unemployment rate also dipped last month to 8.5% from 8.8% in August – a continued improvement from 22.8% in April 2020 (Figure 3). U6 includes individuals working part time who want full-time work and those who want to work but are so discouraged they have stopped looking.
The drop in the headline unemployment rate followed a dip in the labor force participation rate, down 0.1 of a percentage point to 61.6%, and still well below the 63.4% in January 2020.
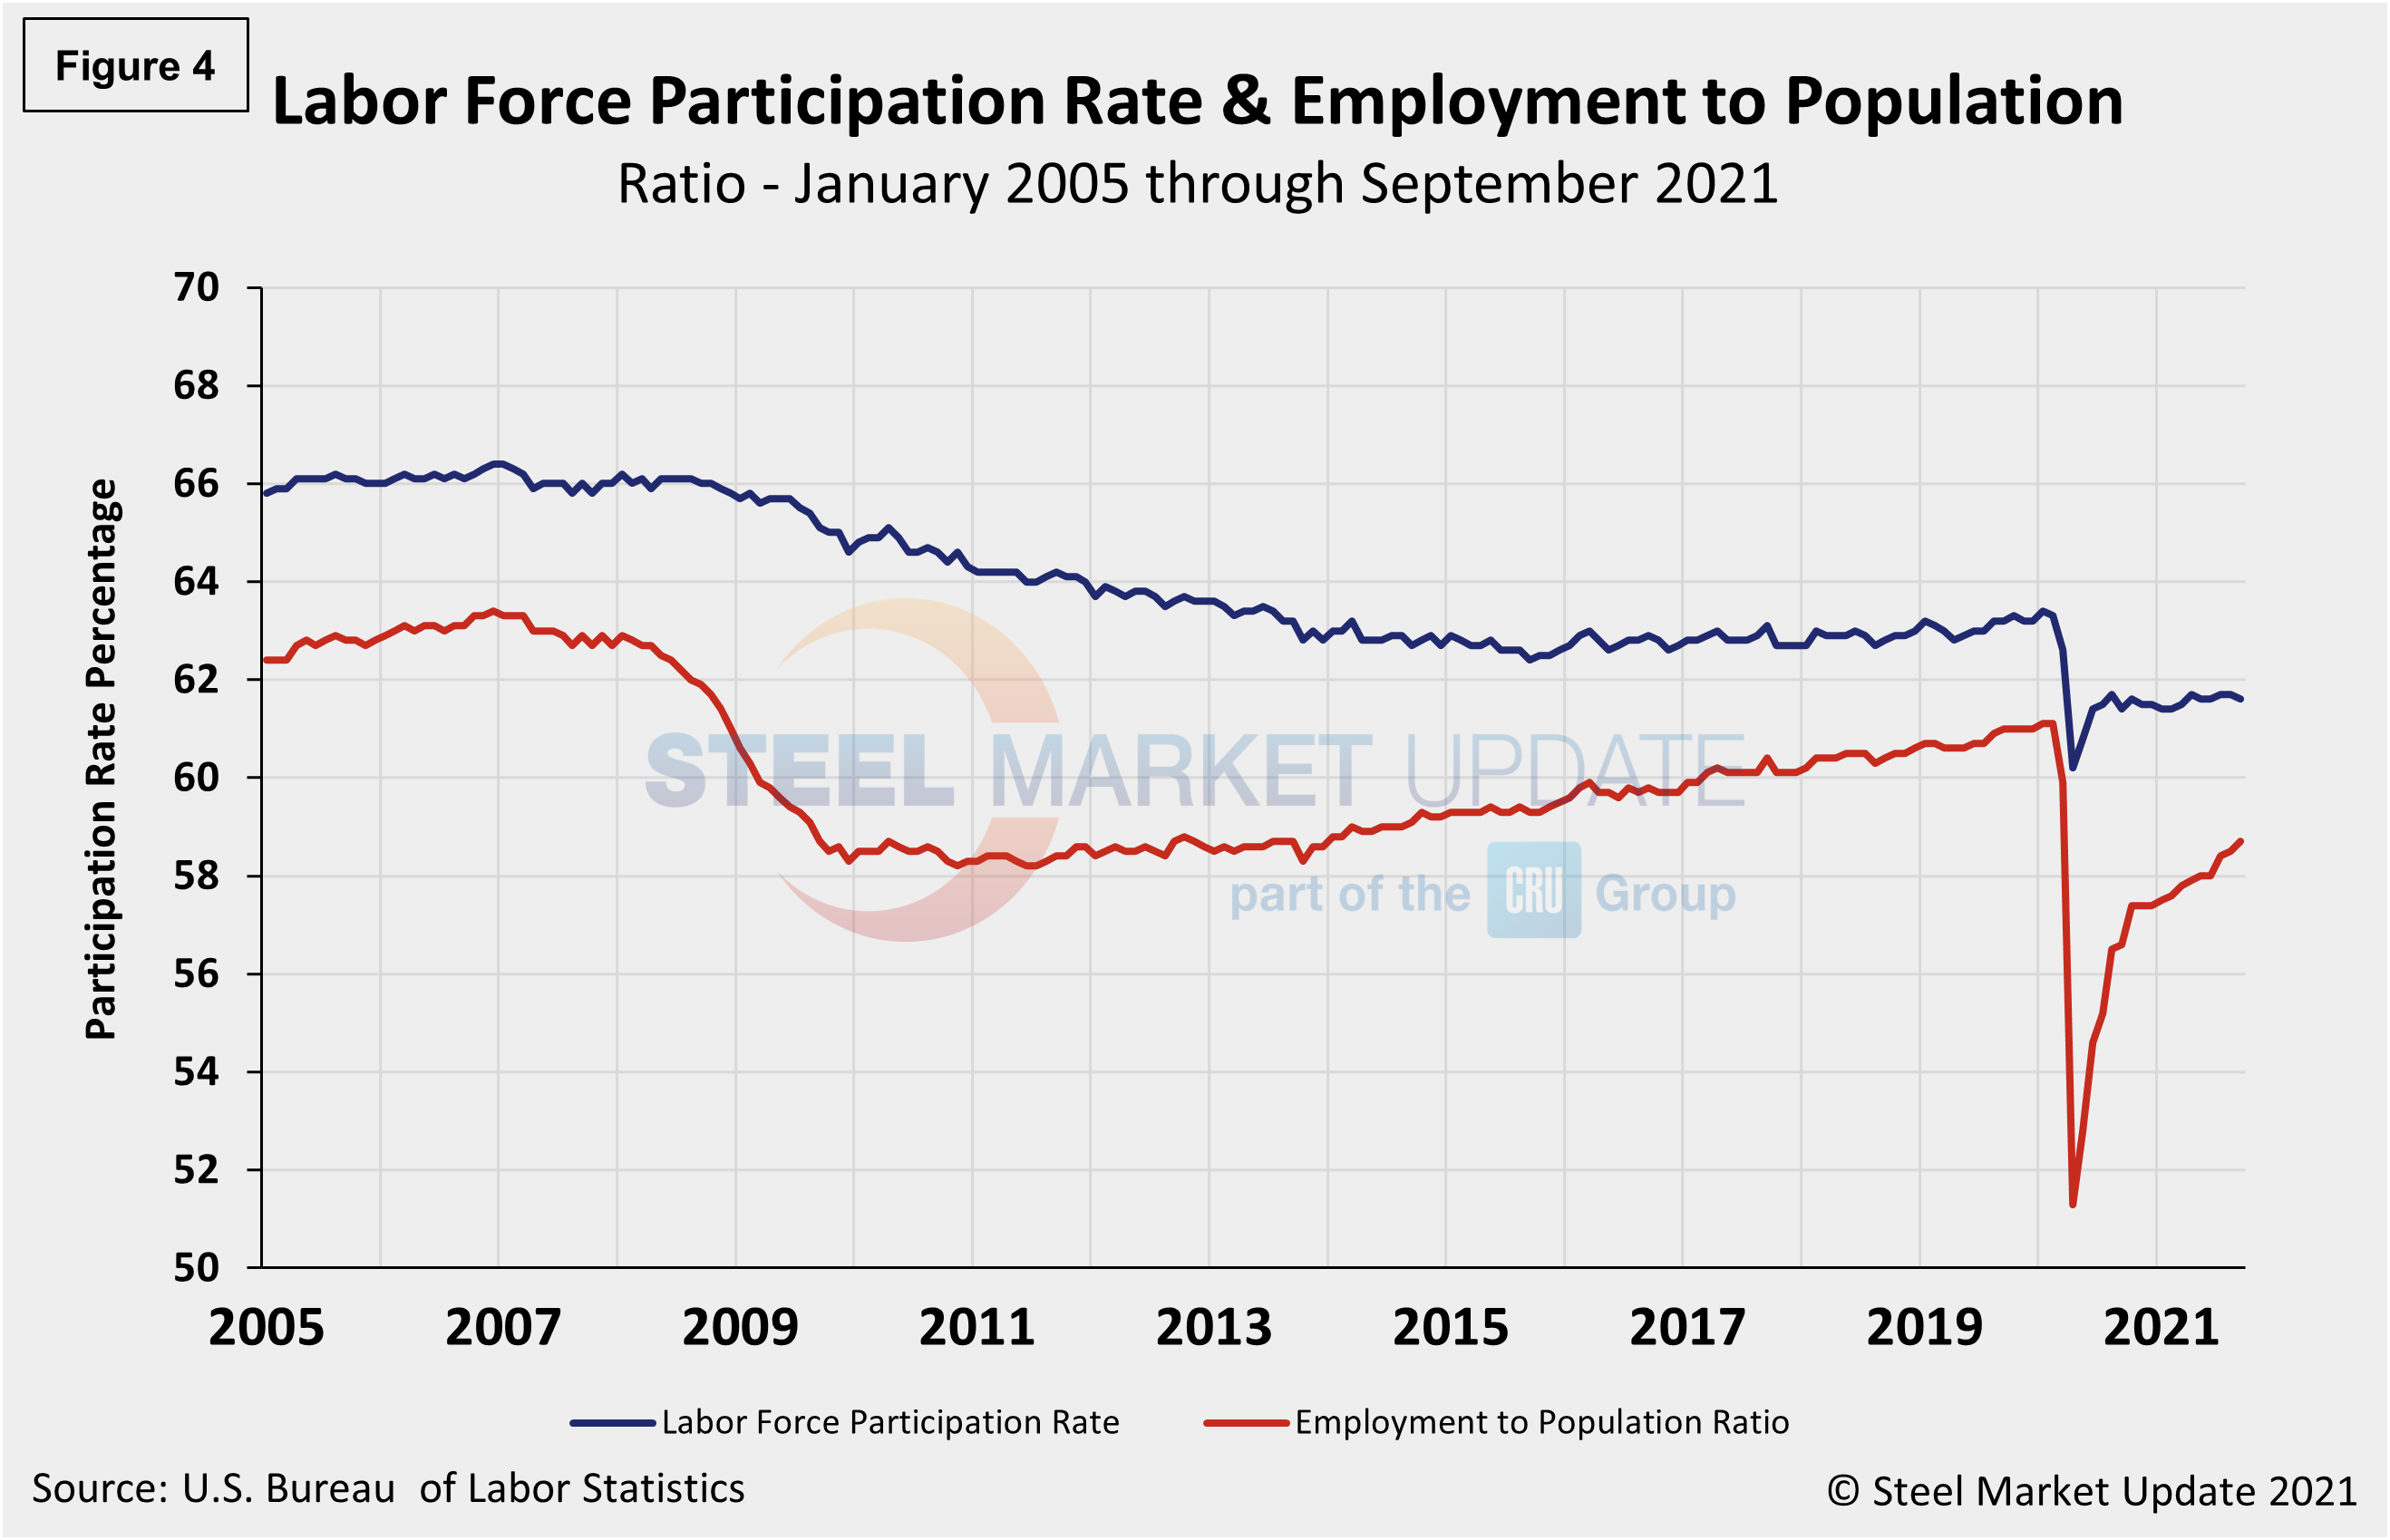
Another gauge, and more definitive view, are the number employed as a percentage of the population. Last month, the employment-to-population ratio was 58.7%, a marginal increase from August when the ratio was 58.5%, highlighting the challenges many companies continue to report in filling openings. Figure 4 shows both measures on one graph.
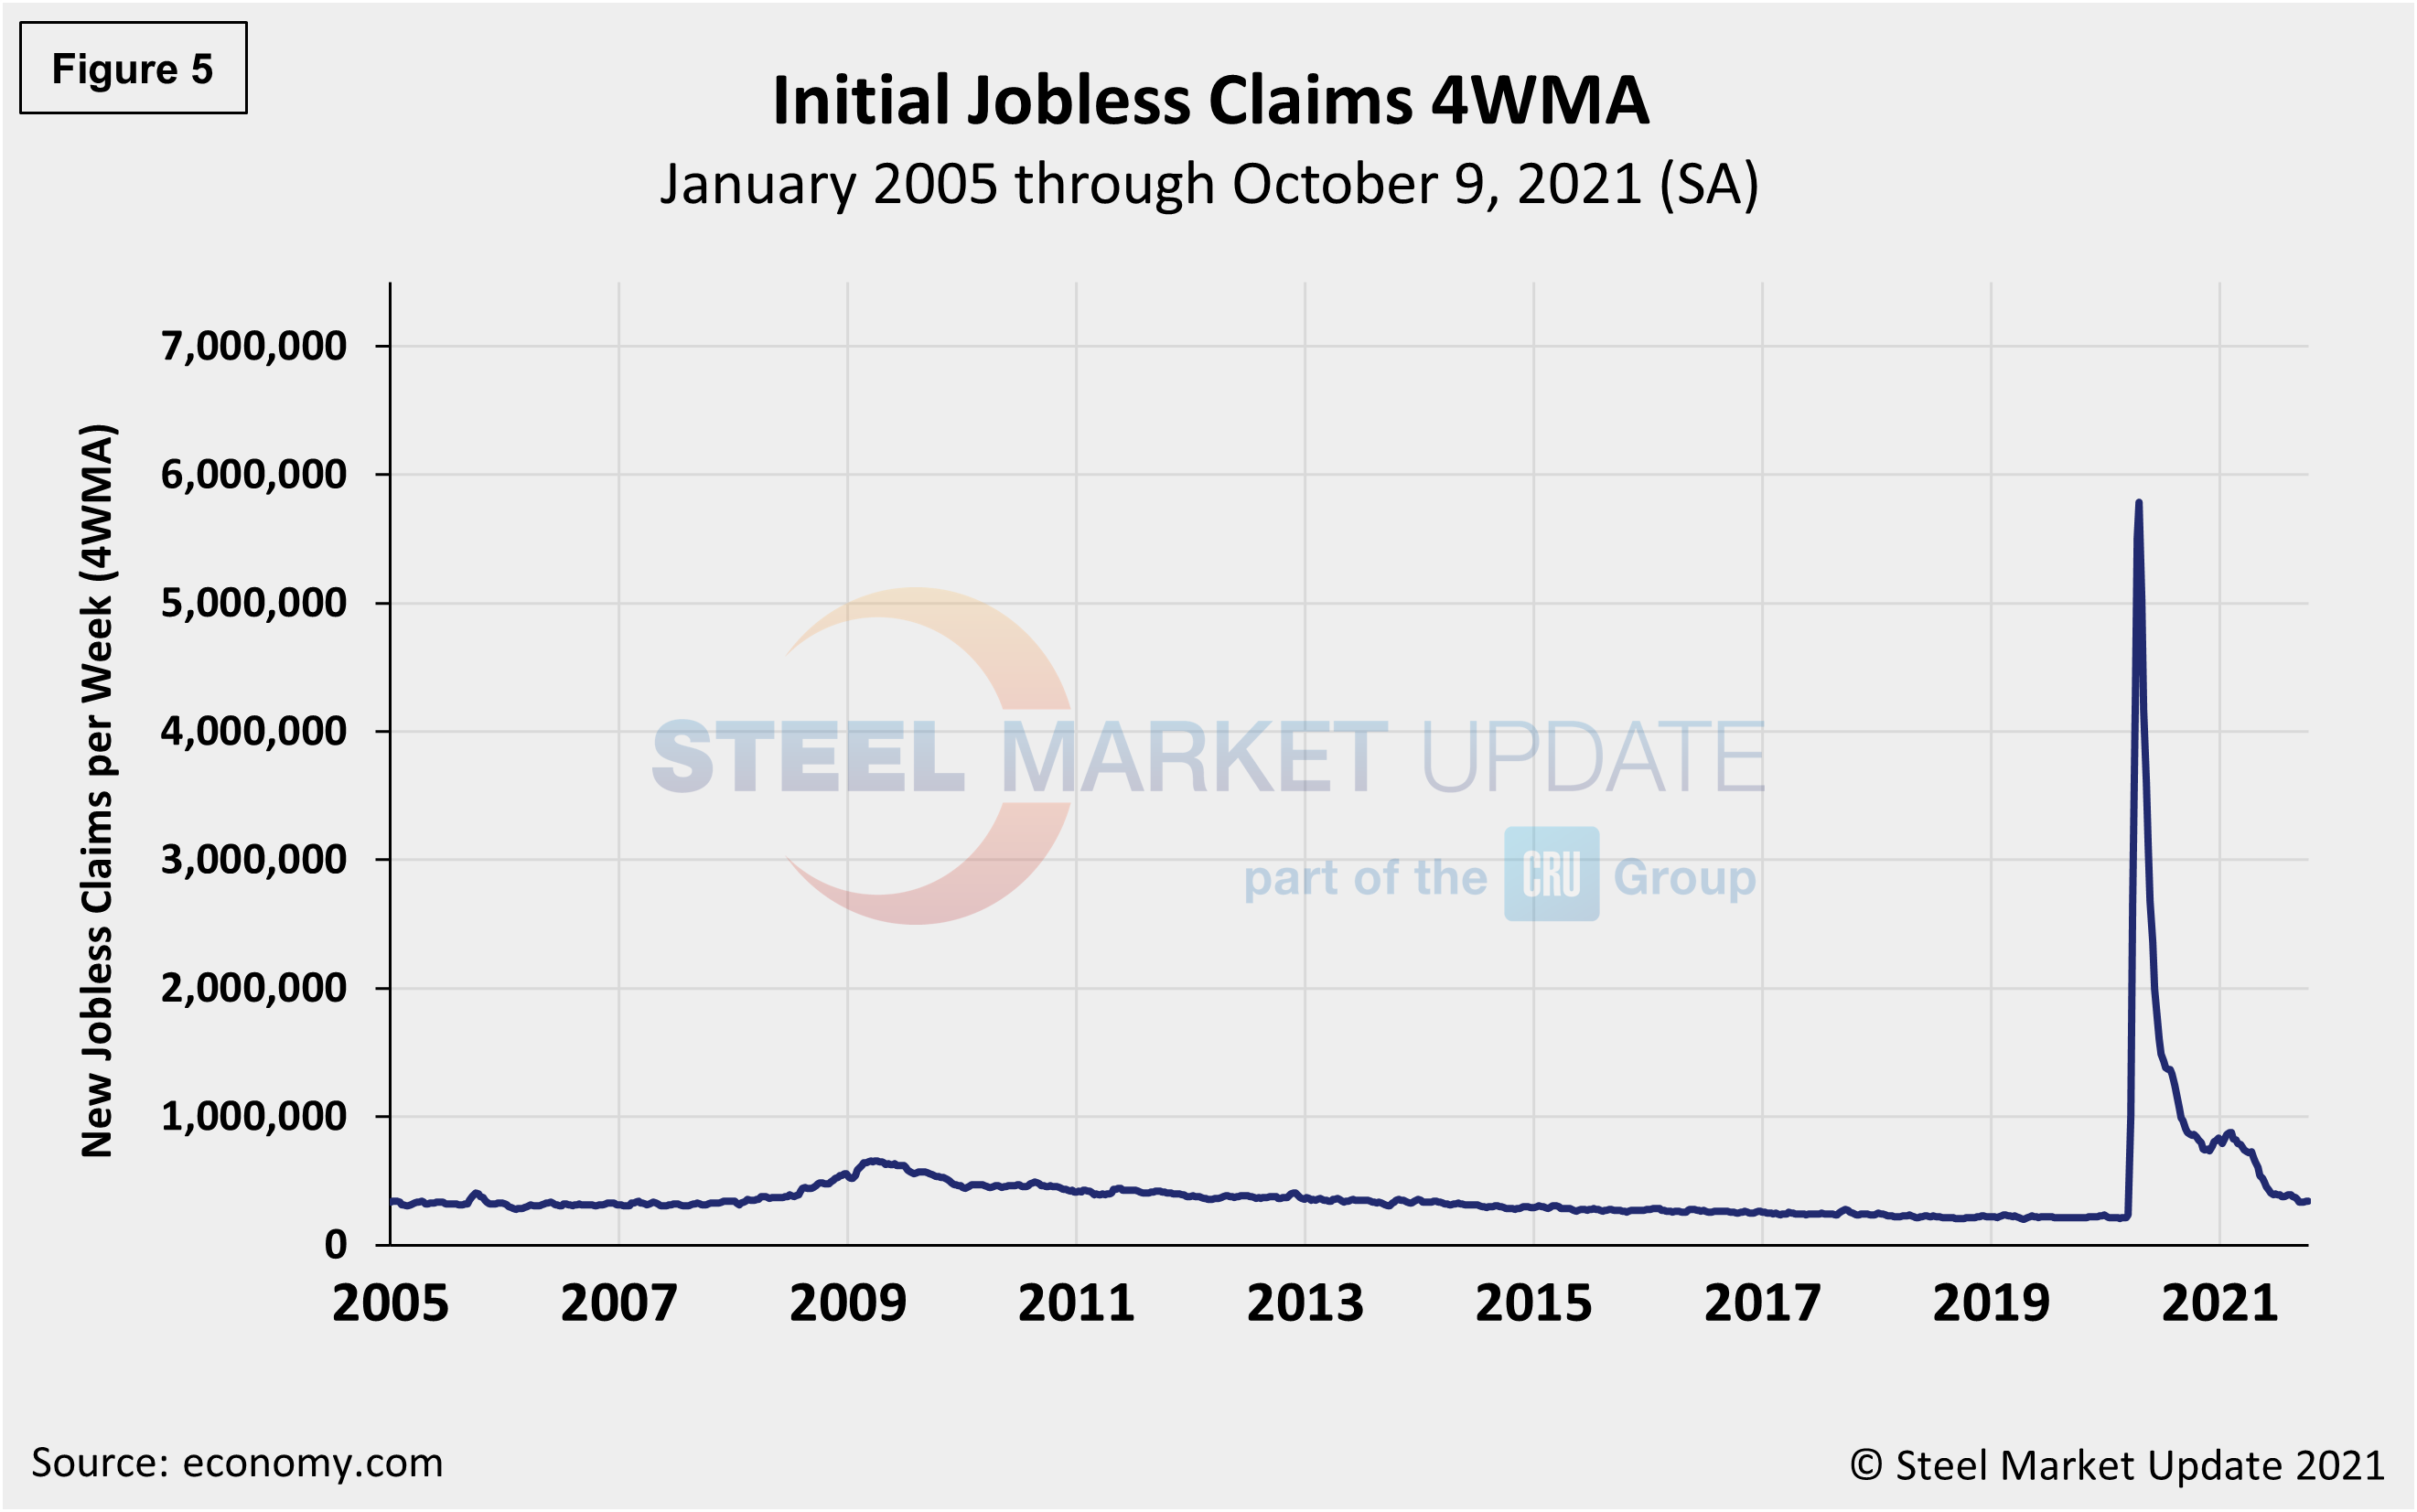
Initial claims for unemployment insurance, which are reported weekly by the Department of Labor, declined by 36,000 to 326,000 in the week ended Oct. 9, following increases of 52,000 over the three prior weeks.
“U.S. initial claims for unemployment insurance benefits fell more than anticipated, but they have been bouncing around recently because of California,” reported Economy.com. “New filings totaled 326,000 in the week ended Oct. 2, compared with the revised 364,000 in the previous week. The advance state claims data show a drop in California after new filings in the state had risen during the past couple of months. The four-week moving average in U.S. initial claims increased by 3,500 to 344,000. The number of those filing for Pandemic Unemployment Assistance increased by 5,766 to 23,453. Continuing claims fell by 97,000 to 2.714 million in the week ended Sept. 25 while the four-week moving average fell by 34,500 to 2.765 million. The insured unemployment rate slipped from 2.1% to 2%.”
The recent change in initial claims continues to point to a recovering labor market. Figure 5 shows the four-week moving average of new claims since January 2005, seasonally adjusted.
Human resources consulting firm Challenger, Gray and Christmas Inc. produces a monthly employment update for the U.S. It reported that job cuts in September were 17,895, up 14.0% from the 15,723 cuts reported the prior month. September’s total is 85.0% lower than the same year-go period when 118,804 cuts were announced. Employers announced 52,560 job cuts in the third quarter, the lowest quarterly total since the second quarter of 1997, when 51,309 cuts were recorded. Figure 6 shows the monthly job cuts reported by Challenger on a 3MMA basis since January 2007.
“Companies are in hiring and retention mode, and job seekers have a lot of power to make demands at the moment,” said Challenger. “We know there are millions of open positions, but many employers are having trouble keeping up with their applicants, taking too long to reach out, not making offers fast enough, or losing out to more attractive offers.”
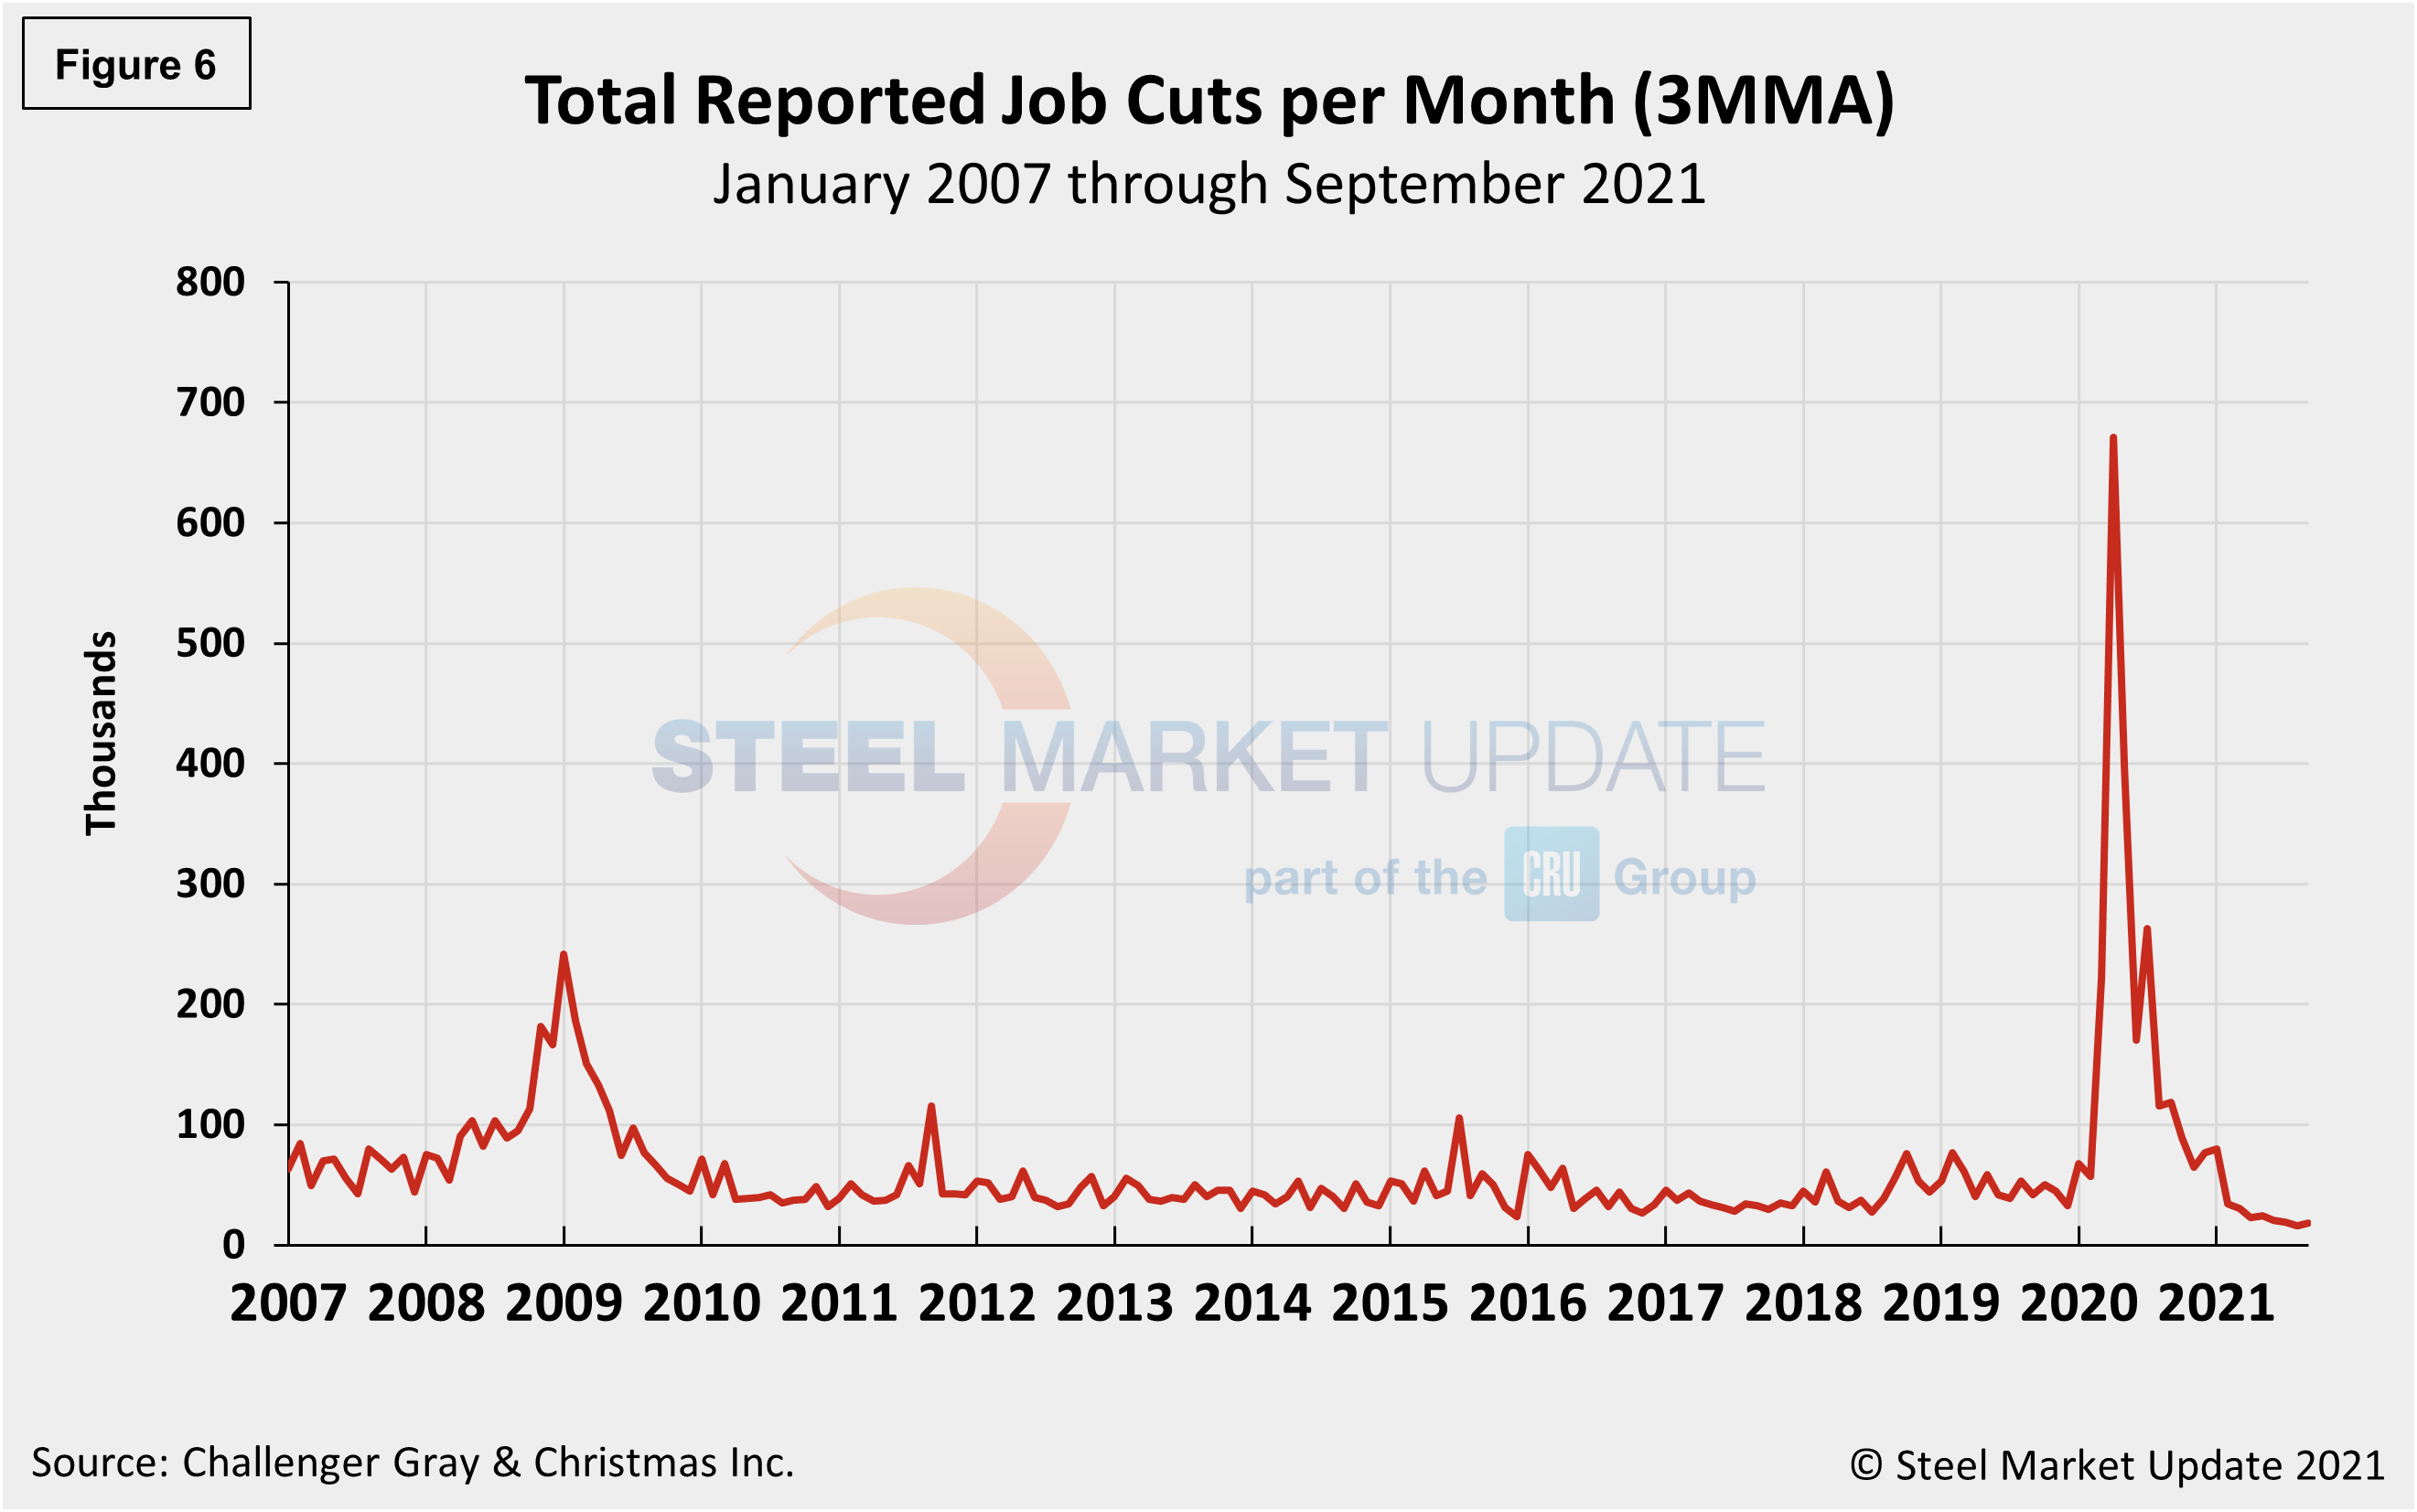
Year-to-date, employers have announced plans to cut 265,221 jobs from their payrolls, down 87.0% from the 2,082,262 jobs eliminated through the same period last year. It is the lowest January-September total on record. The second lowest occurred in 1997, when 281,496 cuts were tracked in the first nine months of the year.
Explanation: On the first Friday of each month, the Bureau of Labor Statistics releases the employment data for the previous month. Data is available at www.bls.gov. The BLS reports on the results of two surveys. The Establishment survey reports the actual number employed by industry. The Household survey reports on the unemployment rate, participation rate, earnings, average workweek, the breakout into full-time and part-time workers and lots more details describing the age breakdown of the unemployed, reasons for and duration of unemployment.
By David Schollaert, David@SteelMarketUpdate.com


