

Analysis

October 15, 2021
North American Auto Assemblies Fall in September
Written by David Schollaert
North American auto assemblies fell in September, reaching the second lowest monthly total year-to-date. The impact of the chip shortage and supply-chain disruptions pulled automotive production down nearly 13% month on month. Semiconductor scarcity and parts delays further worsened, reducing vehicle inventories and causing regional sales to tumble during the month, according to LMC Automotive (LMCA).
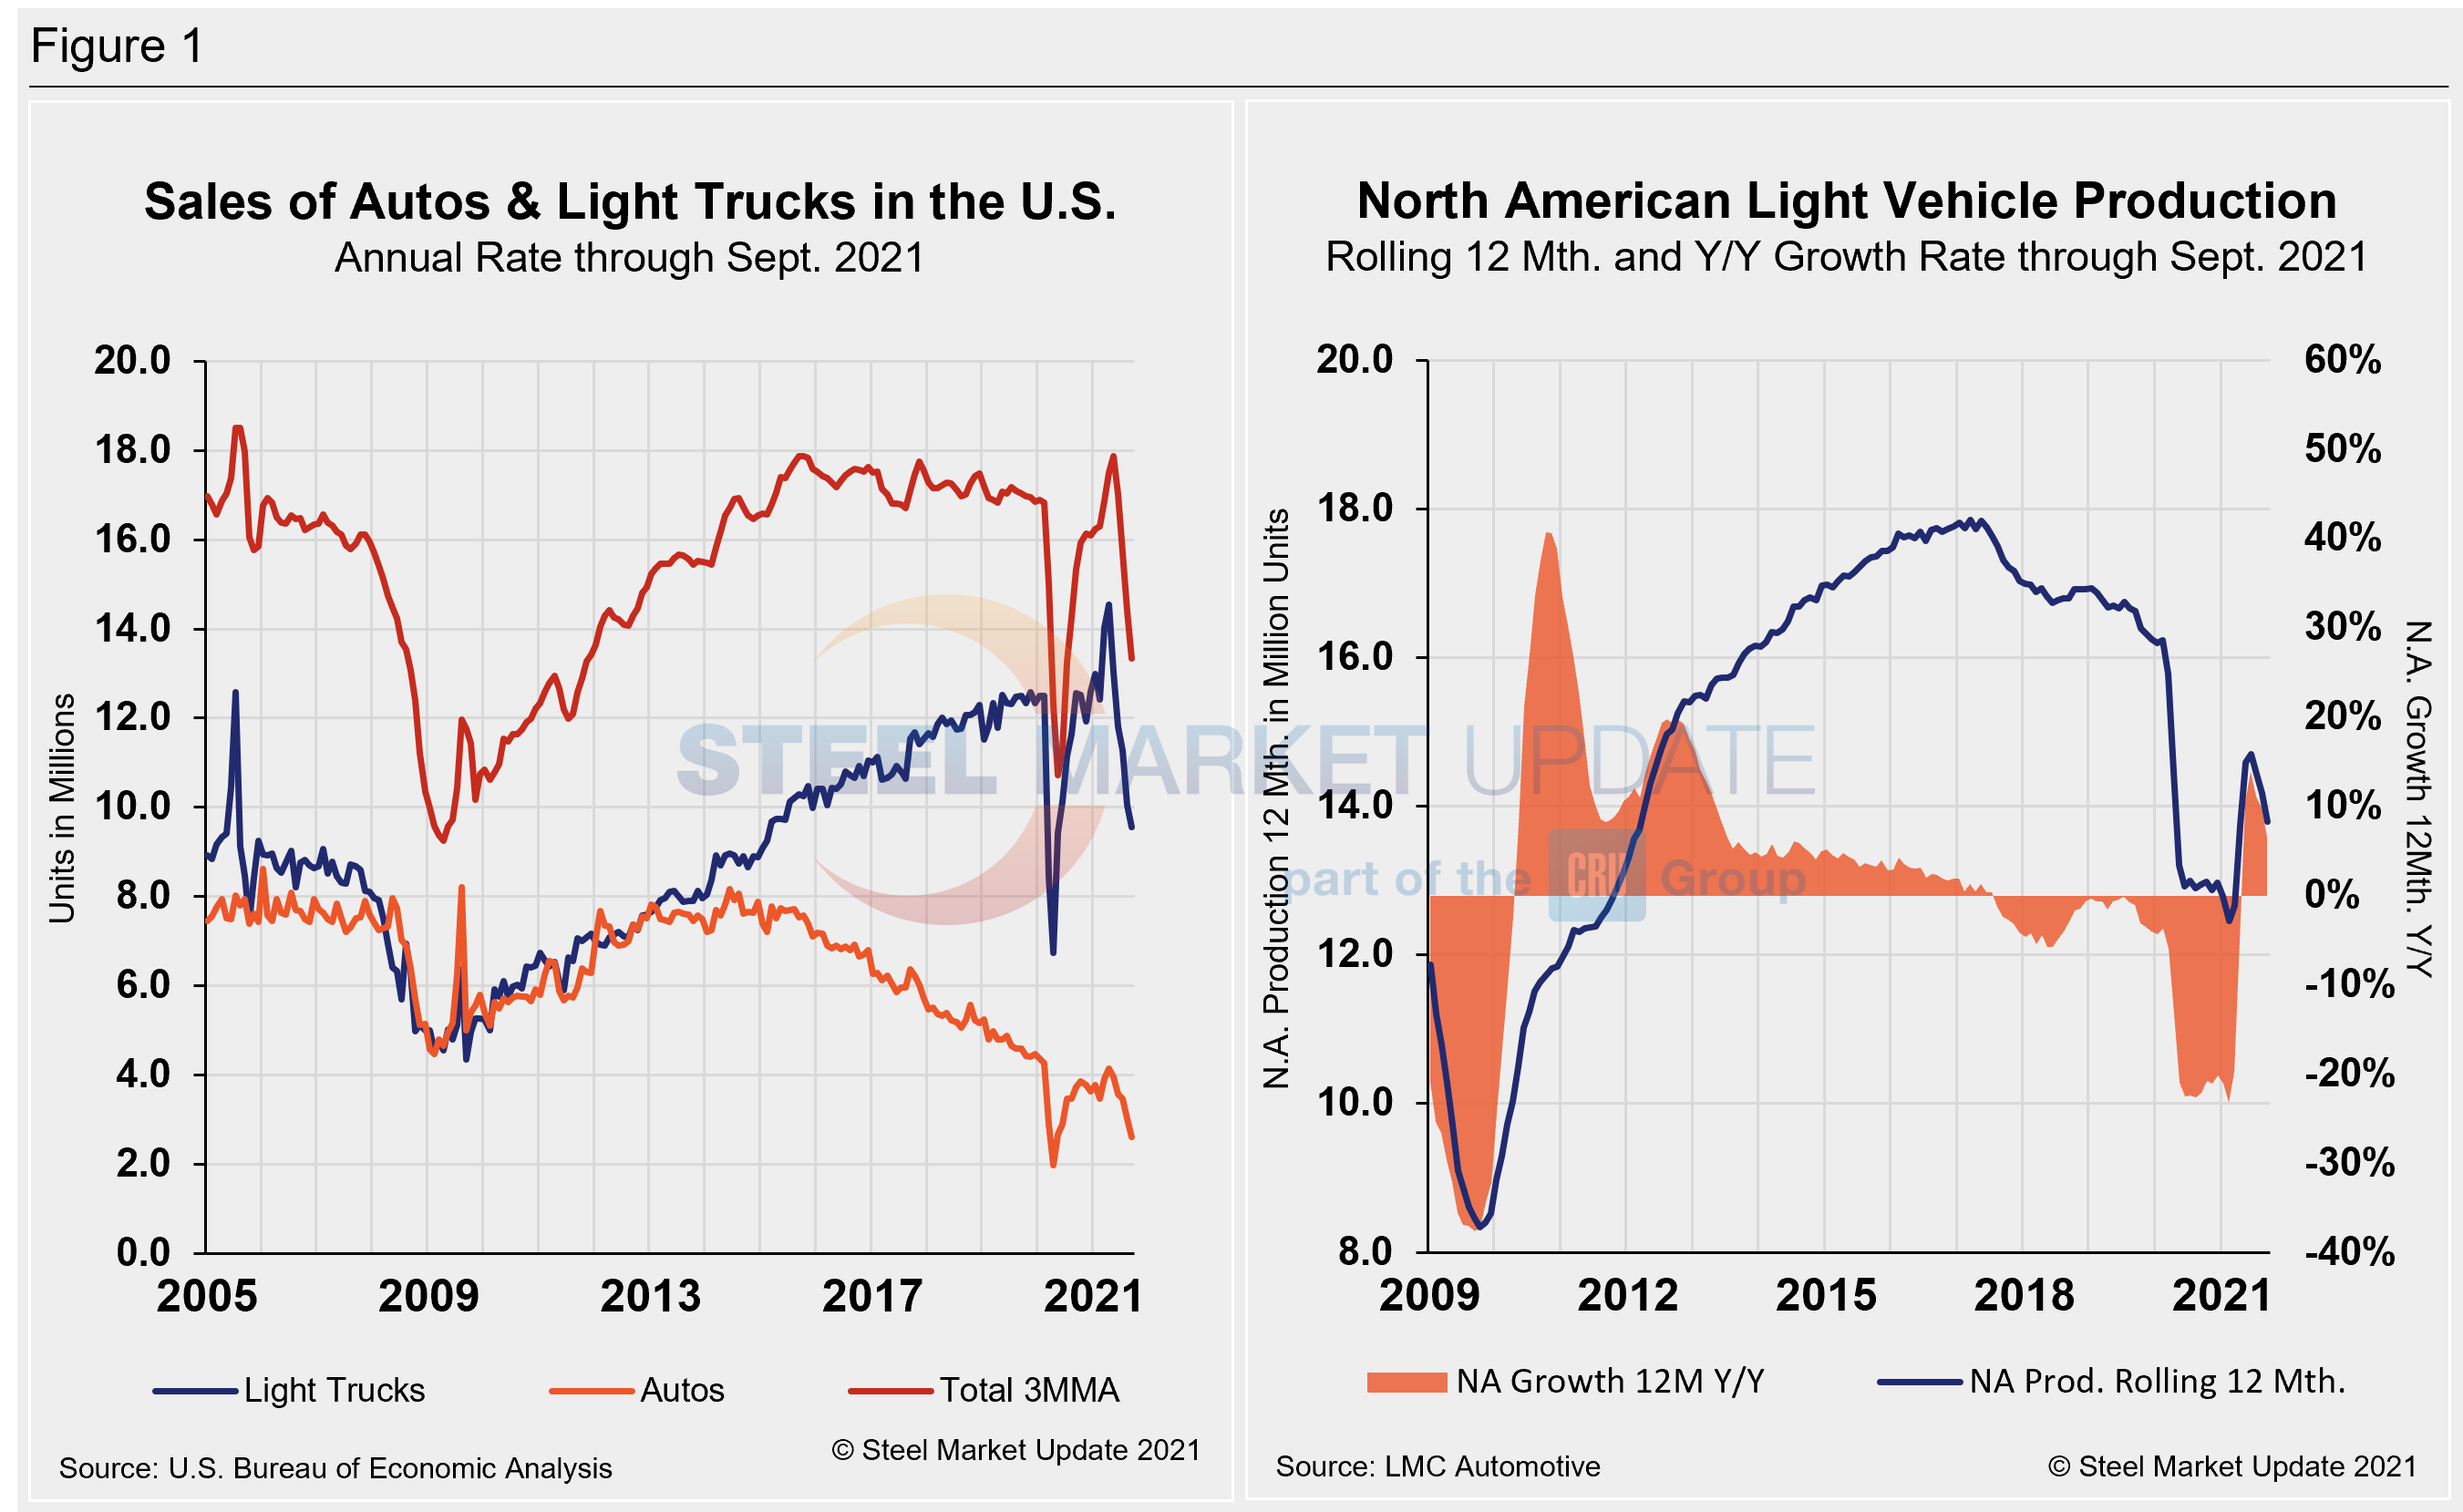
Total North American vehicle production, including personal and commercial vehicles, was 983,975 units in September, 12.9% lower than August’s total. September’s total was 27.8% behind year-ago levels, and nearly 31% below the most recent peak of 1.424 million units last November. The latest results reflect the extensive impact the global semiconductor shortage and other pandemic-related parts scarcities have had on the automotive industry.
The impact on production has been extensive; not a single carmaker has made it out unscathed. Continued delays and extended idlings are expected at vehicle assembly plants across the country, likely leading to decreased output for the remainder of the year. The duration of the chip shortage is expected to carry on well into 2022, keeping vehicle inventories at historically low levels and further impacting sales.
Sales volumes saw a torrid recovery a year ago, rebounding from the initial impact of the COVID-related closures. The extended effects of the pandemic caused U.S. light vehicle sales to tumble in September amid the chip shortage and the lack of inventory. Volumes fell by 25.1% year on year, to just over one million units. The annualized selling rate declined to 12.1 million units per year, the lowest for the month of September since 2010.
Average transaction prices reached a new record high of $42,921 per unit in September, up nearly $1,500 per unit month on month. The trend is affecting consumer confidence, leading to growing concerns that potential buyers are becoming more hesitant to purchase a new vehicle, said the LMCA.
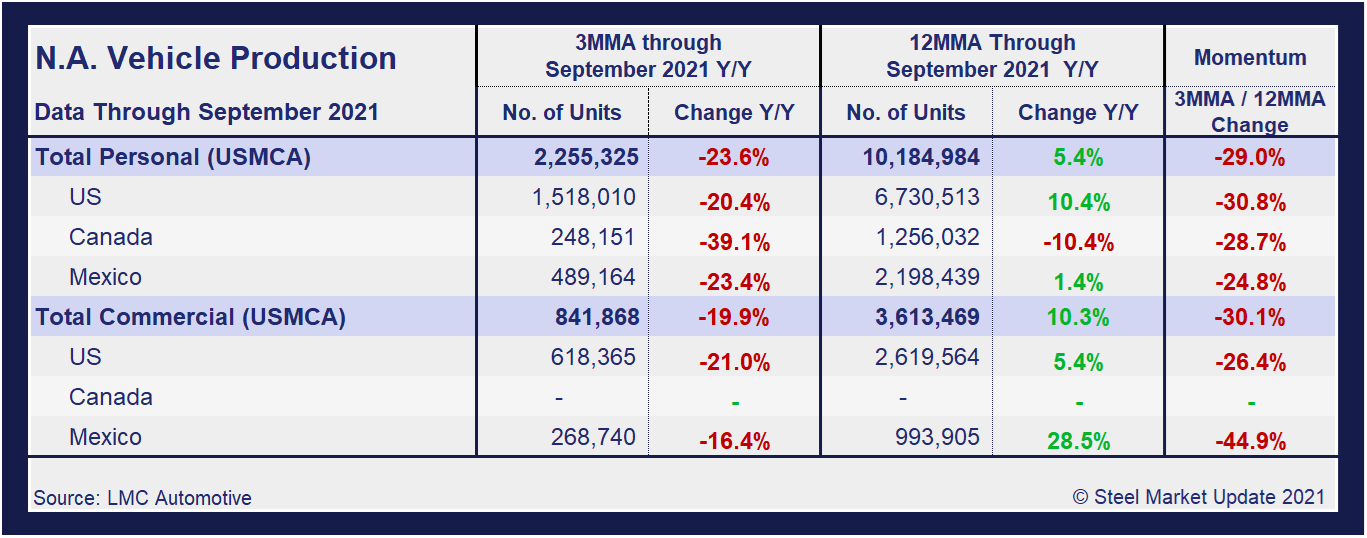
A short-term snapshot of assembly by nation and vehicle type is shown in the table below. It breaks down total North American personal and commercial vehicle production into the U.S, Canadian and Mexican components, along with the three- and 12-month growth rate for each. At the far right it shows the momentum for the total and for each of the three nations.
Although the initial rebound from the COVID-19 doldrums was impressive, the effect of the chip shortage has been devastating. Through June, growth rates for personal and commercial light vehicles soared by 156.8% and 127.4%, respectively, but have since seen a nosedive as the chip shortage and supply-chain disruptions have taken hold.
In three months through September, the growth rate for total personal vehicle assemblies in the USMCA was negative -23.6% year over year, while commercial light vehicle assemblies saw negative growth of -19.9%. The impact of the global semiconductor chip shortage on automotive production across North America has been catastrophic.
Personal Vehicle Production
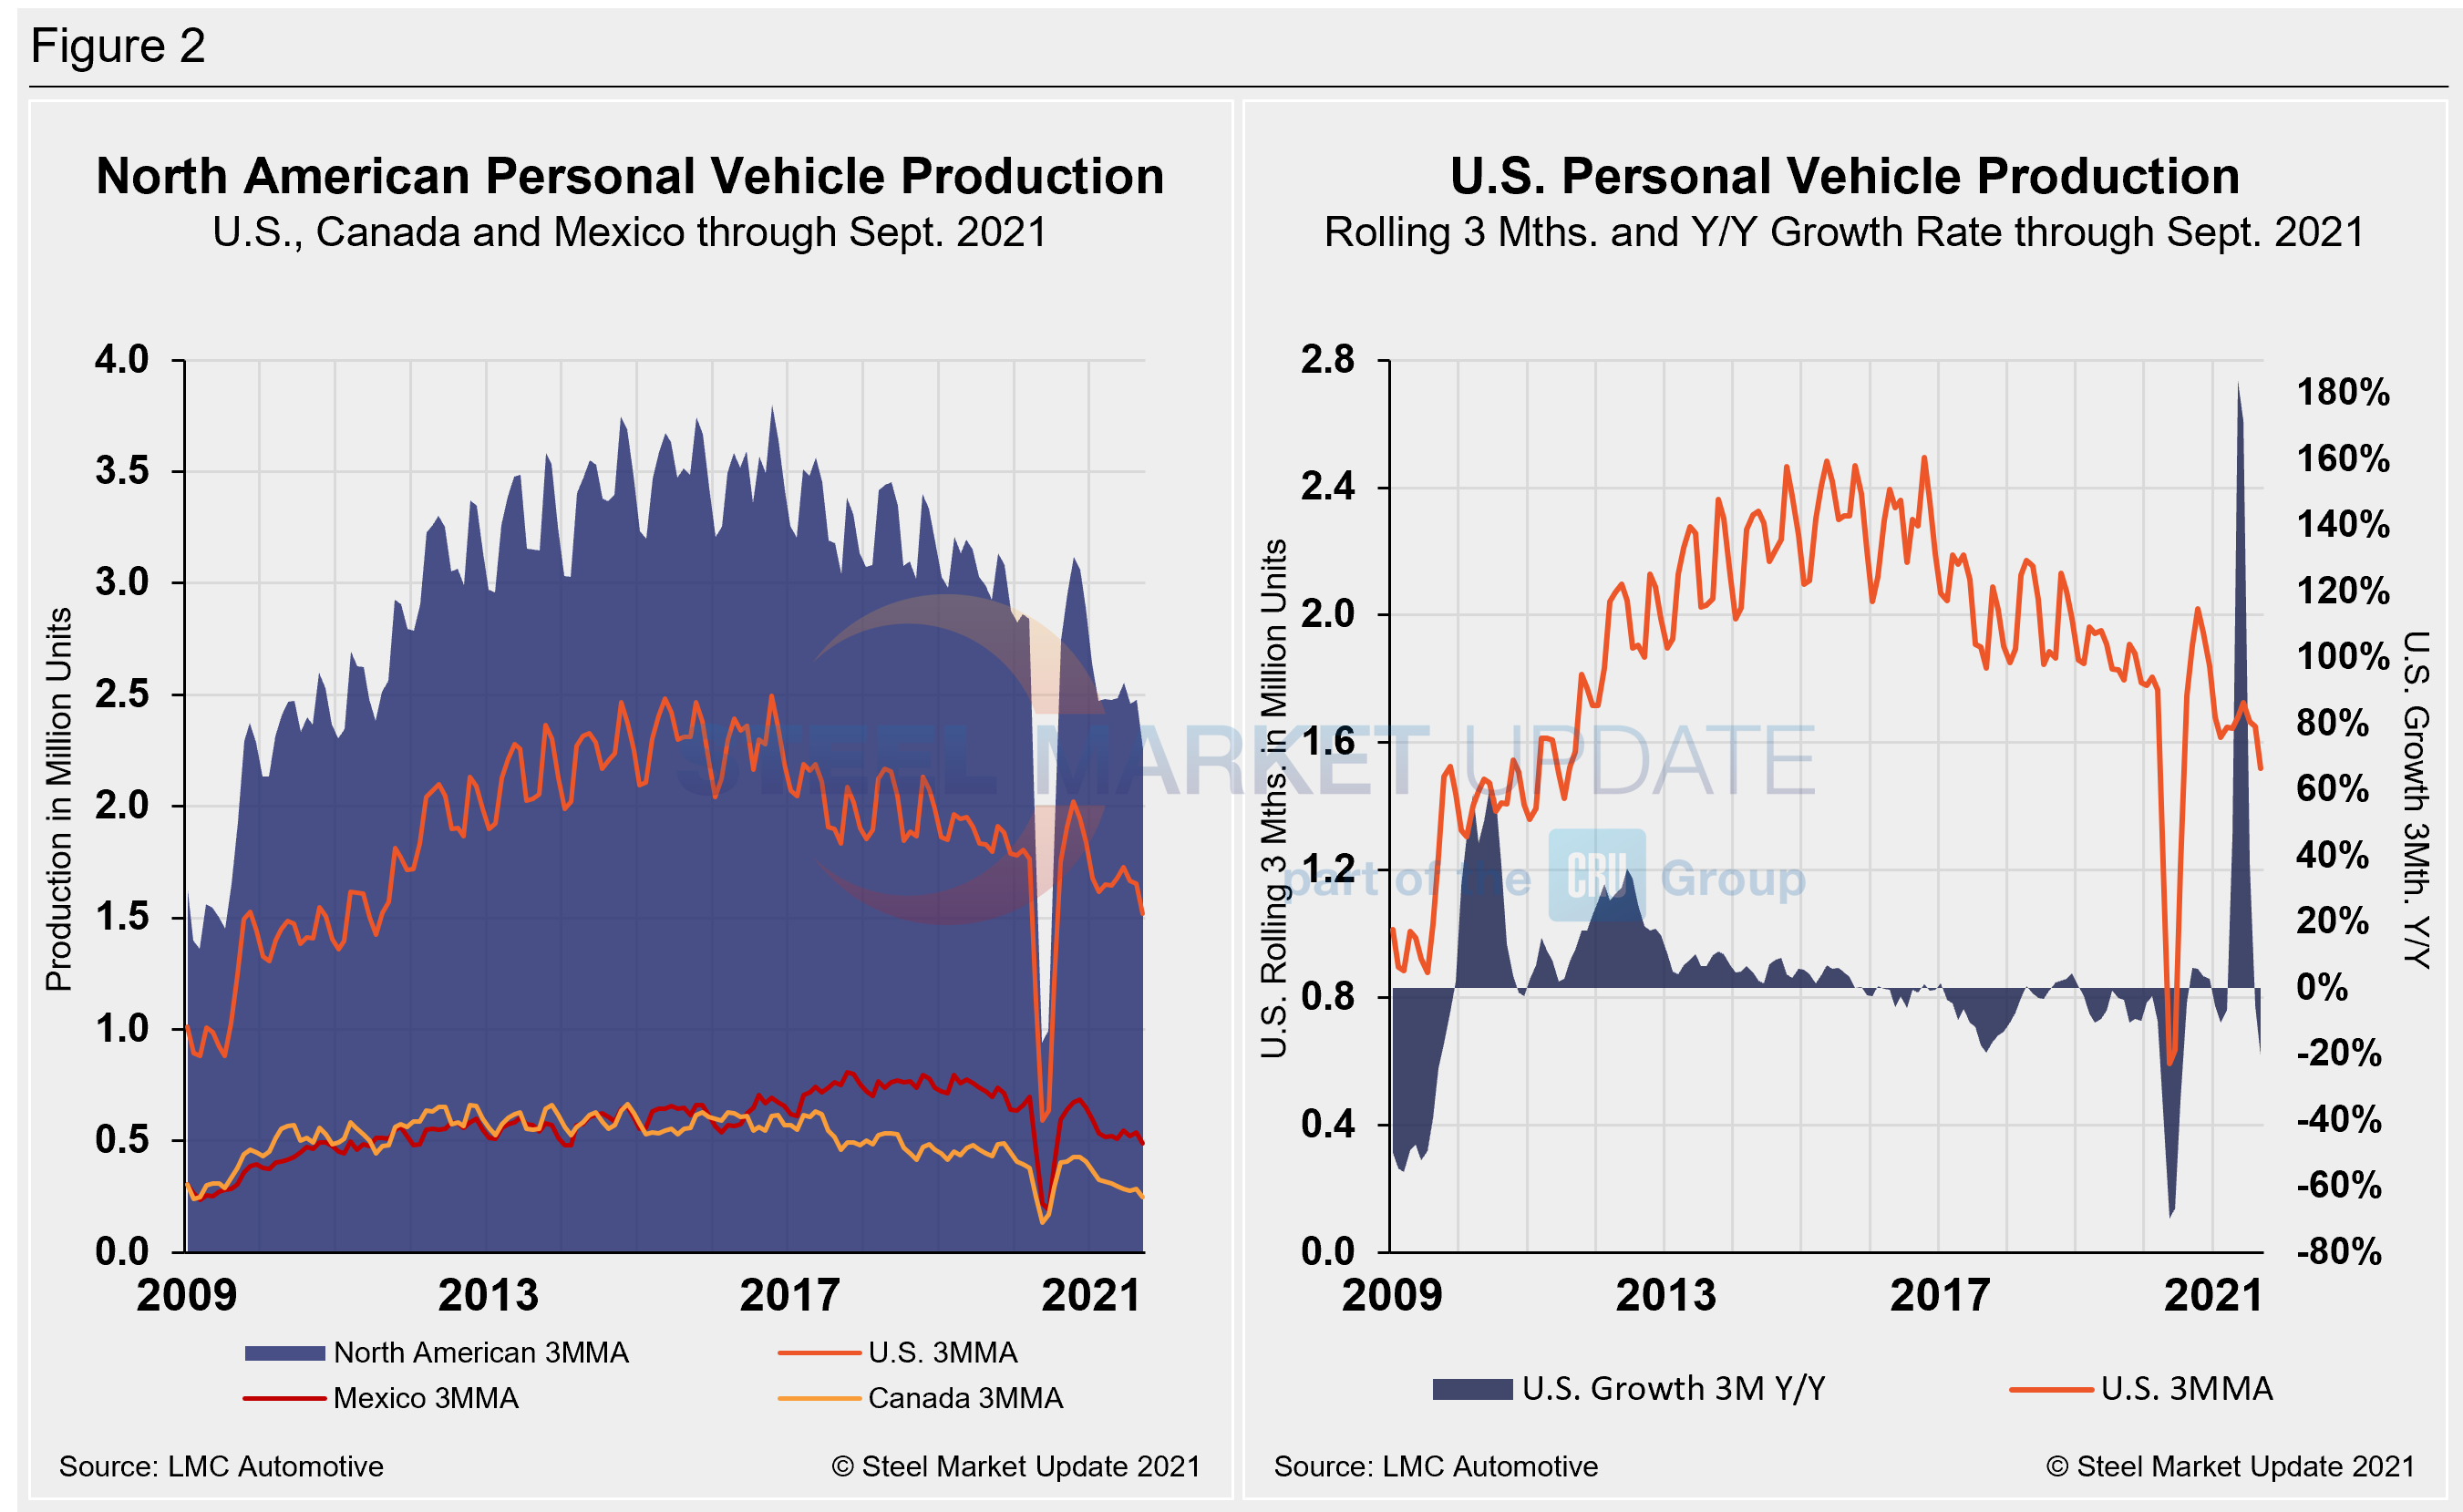
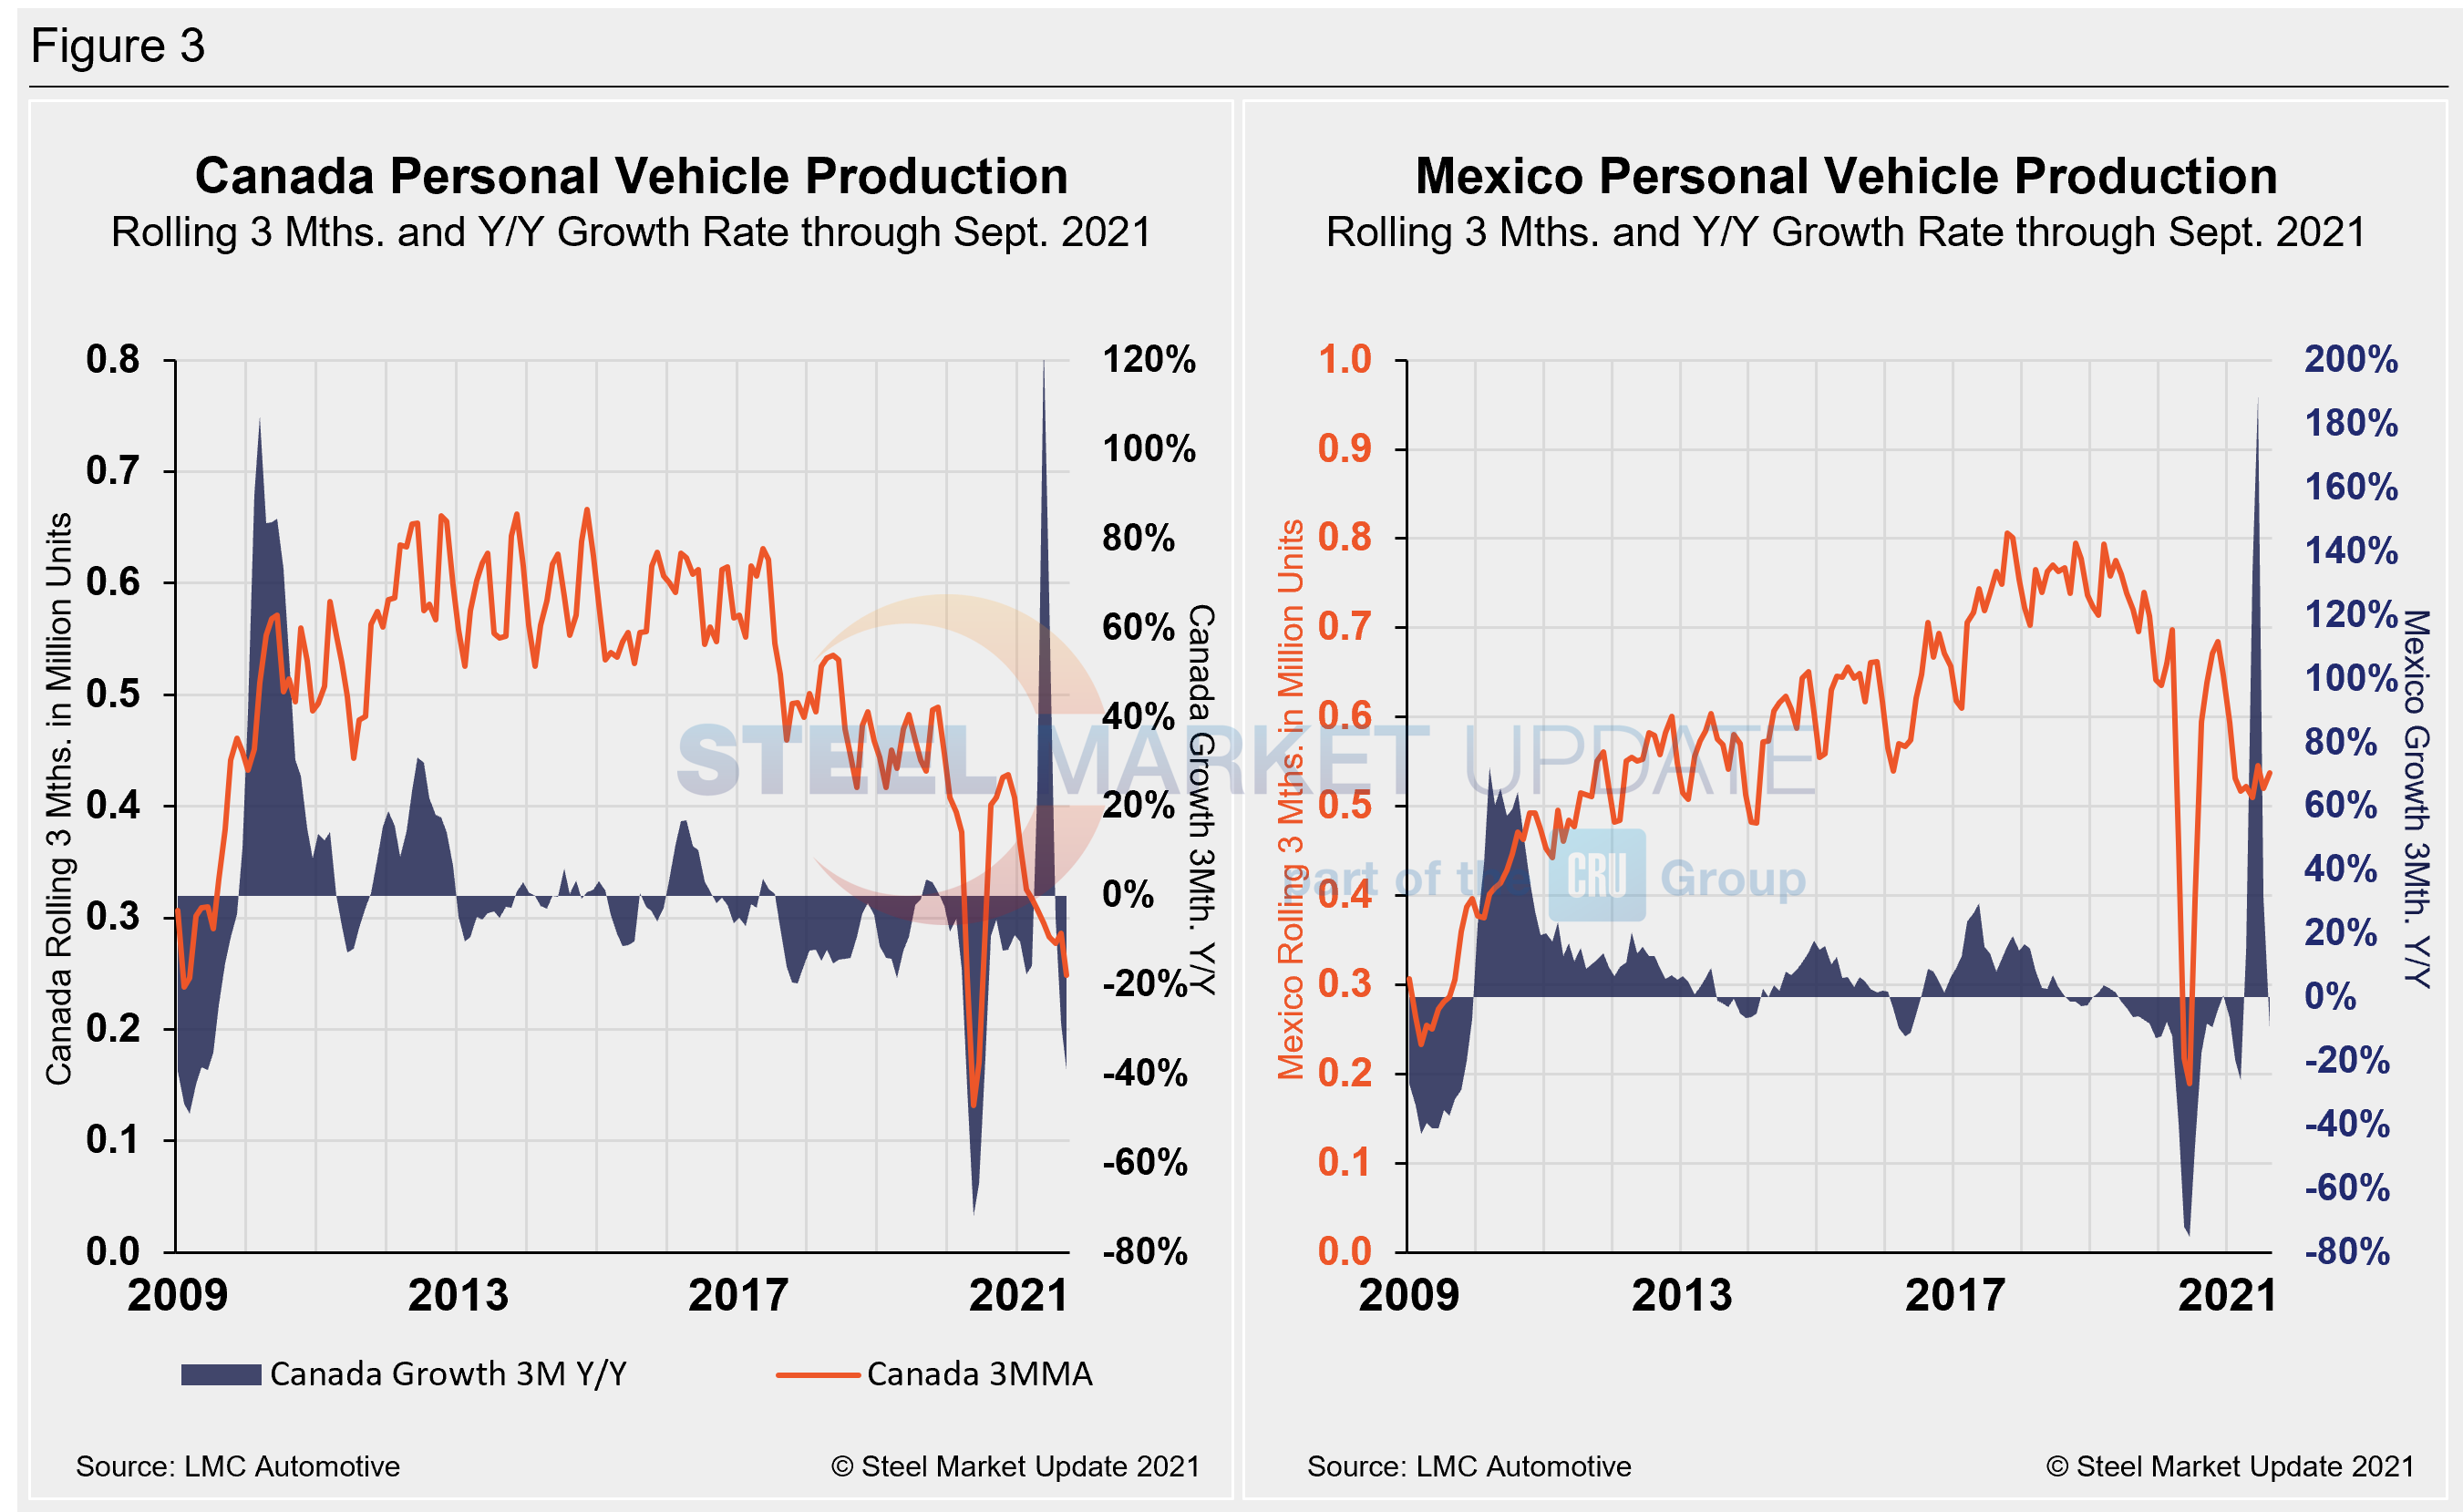
The longer-term picture on personal vehicle production across North America is shown below. The first chart in Figure 2 shows the total personal vehicle production for North America and the total for each nation. The production of personal vehicles in the U.S. and the year-over-year growth rate is displayed in the second chart. Figure 3 shows side-by-side the production of personal vehicles in Canada and Mexico and the year-over-year growth rate.
In terms of personal vehicle production, all three countries in the region saw decreases in September. Canada saw the greatest percentage decrease at 33.3% or 32,945 units when compared to the month prior, while the U.S. saw the largest decrease in total units, down 47,123 units or 8.6% month on month. Mexican auto assemblies were down 8.5% or 14,042 units in September versus the prior month. The annual growth rate across the region plummeted–Canada saw the most aggressive decrease, at -39.1%, followed by Mexico at -23.4% and the U.S. at -20.4%.
Canada’s personal vehicle production share of the North American market slipped to 11% in September, compared to 11.6% the month prior. Mexico was unchanged at 21.7% month on month. The U.S. edged up to a 67.3% share of the North American market versus 66.7% in August.
Commercial Vehicle Production
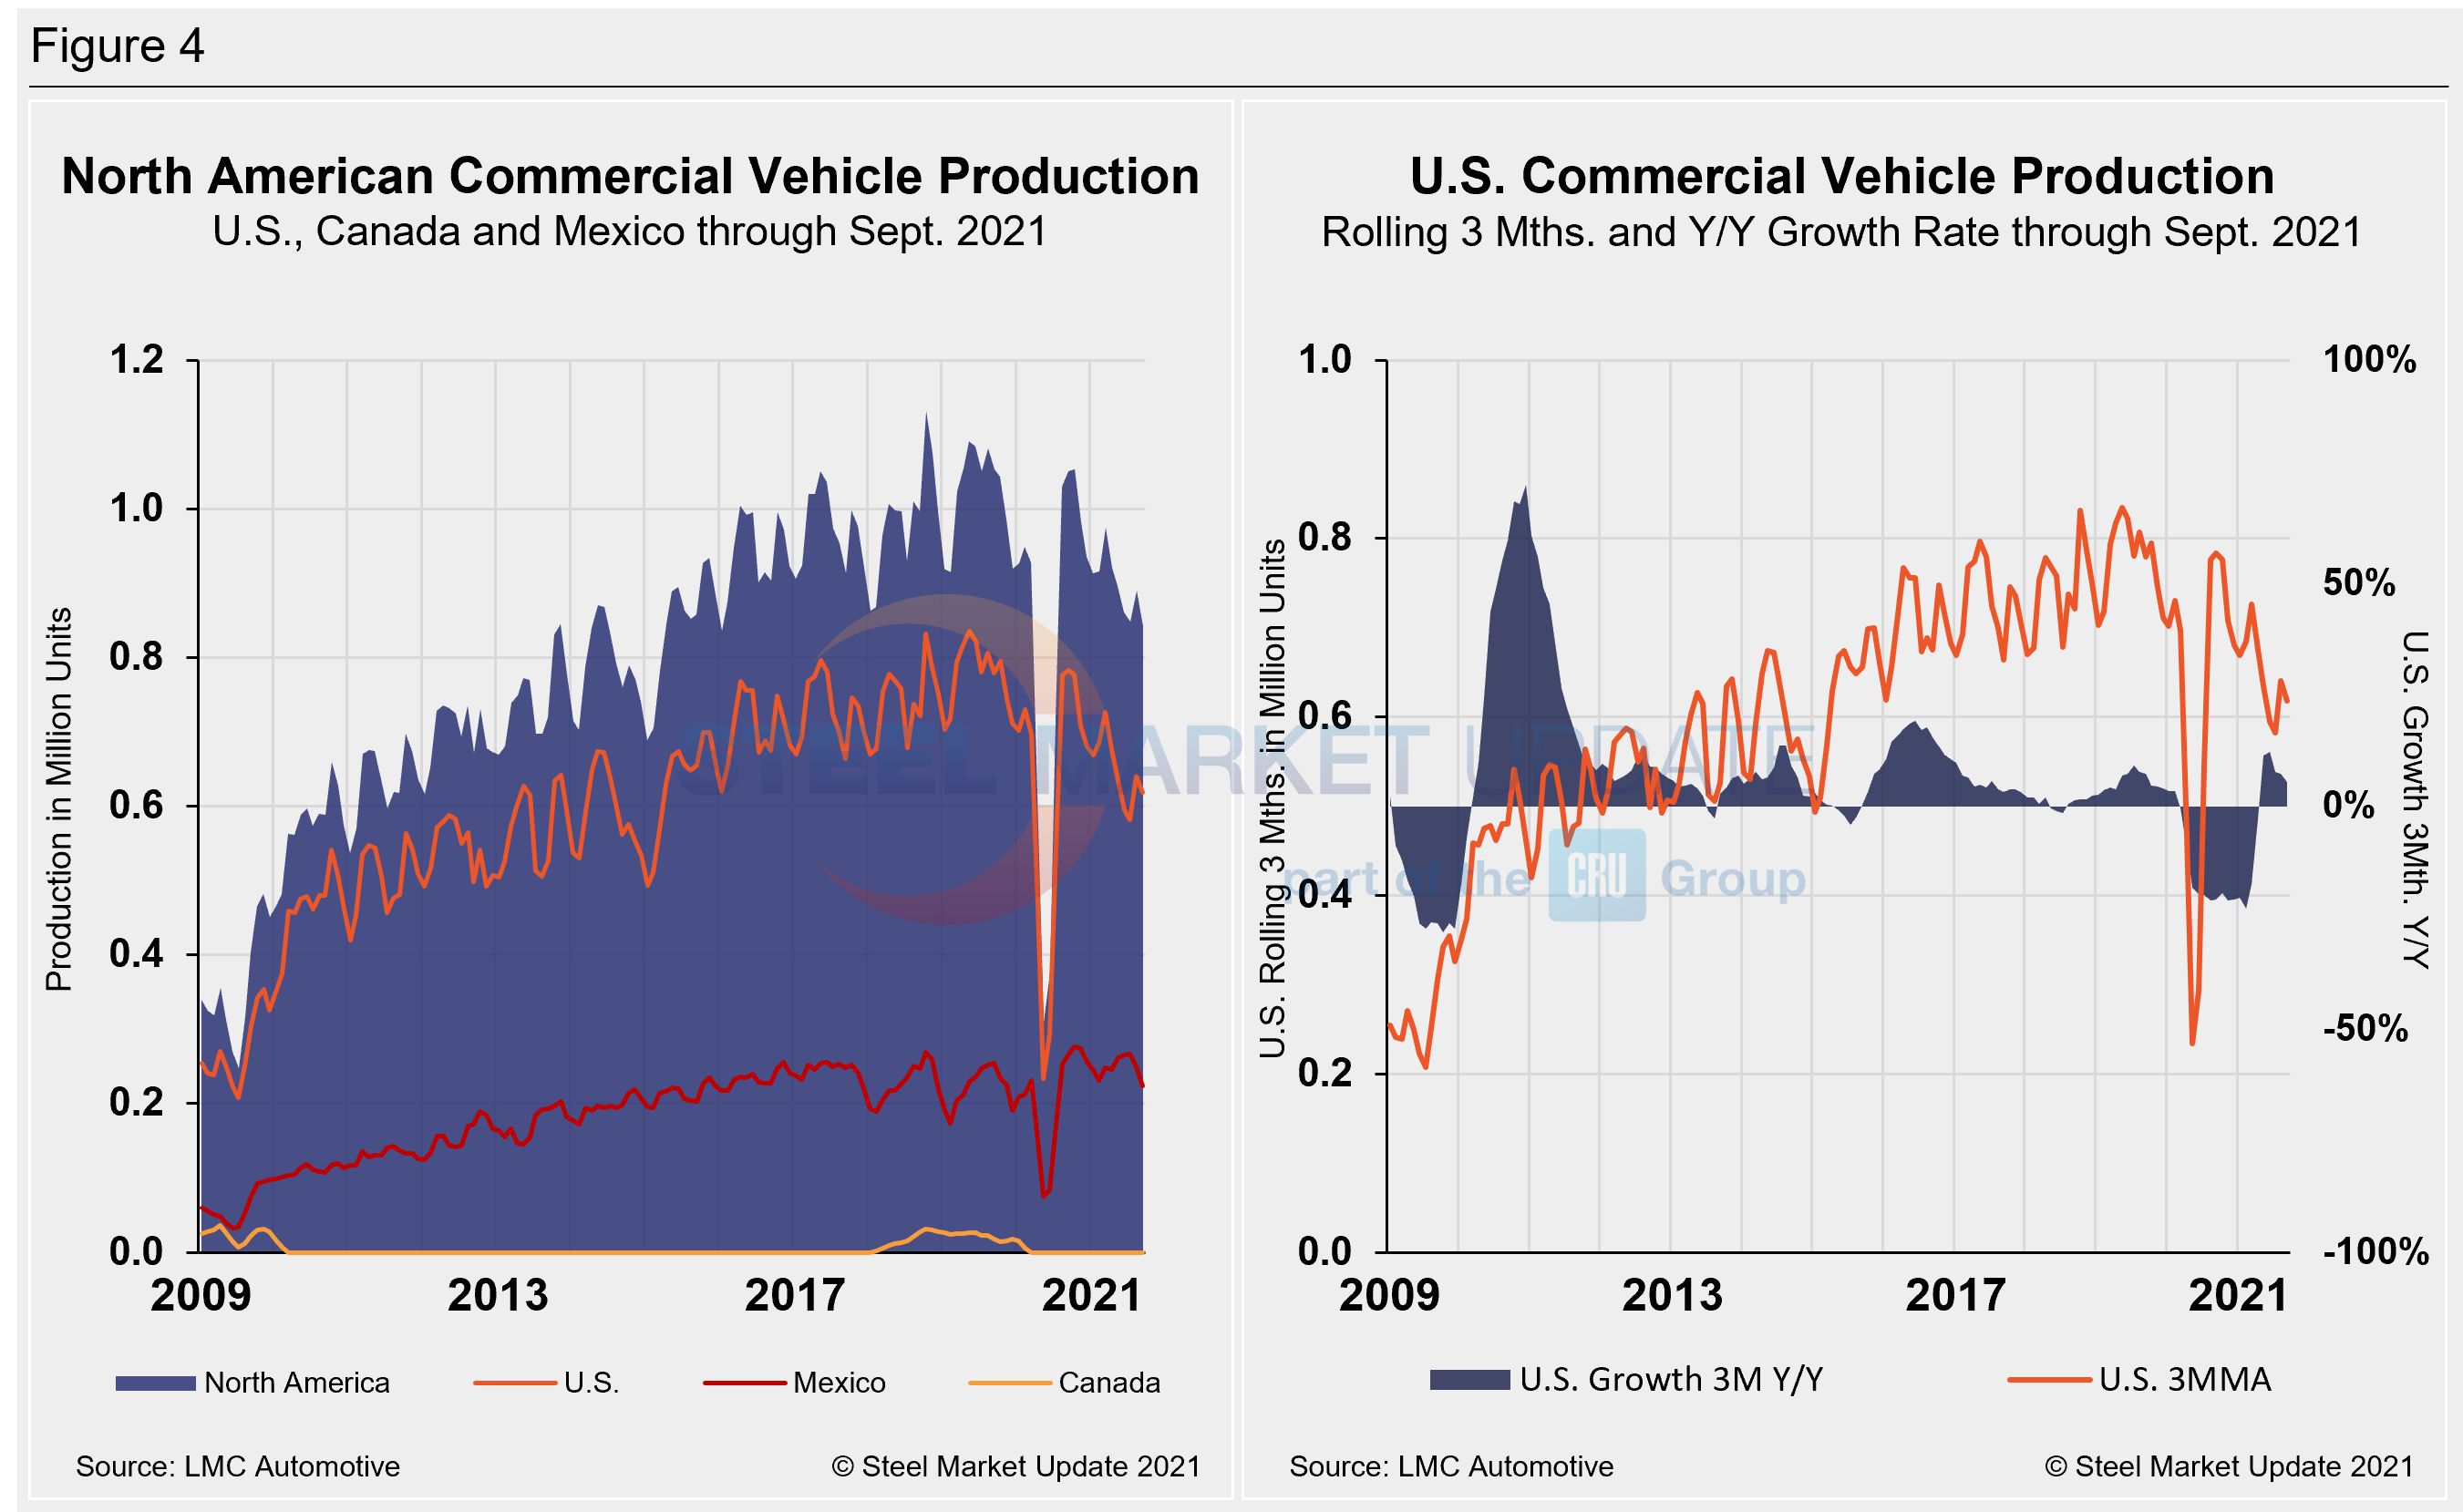
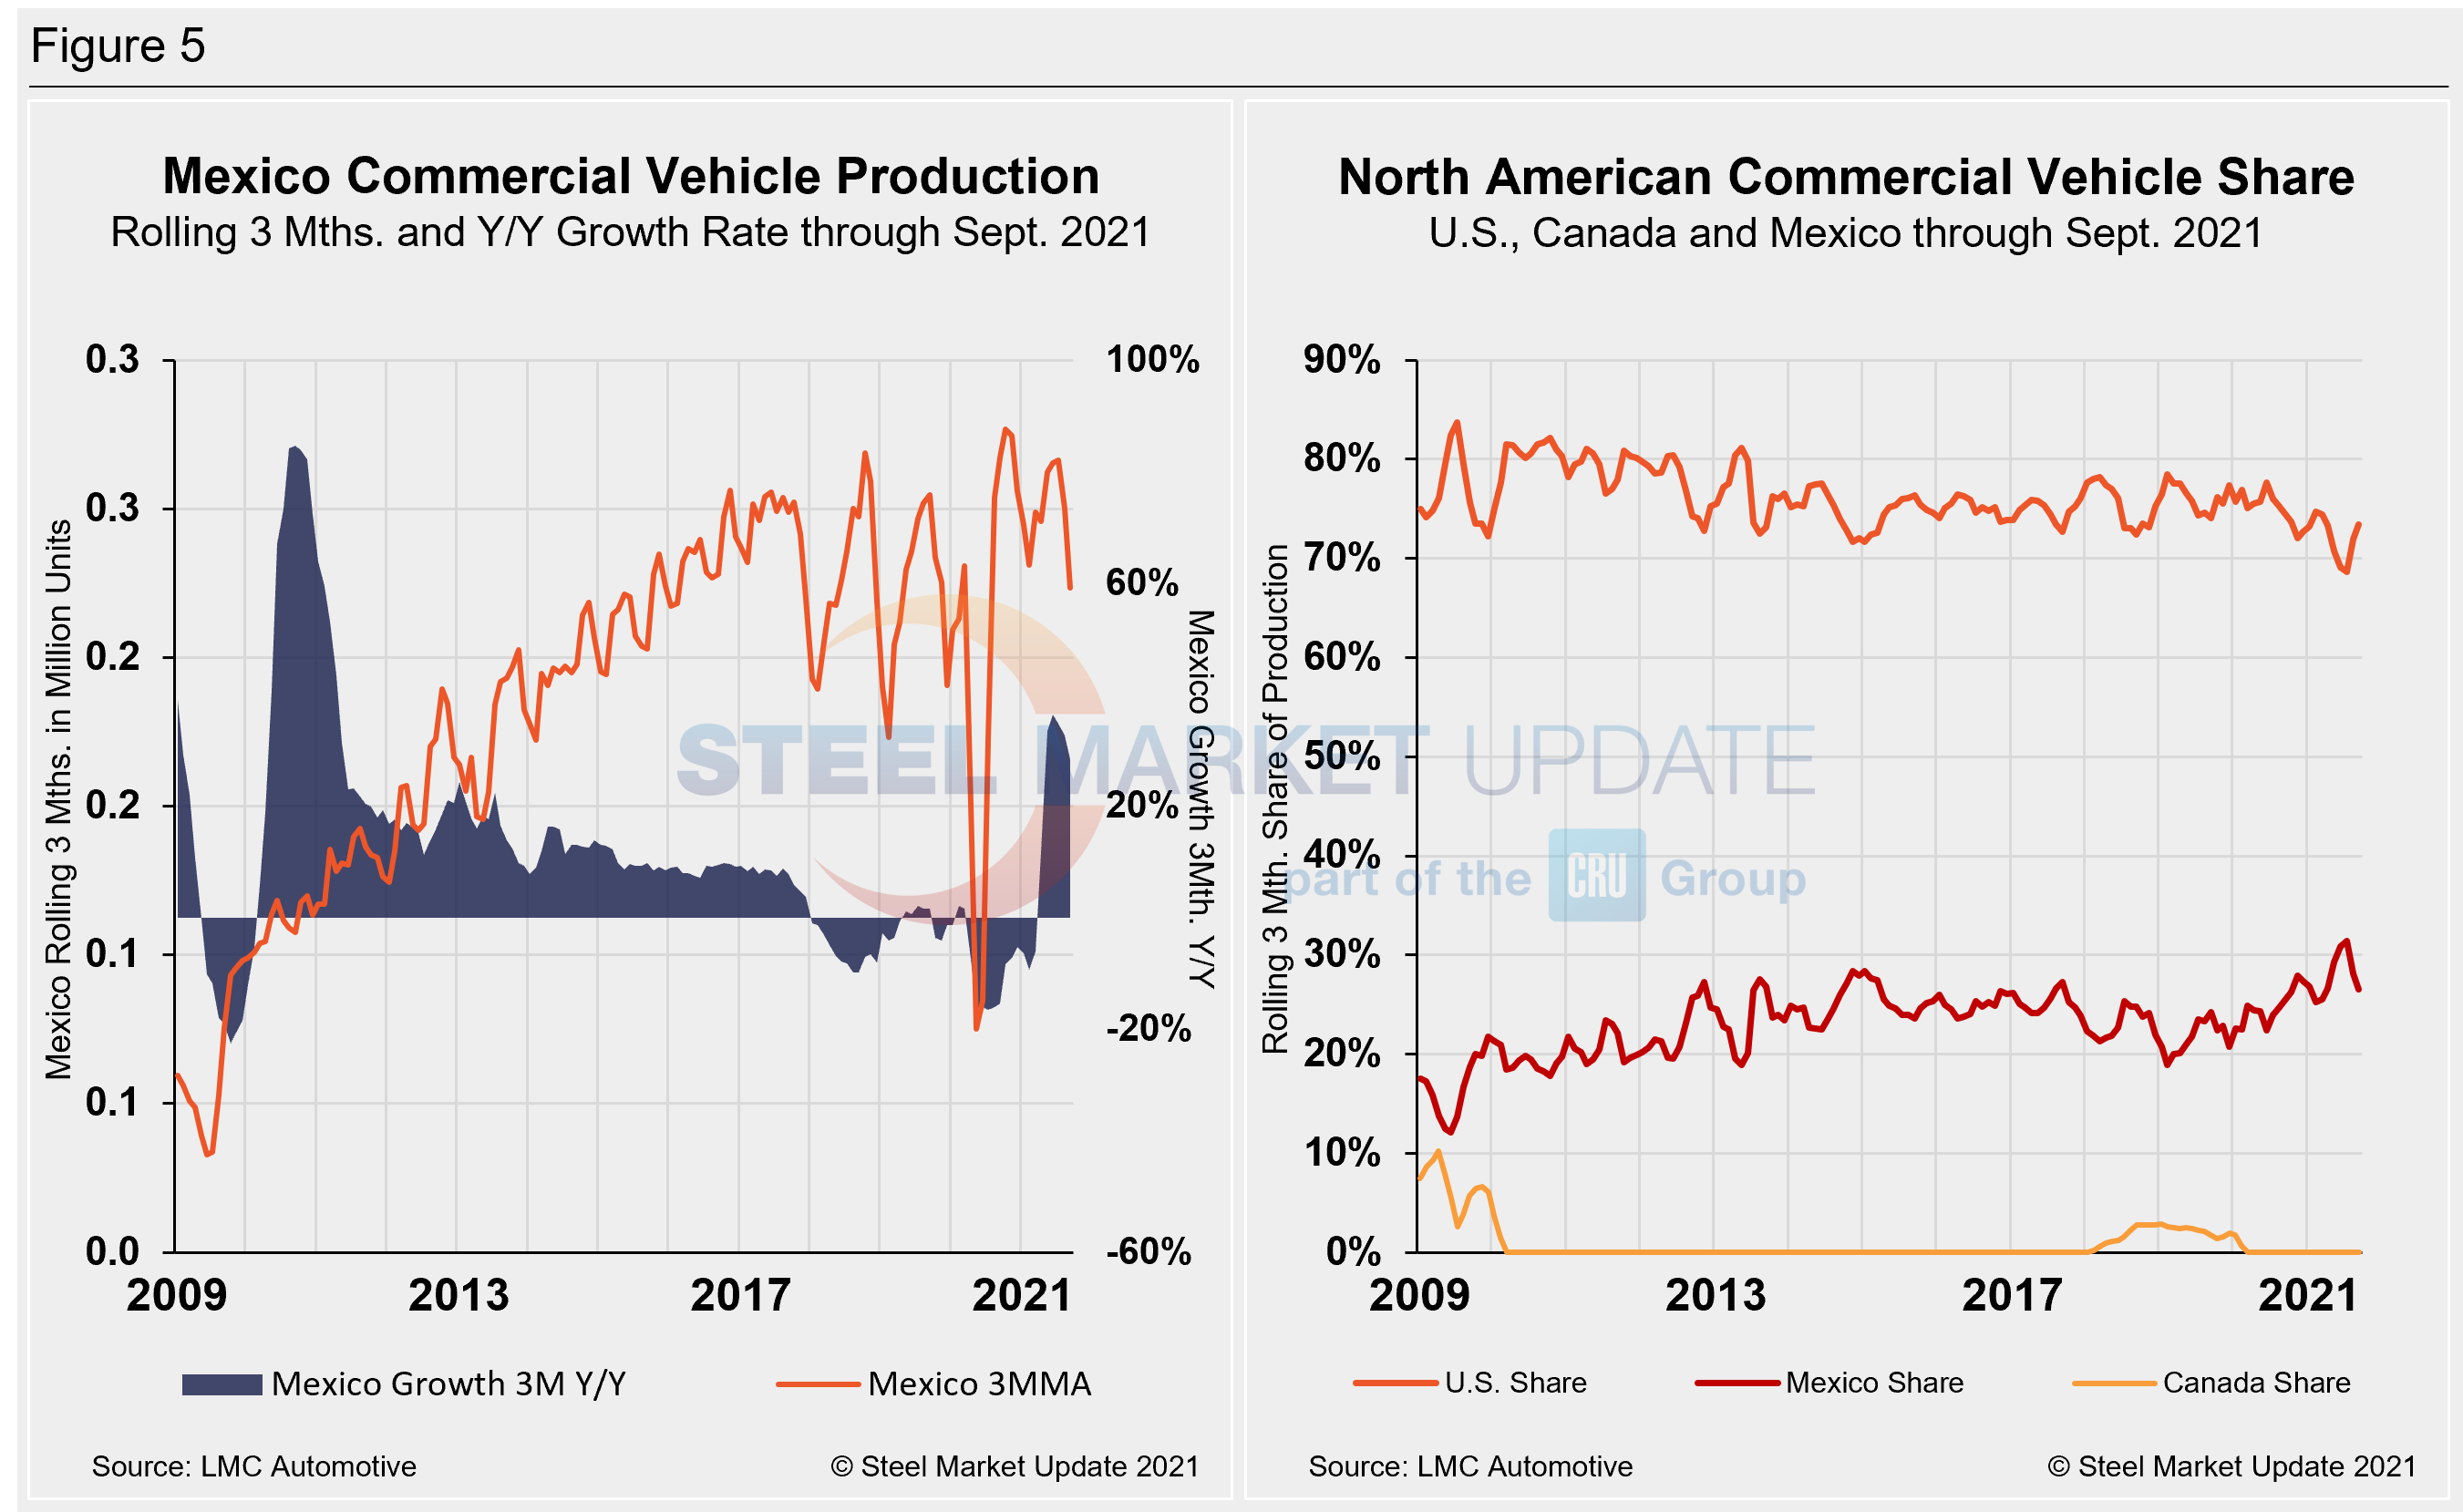
Total commercial vehicle production for North America and the total for each nation on a rolling three-month basis is shown below in the first chart in Figure 4, while the production of commercial vehicles in the U.S and the year-over-year growth rate is displayed in the second chart. Figure 5 shows the production of commercial vehicles and the year-over-year growth rate in Mexico displayed in the first chart, while the second chart shows the production share for each nation. Note that Canada has not produced any commercial vehicles over the past 21 consecutive months.
North American commercial vehicle production was down 16.3% in September compared to the prior month. The month-on-month erosion was driven by a 17% decrease in the U.S., a drop of 41,275 units in September. Mexican production of light commercial vehicle fell from August to September by 10,666 units or 14.2%. Production limitations due to the semiconductor shortage and other supply-chain constraints are expected to continue through the fourth quarter.
The annual growth rate is now -27.45% in Mexico, year on year, while the U.S. growth rate over the same period is -19.0%. The U.S. share was 73.5% in September, up 1.6 percentage points when compared to the month prior. Mexico’s share fell by the same rate month on month to 26.5% Presently, Mexico exports just under 80% of its light vehicle production, while the U.S and Canada are the highest volume destinations for Mexican exports.
Editor’s Note: This report is based on data from LMC Automotive for automotive assemblies in the U.S., Canada and Mexico. The breakdown of assemblies is “Personal” (cars for personal use) and “Commercial” (light vehicles less than 6.0 metric tons gross vehicle weight rating; heavy trucks and buses are not included). In this report, we describe light vehicle sales in the U.S. and report in detail on assemblies in the three regions of North America.
By David Schollaert, David@SteelMarketUpdate.com


