Market Data

October 21, 2021
AIA Architectural Billings Index Rises Again in September
Written by Brett Linton
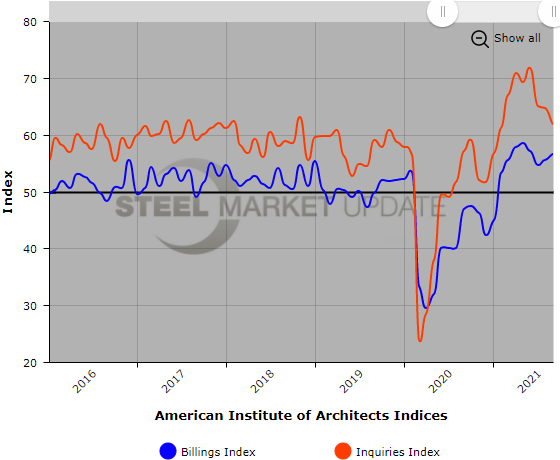
Demand for design services from architecture firms in the U.S. improved for the eighth consecutive month, according to the latest report from The American Institute of Architects (AIA). AIA’s Architecture Billings Index rose from 55.6 in August to 56.6 in September. The ABI has expanded each month since January.
The index for new project inquiries fell by 2.9 points to 61.8, while the new design contracts index slipped 1.9 points to 54.7.
“The ABI scores over the last eight months continue to be among the highest ever seen in the immediate post-recession periods that have been captured throughout the index’s history, underscoring just how strong the bounce back has been this year following the abrupt downturn in 2020. Firms continue to report plenty of work in the pipeline as well, with inquiries into new projects and the value of new design contracts remaining strong,” reported AIA.
The Architecture Billings Index is an advance economic indicator for nonresidential construction activity, with a lead time of approximately 9-12 months. A score above 50 indicates an increase in activity, and a score below 50 a decrease.
Key ABI highlights for September include:
- Regional averages: Midwest (57.7); South (57.0); West (56.0); Northeast (51.5)
- Sector index breakdown: mixed practice (58.8); commercial/industrial (58.1); multifamily residential (56.1); institutional (53.5)
Regional and sector scores are calculated as three-month averages.
Below is a graph showing the history of the AIA Architecture Billings Index. You will need to view the graph on our website to use its interactive features; you can do so by clicking here. If you need assistance logging into or navigating the website, please contact us at info@SteelMarketUpdate.com.