Analysis

November 3, 2021
CPIP Data: Construction Spending Fades in September
Written by David Schollaert
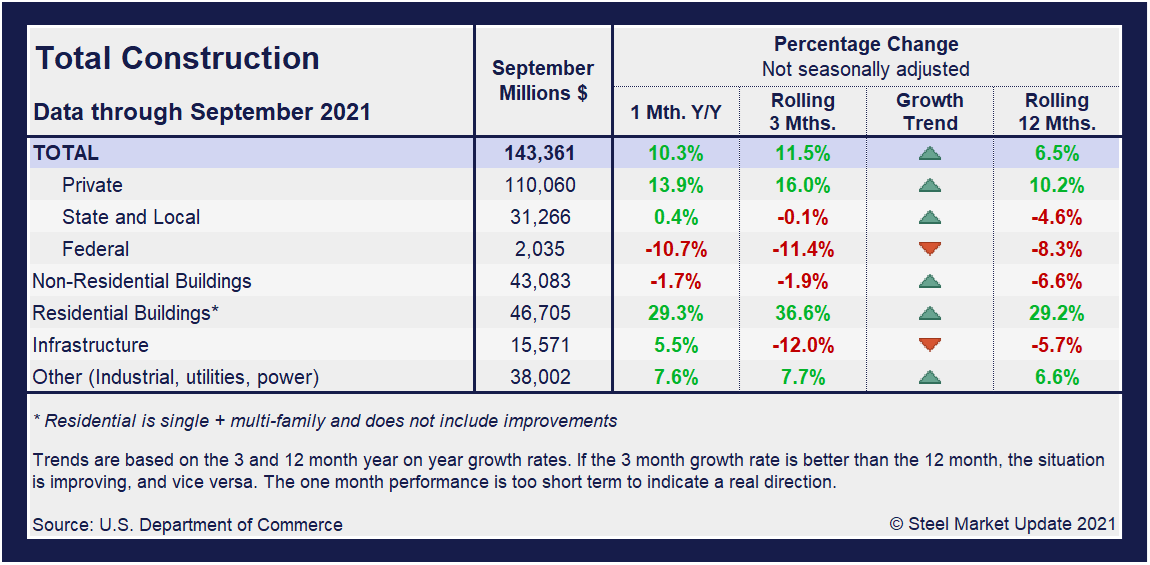
The U.S. construction sector slipped in September as spending faded for the second consecutive month following a downward revision in August’s results, the Commerce Department reported.
The Census Bureau’s report on construction spending shows that the value of residential construction put in place in September was up 19% year on year but fell 0.4% month on month. The month’s losses were spread across both private and public construction sectors, tumbling 0.5% and 0.7%, respectively.
Supply chain issues, historically high materials prices and ongoing labor shortages continue to hamper the overall construction sector. Total spending, which accounts for roughly 4% of U.S. gross domestic product, was at a seasonally adjusted annual rate of $1.574 trillion, 7.8% more than was spent in September 2020. Residential construction spending eased back slightly in September, but both single- and multifamily spending are still running ahead of any 2020 comparisons by double digits.
For the year-to-date, construction has consumed $1.178 trillion, 7.1% more than the $1.100 trillion spent during the first nine months of last year. The results continue to disappoint, as the domestic marketplace is now more than a year removed from the worst of the pandemic and struggling to expand as many had anticipated.
Construction put in place in the private sector was at a seasonally adjusted $1.230 trillion, down from $1.236 trillion the prior month, a 0.5% decline. Private spending across all project types was 11.1% higher than the previous September. Spending in the private sector was $110.1 billion in September compared to August when $112.9 billion in private construction was put in place. Year-to-date spending of $917.323 billion is up 11.3% versus the same year-ago period.
Publicly funded construction spending in September was down 0.7% from August and 2.4% year over year at an annual rate of $343.7 billion. Non-adjusted spending during the month was $33.6 billion and was $260.2 billion, year-to-date. The total through the first nine months of 2021 was down 5.5% from the same nine-month period in 2020. Publicly funded residential spending declined 1.6% in September and is 4.4% lower than in September 2020.
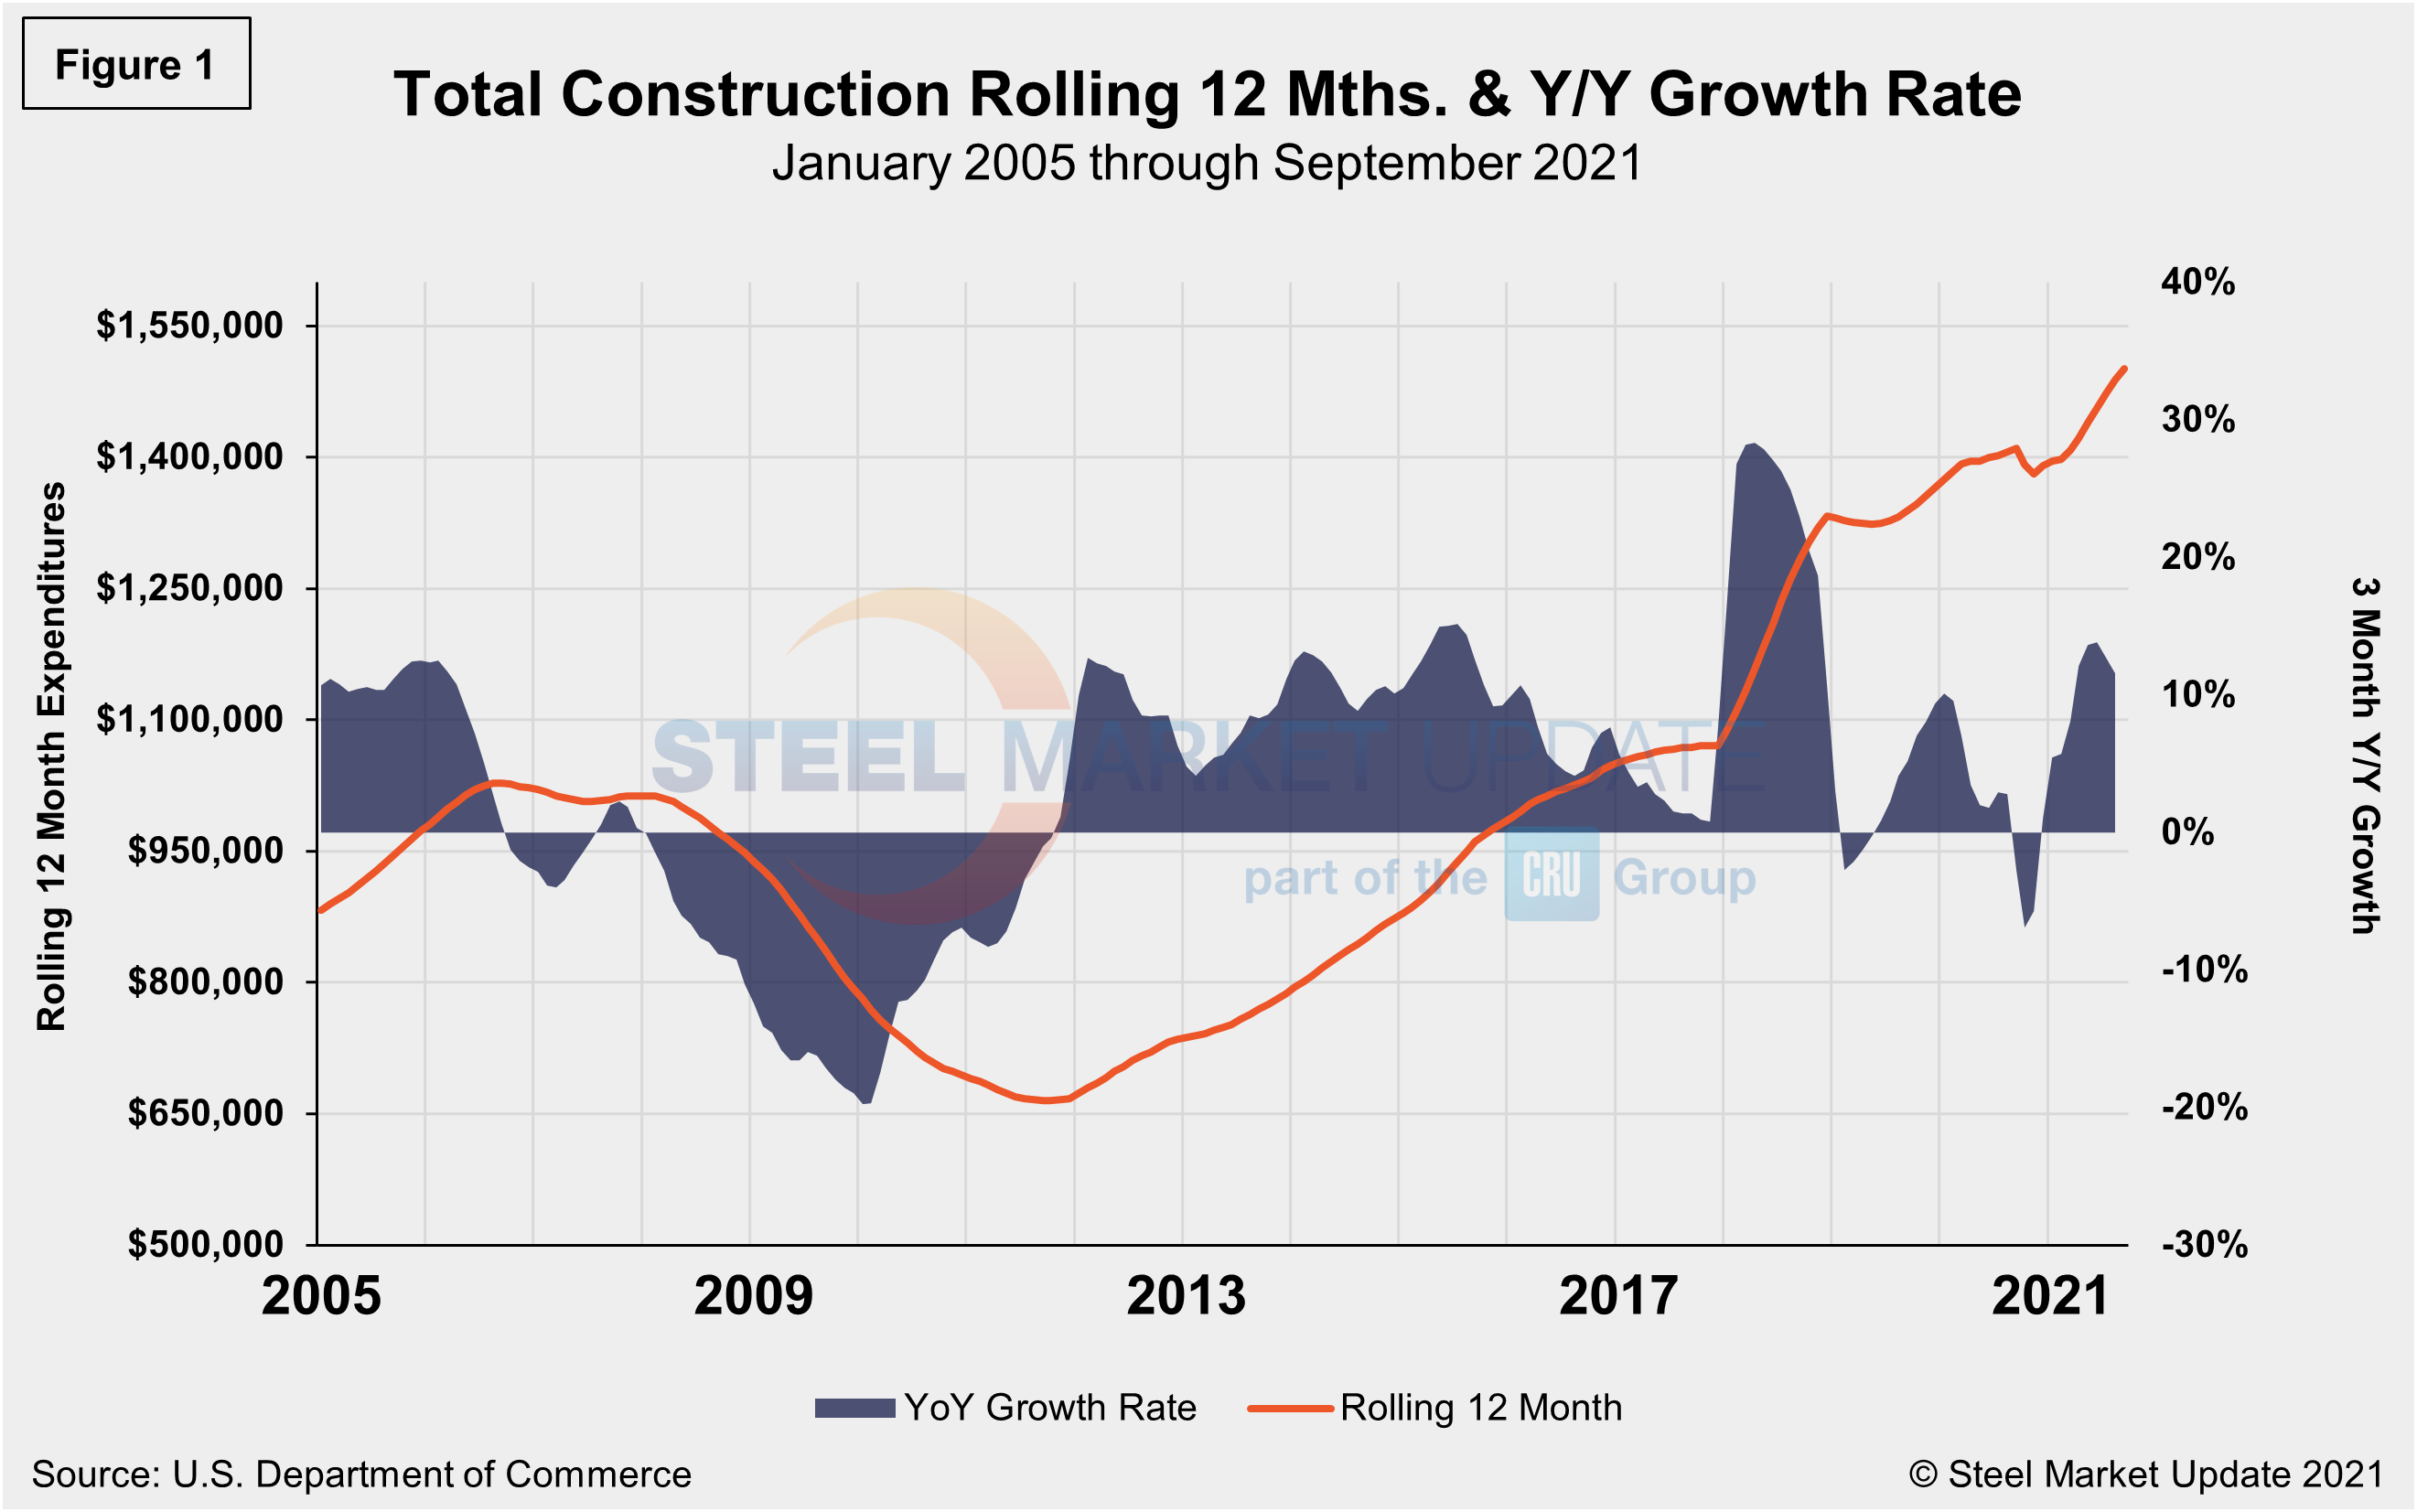
Total construction expenditures and its major categories are shown in the table and chart (Figure 1) below.
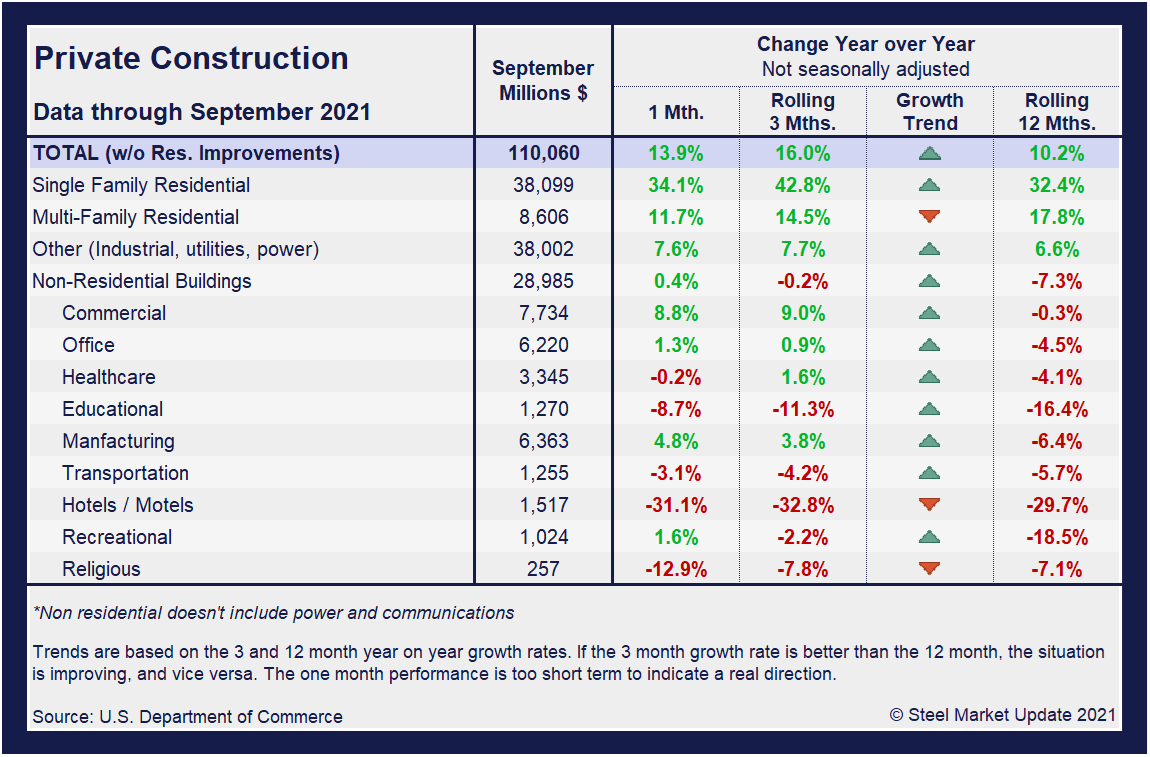
Private Construction
The breakdown of private expenditures into residential and nonresidential and their subsectors are highlighted in the table below. Private construction spending increased 13.9% year over year to an annual rate of $1.230 trillion. Within that category, private residential construction spending rose 34.1% annually while private nonresidential was up marginally, just 0.4% higher over the same period.
Spending on private construction projects decreased 0.5% in September after falling 0.3% in August. Outlays on residential construction dropped 0.4% after nudging up 0.1% in August. Single-family homebuilding spending declined 0.6% and outlays on multifamily housing projects slipped 0.3%.
Shortages and more expensive building materials are holding back homebuilding. Residential investment contracted for a second straight quarter in Q3, weighed down by declines in home improvements and single-family homebuilding.
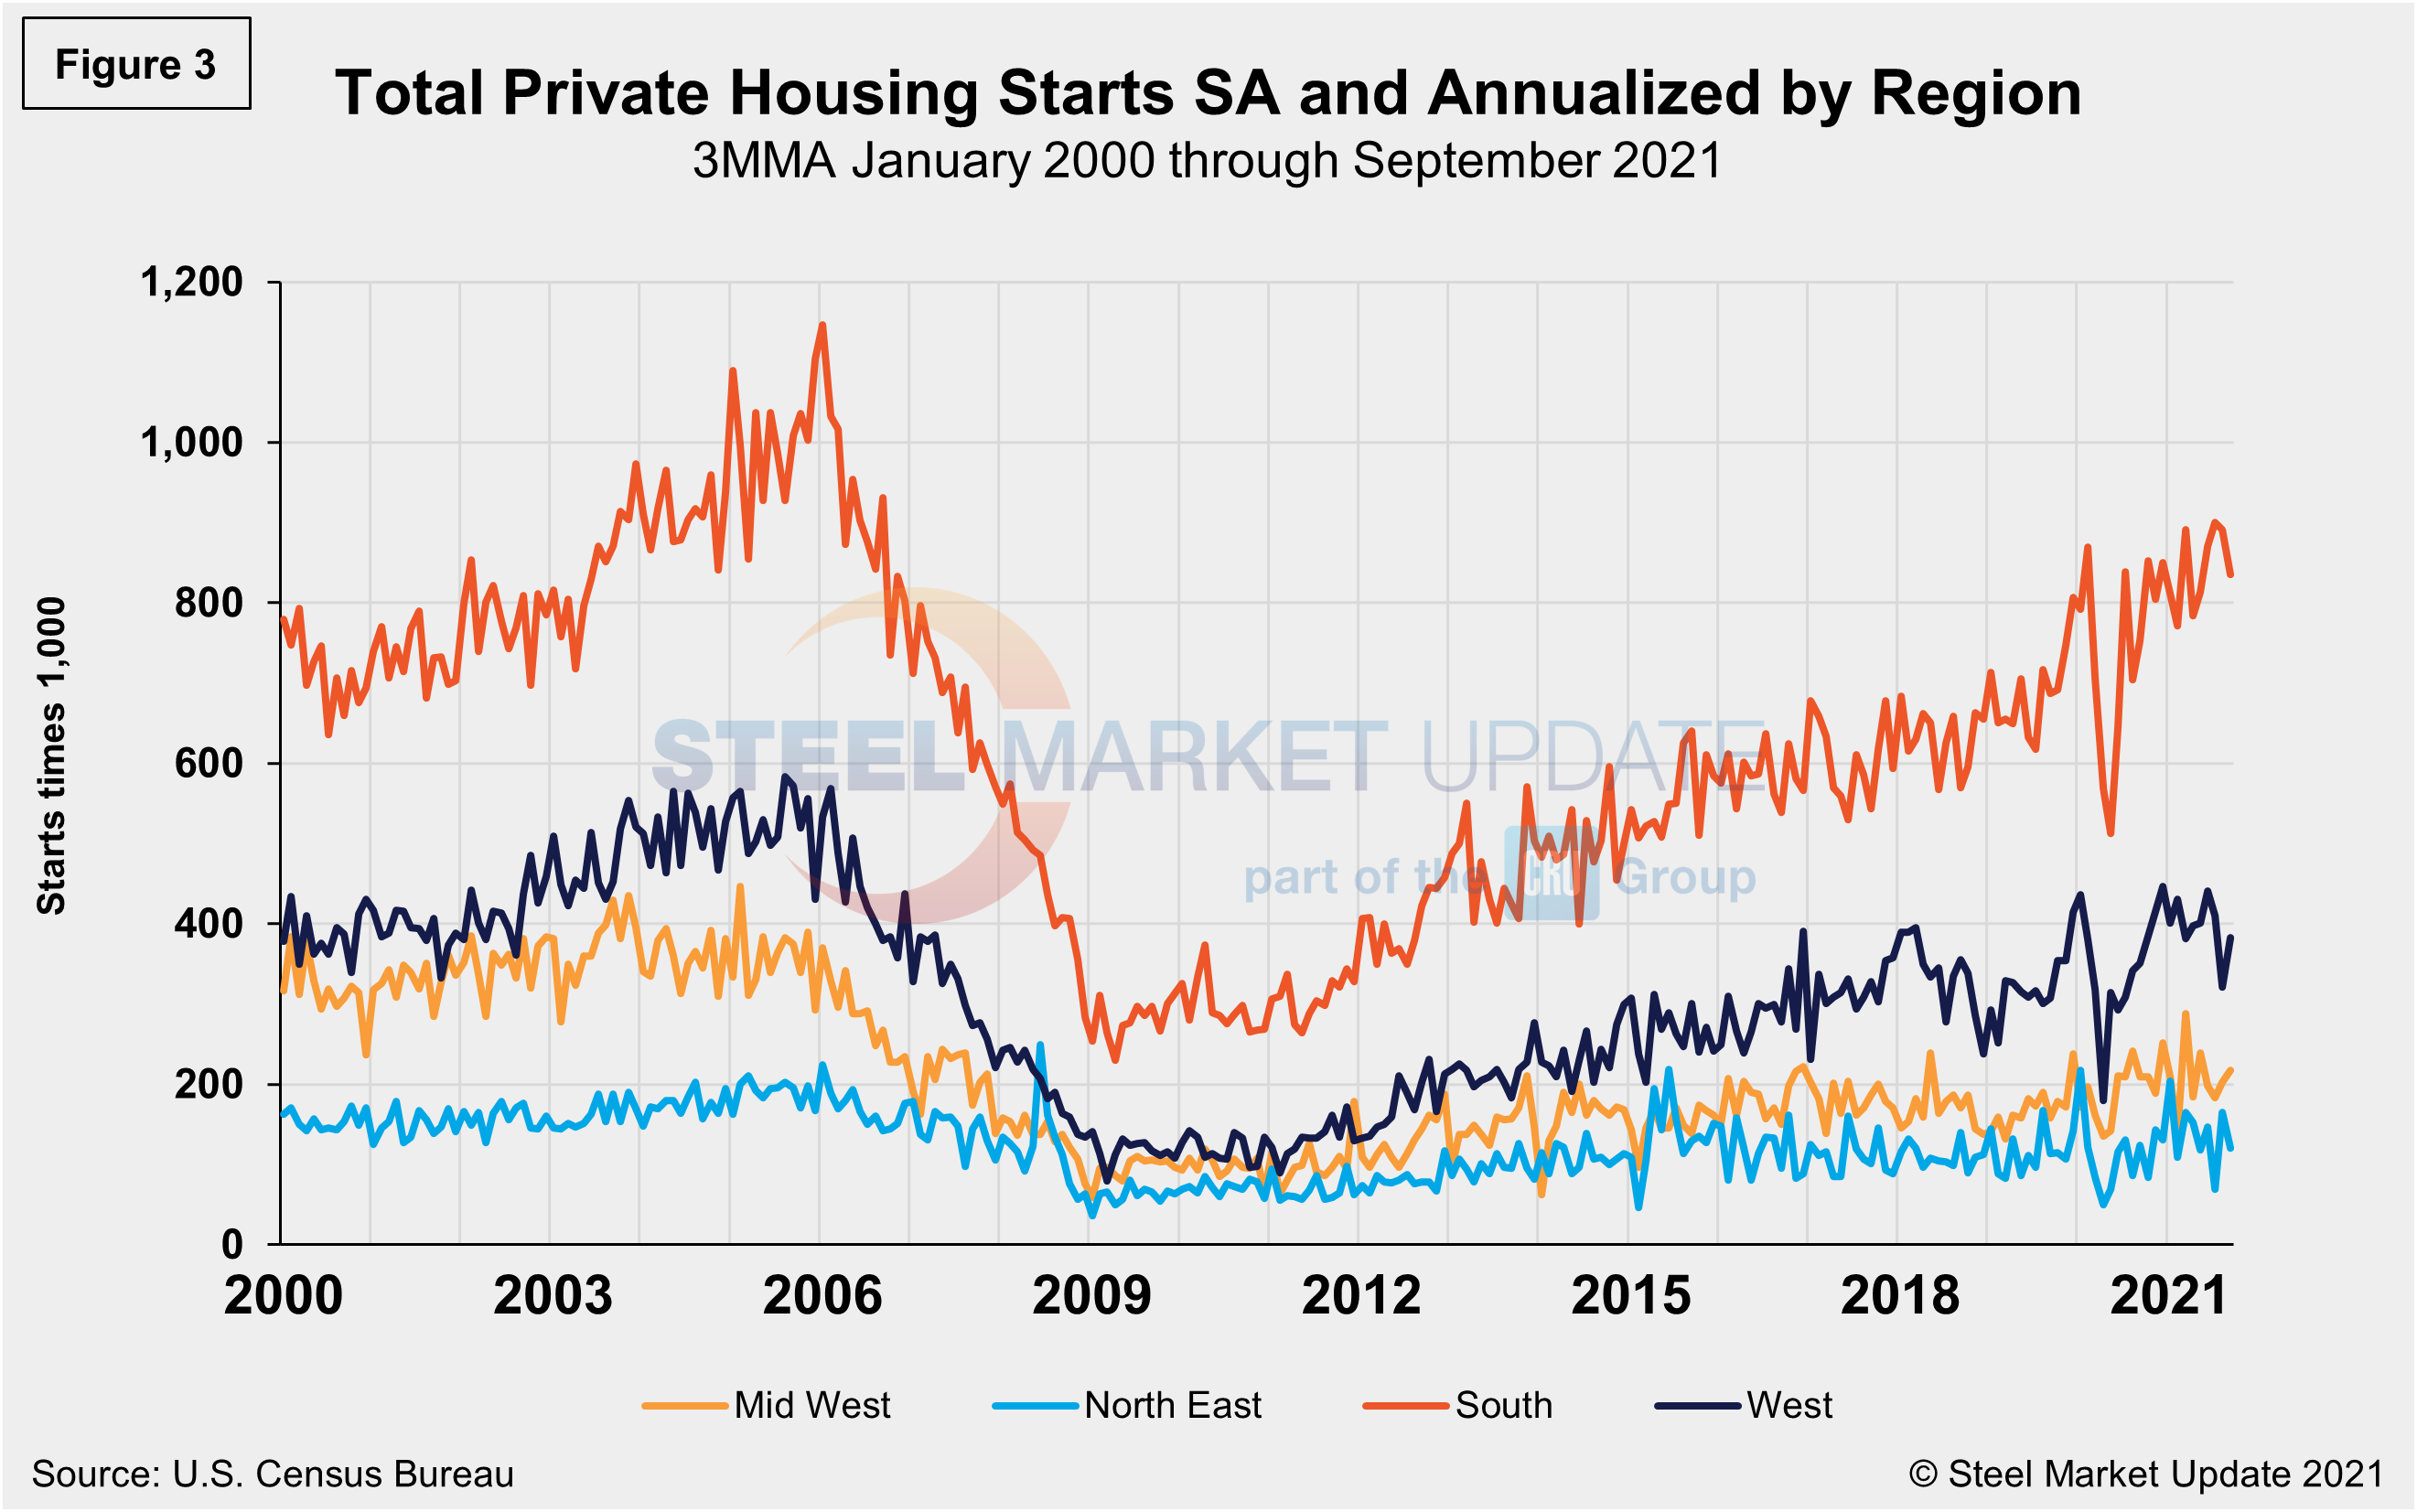
Total housing starts in the four regions are displayed below (Figure 3). Privately‐owned housing starts in September were at a seasonally adjusted annual rate of 1.555 million, down 1.6% from the revised August estimate of 1.580 million. The decrease was driven by a multifamily slowdown, which made up a significant share of total starts. Both single-family and multifamily properties have struggled with similar labor and material shortages.
September’s rate is 8.2% above the year-ago rate. Single‐family housing starts in September were at a rate of 1.080 million, unchanged from the revised August figure. September’s total was also down by 40.8% from the peak of 1.823 million seen in January 2006.
The South region continues to be the strongest for housing starts at 835,000 in September, besting the West—the second-place region—by nearly three times. The Northeast continued to trail the other three regions with just 120,000 starts in September. All four regions were directly impacted by the widespread COVID-19 shutdowns last year, causing housing starts to fall sharply. Since then, they have recovered to pre-pandemic levels, but have seen recent decreases due to supply-side limitations and rising material costs.
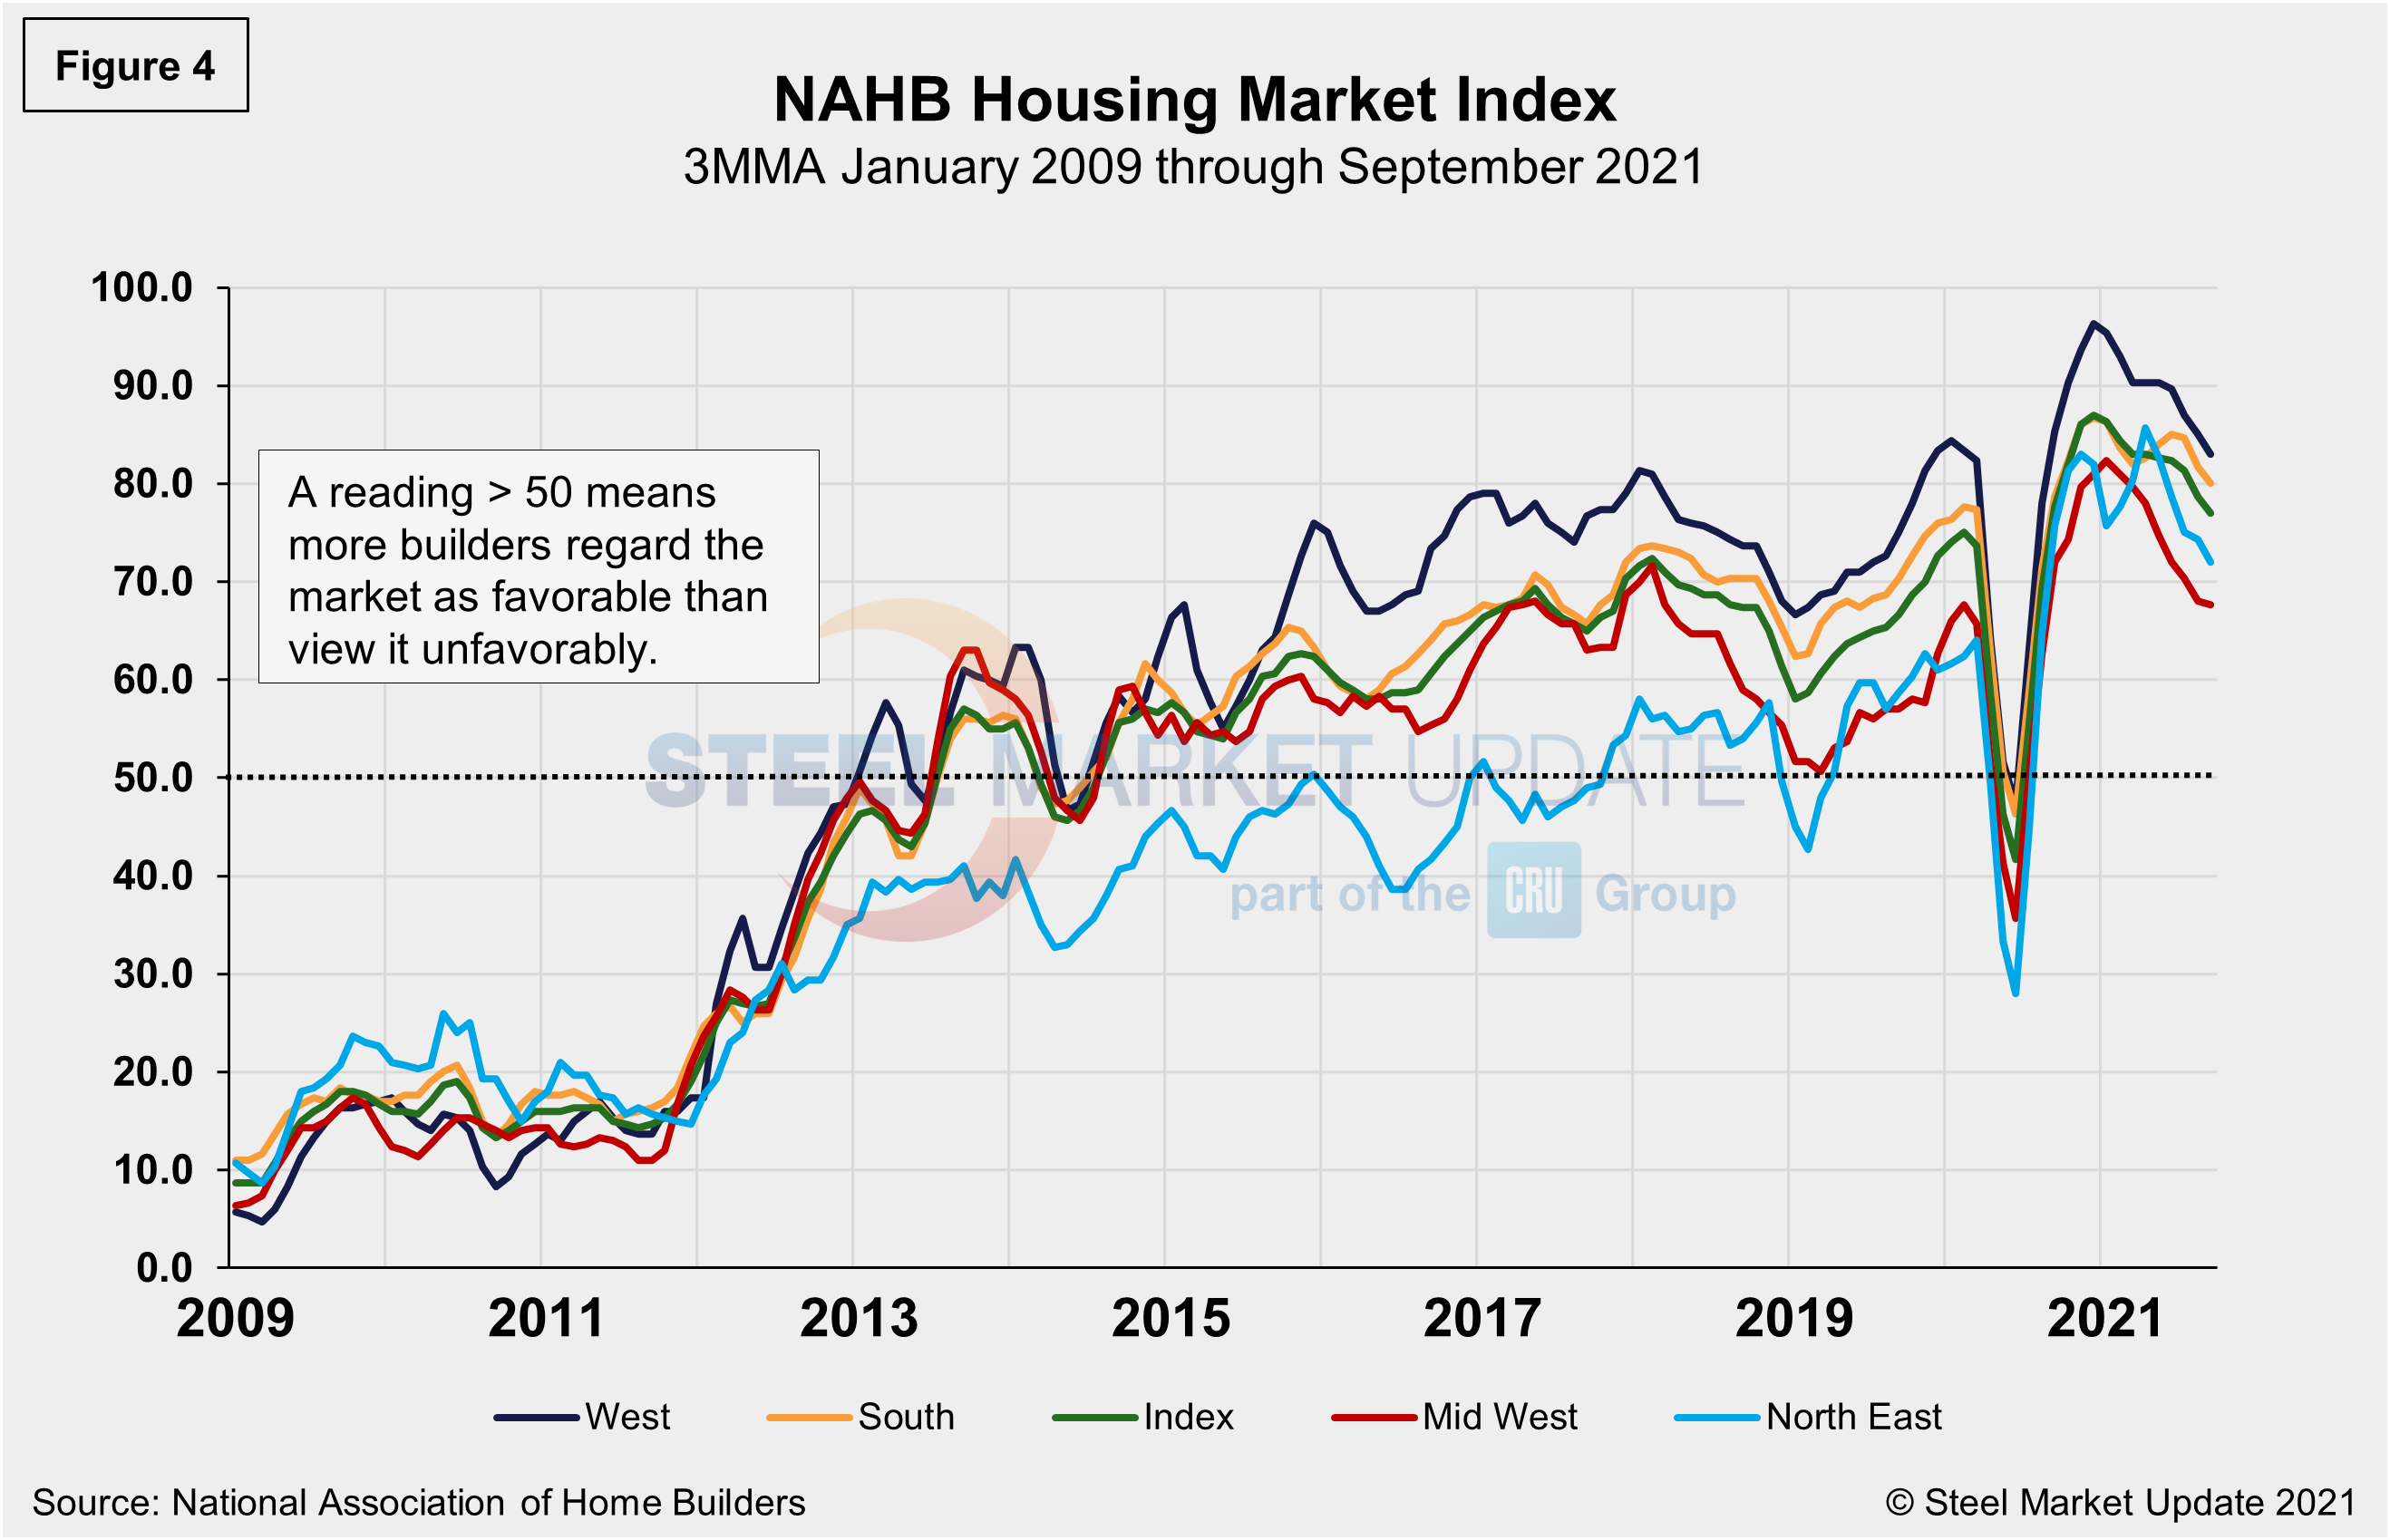
The National Association of Home Builders Optimism Index nearly crashed in April 2020 at the onset of COVID-19, but recovered well through December last year. Since the beginning of 2021, optimism among home builders has fluctuated within a small range, but has been waning of late due to the high costs of lumber and other building materials and the shortage of skilled labor. The index registered 76 in September, a slight increase from 75 the month prior, following three straight months of decreases. Advance reports indicate that the index may rise further in October (Figure 4).
State and Local Construction
Spending on public construction projects tumbled 0.7% in September to $343.7 billion after increasing 1.2% in August. Outlays on state and local government construction projects fell 0.4%; federal government spending plunged 4.3%. Seasonally adjusted, educational construction’s annual rate was $80.7 billion, or 0.9% above the revised August estimate, while highway construction was $98.8 billion, or 0.7% percent lower than the prior month.
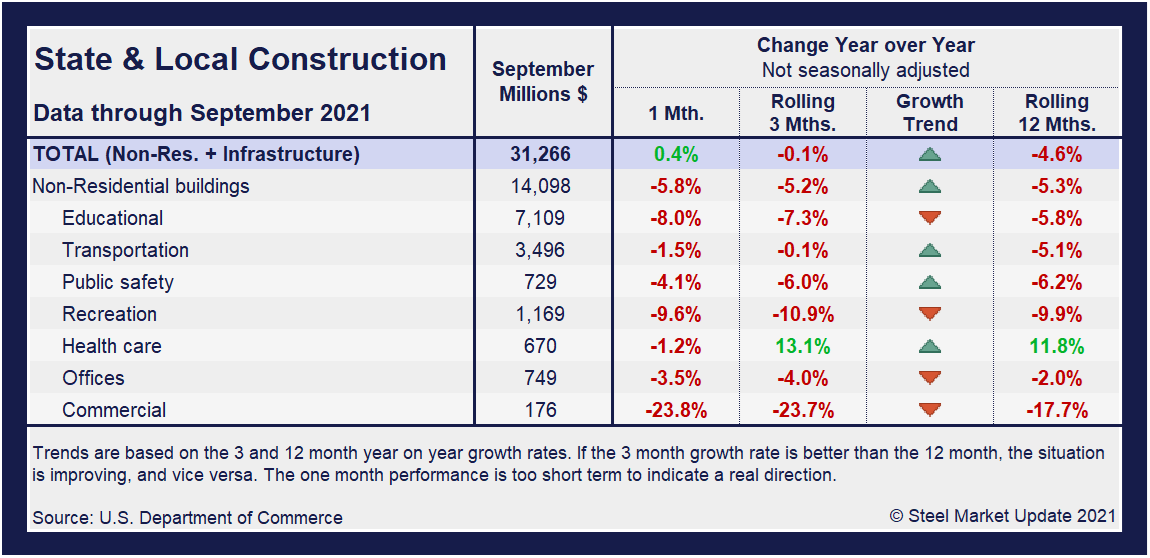
Construction expenditures on a state and local level remain the most impacted by the 18-month-long health crisis. Notably, on a year-on-year and rolling three-month basis, these construction categories and subcategories are still behind pre-pandemic levels – the sole exception being health care outlays. The table below details a struggling sector where nearly two-thirds are still trending down.
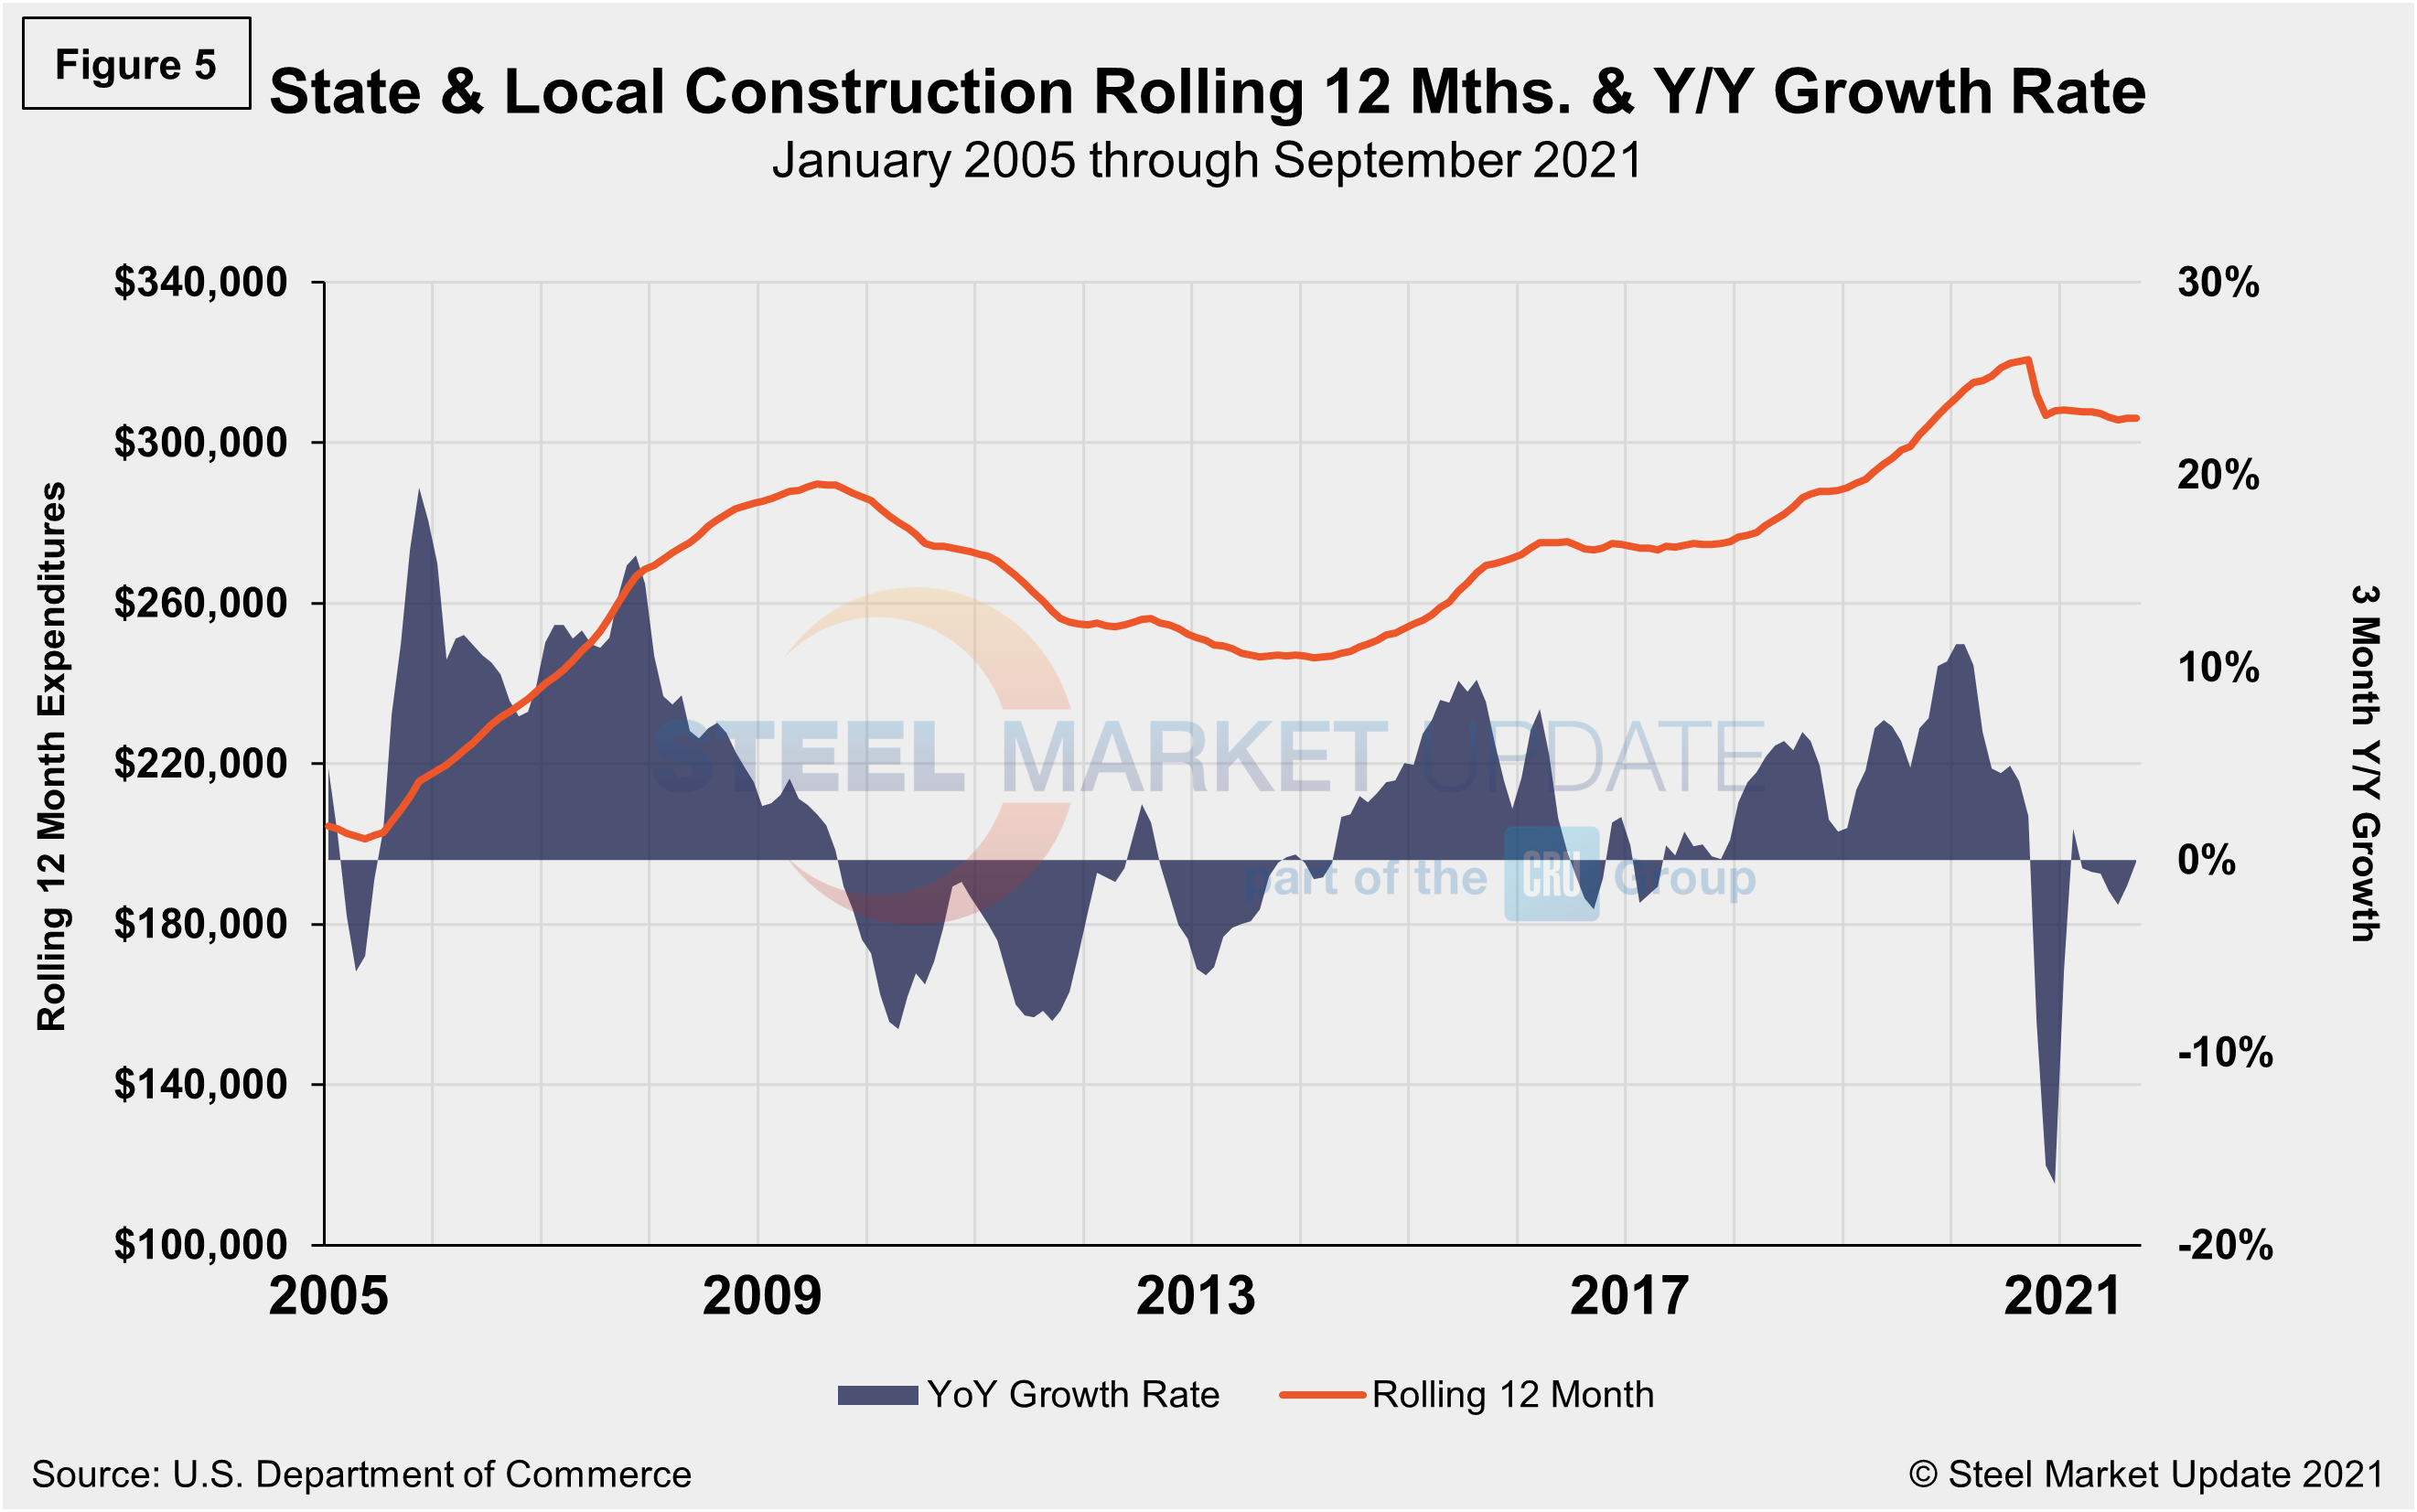
In three months through September, overall state and local construction was up 0.4%, a slight improvement from the month prior when the sector was down 2.0%. Transportation, public safety, and health care, though still lagging pre-pandemic levels, are the subcategories currently trending up. Figure 5 shows the history of total S&L expenditures.
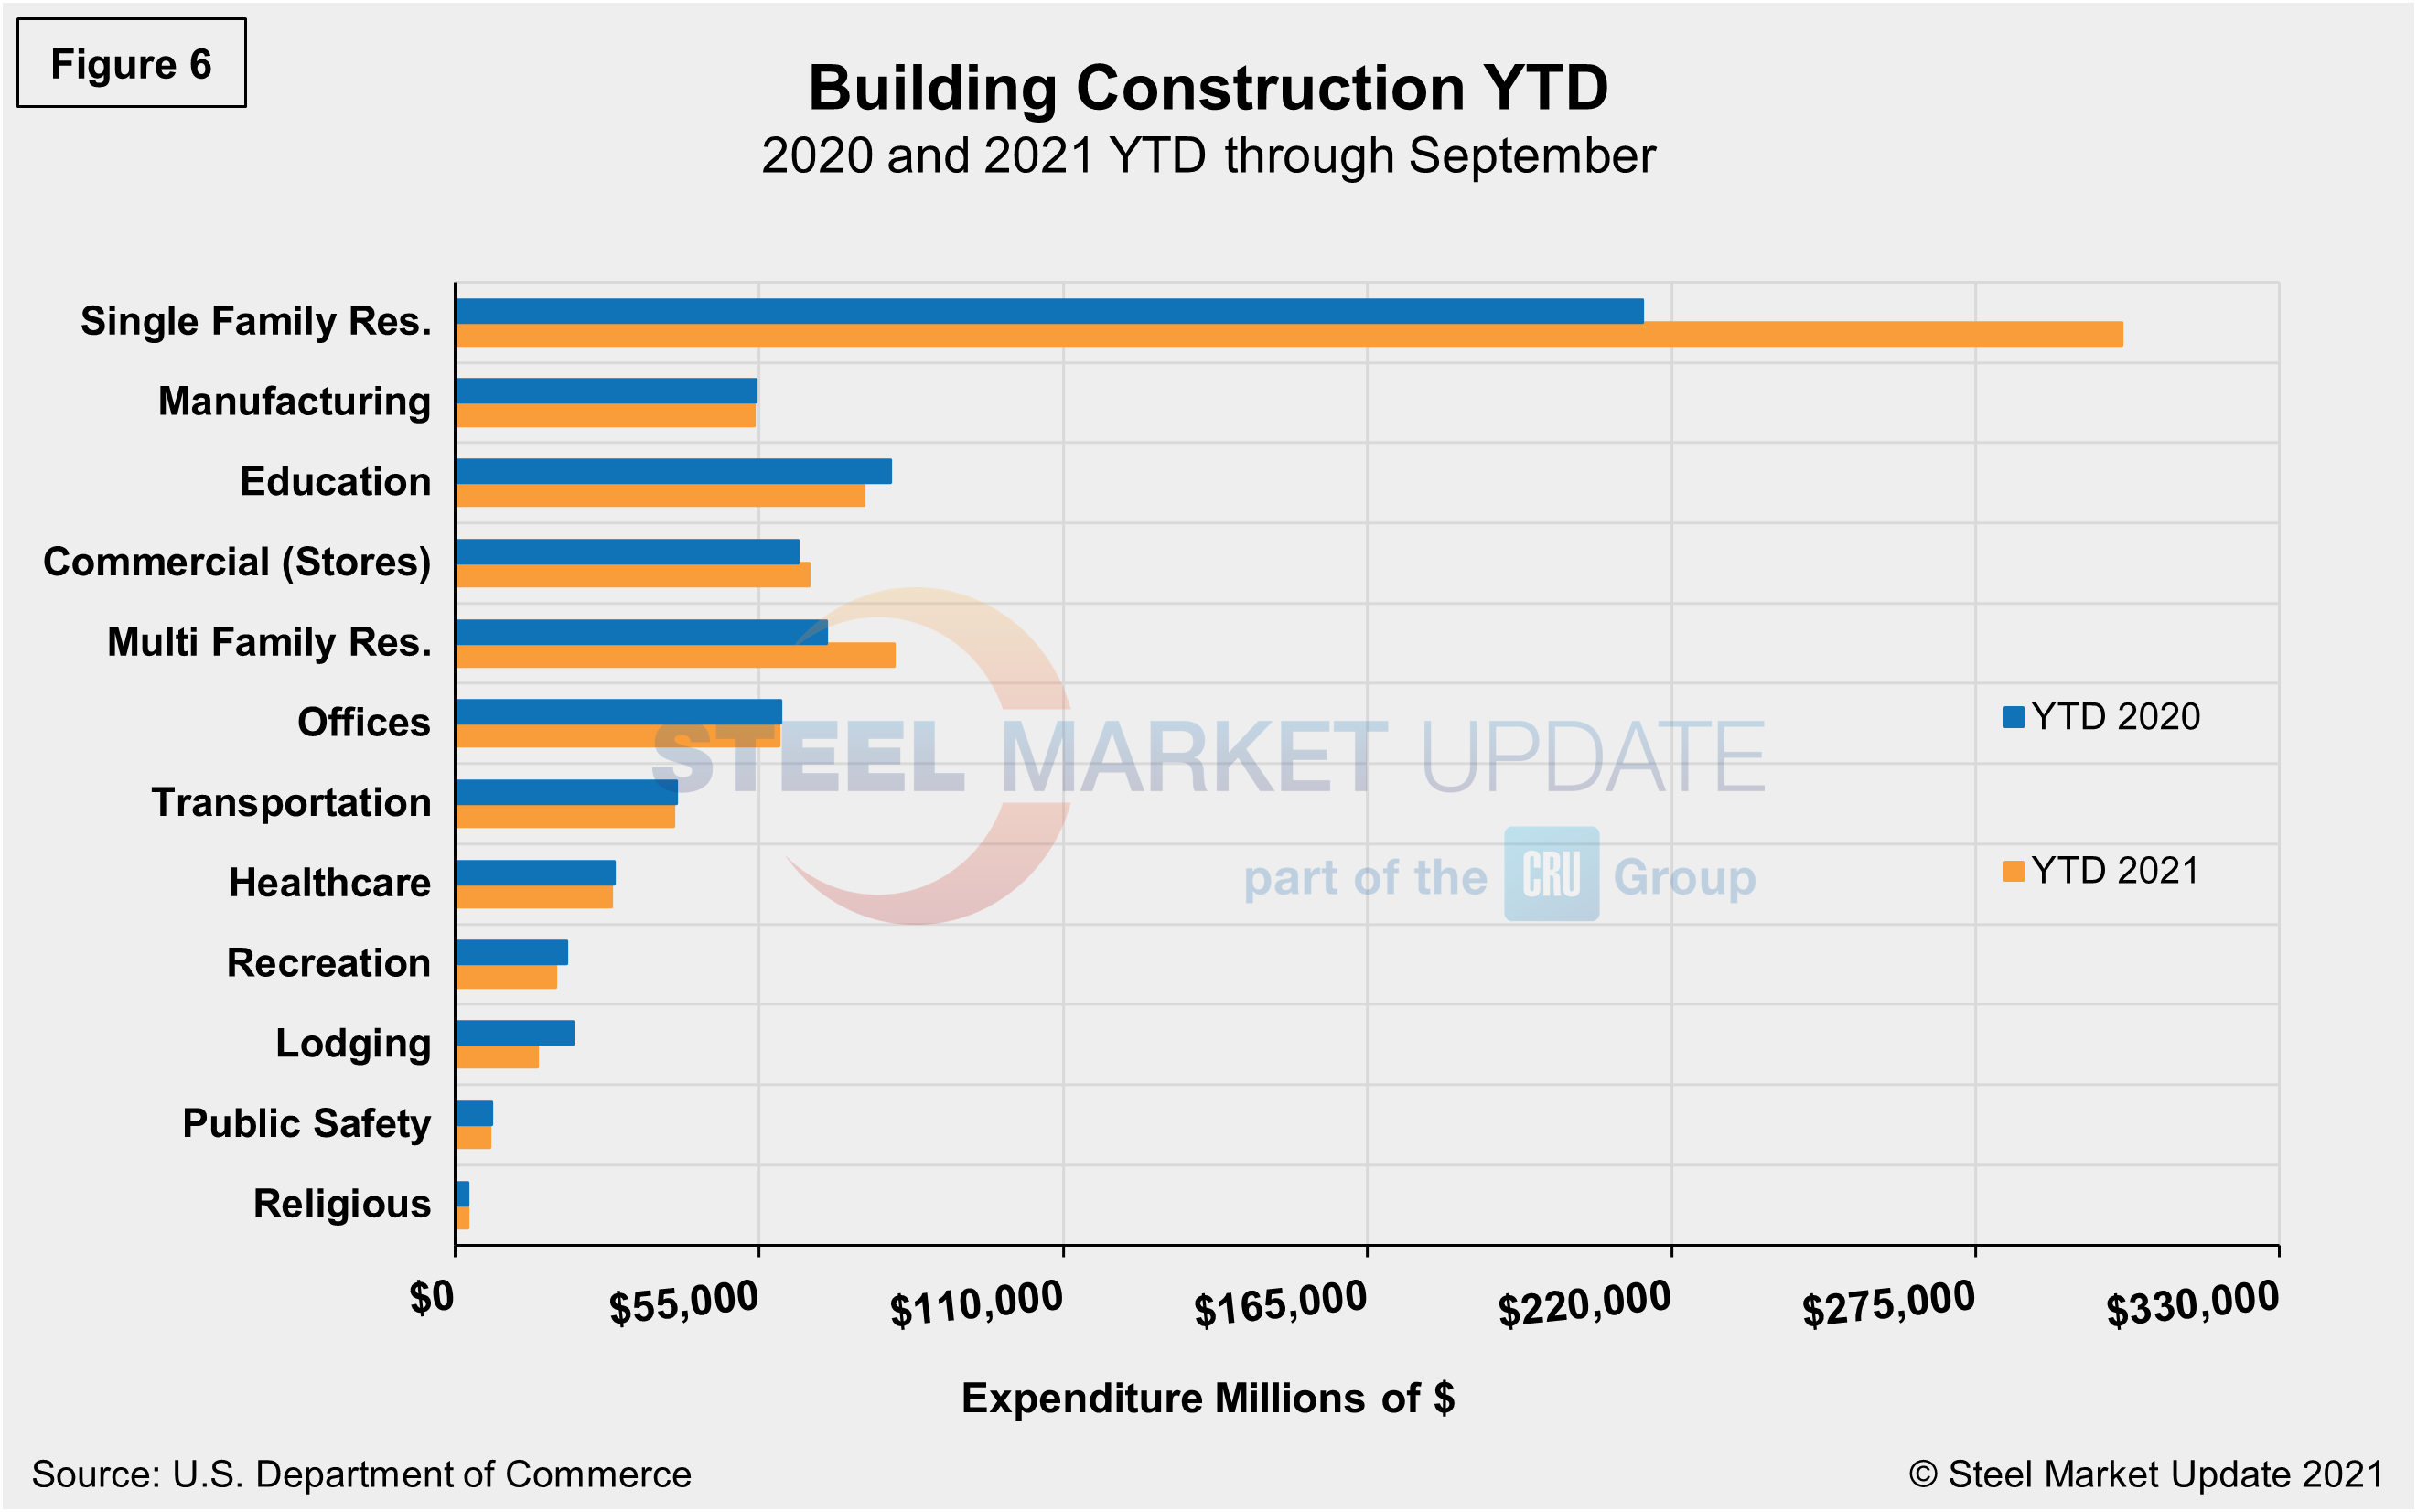
Year-to-date expenditures for construction of the various building sectors for 2020 and 2021 are compared in Figure 6. Single-family residential construction was dominant in 2020 with expenditures totaling an annualized $301.9 billion. To date, 2021 has been the same. Through August, expenditures for single-family construction were $301.5 billion, nearly matching 2020’s total and 40.4% above year-ago levels when expenditures were $214.8 billion. Multifamily residential at 18.4% and commercial at 3.4%, are the only other subsectors experiencing year-to-date expansion compared to the same year-ago period. Lodging is behind by double digits at 29.9% year on year, followed by recreation and education, down 9.9% and 6.2%, respectively.
Explanation: Each month, the Commerce Department issues its Construction Put in Place (CPIP) data, usually on the first working day covering activity one month and one day earlier. There are three major categories based on funding source: private, state and local, and federal. Within these three groups are about 120 subcategories of construction projects. SMU analyzes the expenditures from the three funding categories to provide a concise summary of the steel-consuming sectors.
By David Schollaert, David@SteelMarketUpdate.com