

Market Data

November 8, 2021
U.S. Job Creation: Labor Market Snaps Back in October
Written by David Schollaert
U.S. job creation roared back in October as payrolls rose by 531,000, a welcome contrast to the weak outcome the month prior. The mark was unexpected, as total jobs exceeded most estimates by nearly 100,000 and the unemployment rate fell to 4.6%, the Labor Department reported.
Private payrolls were even stronger, rising 604,000 as a loss of 73,000 government jobs pulled down the headline number. October’s gains represented a sharp pickup from September, which gained 312,000 jobs after the initial Bureau of Labor Statistics (BLS) estimate of 194,000 saw a substantial upward revision in its latest report.
Leisure and hospitality – a critical sector – again led the way, adding 164,000 jobs, a direct response to more Americans venturing out to eating and drinking establishments and increased travel as COVID numbers fell during the month. For 2021, the sector has reclaimed 2.4 million positions lost during the pandemic.
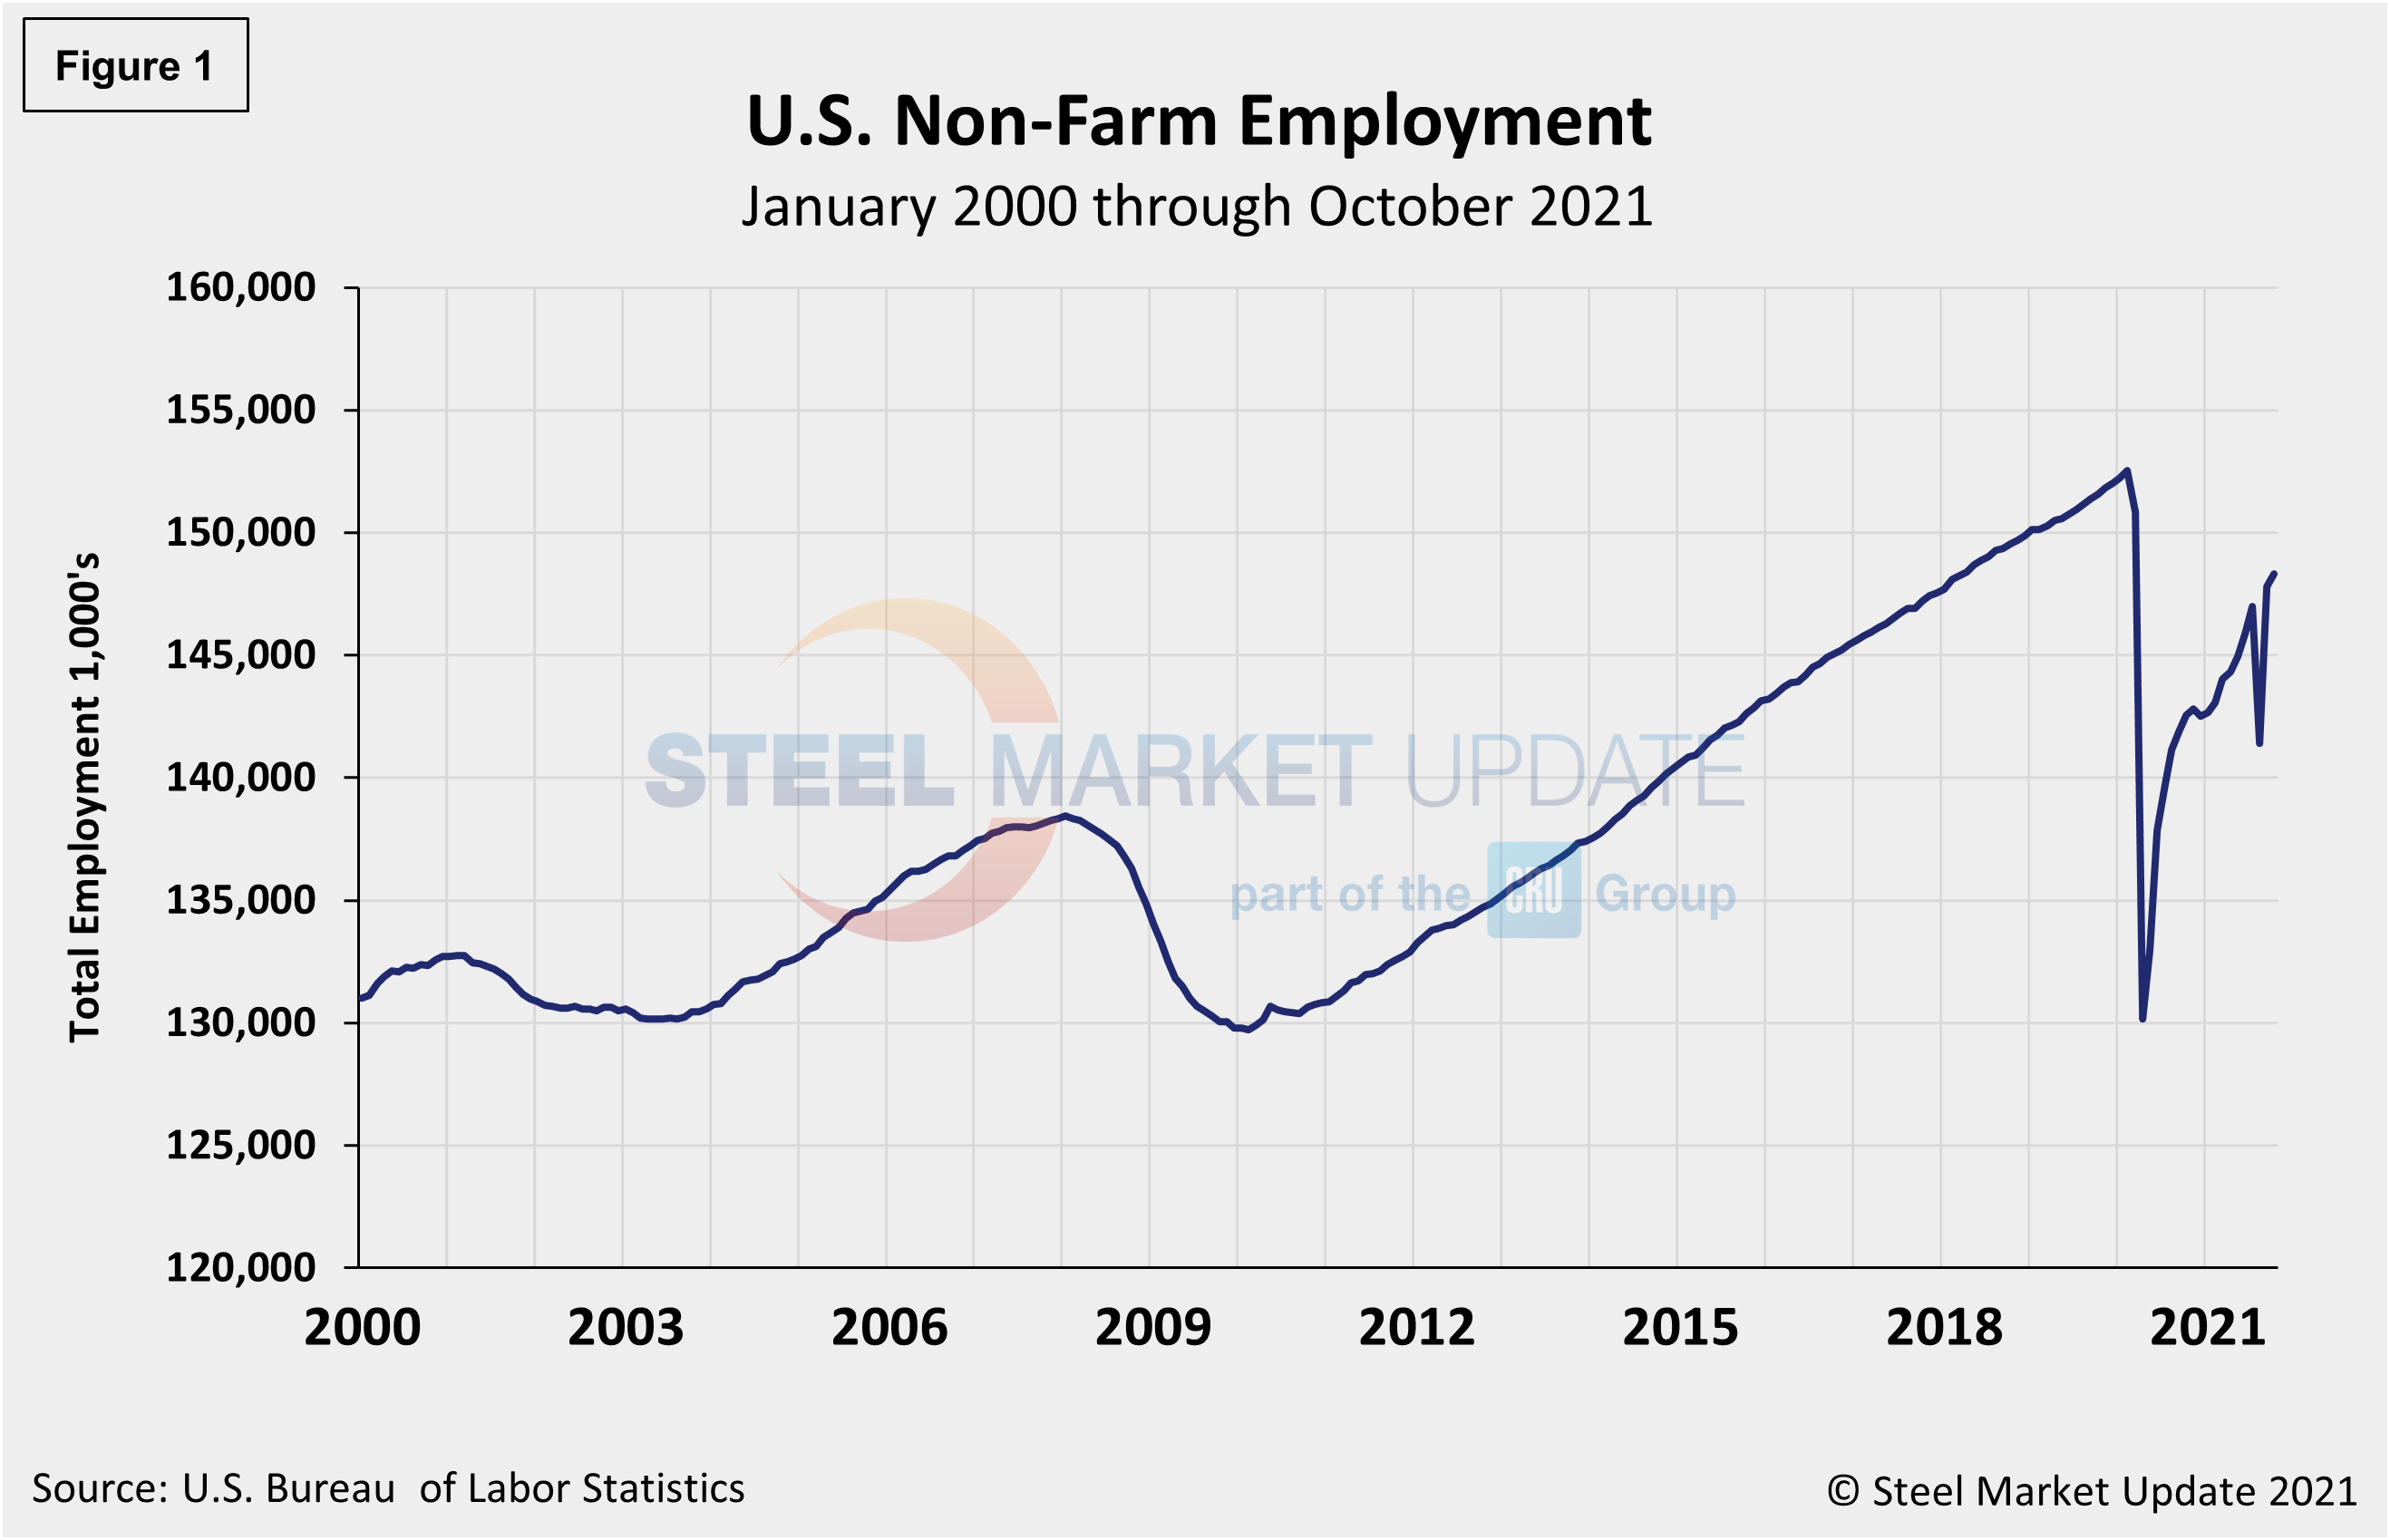
Other sectors posting solid gains in October included professional and business services, which saw an uptick of 100,000 new jobs, while manufacturing added 60,000 to their payrolls, and transportation and warehousing was boosted by 54,000 additional positions. Construction added 44,000 jobs while health care was up 37,000 and retail added 35,000 to the workforce. Figure 1 shows the total number of nonfarm workers employed in the U.S. since 2000.
The latest improvements followed a late-summer lull caused by another coronavirus surge worsened by supply-chain challenges that have delayed shipments, hampered manufacturers and left gaps on store shelves across the nation. The rebound also pushed the unemployment rate down two percentage points, from 4.8% to 4.6% in October. Wages increased 0.4% for the month, while the average work week edged lower by one-tenth of an hour to 34.7 hours.
The number of long-term unemployed (out-of-work for at least 27 consecutive weeks) decreased by 375,000 in October to 2.3 million, but remains 1.2 million higher than in February 2020. The labor force participation rate was unchanged at 61.6%, still well below the 63.3% in February 2020, the month before the pandemic hit.
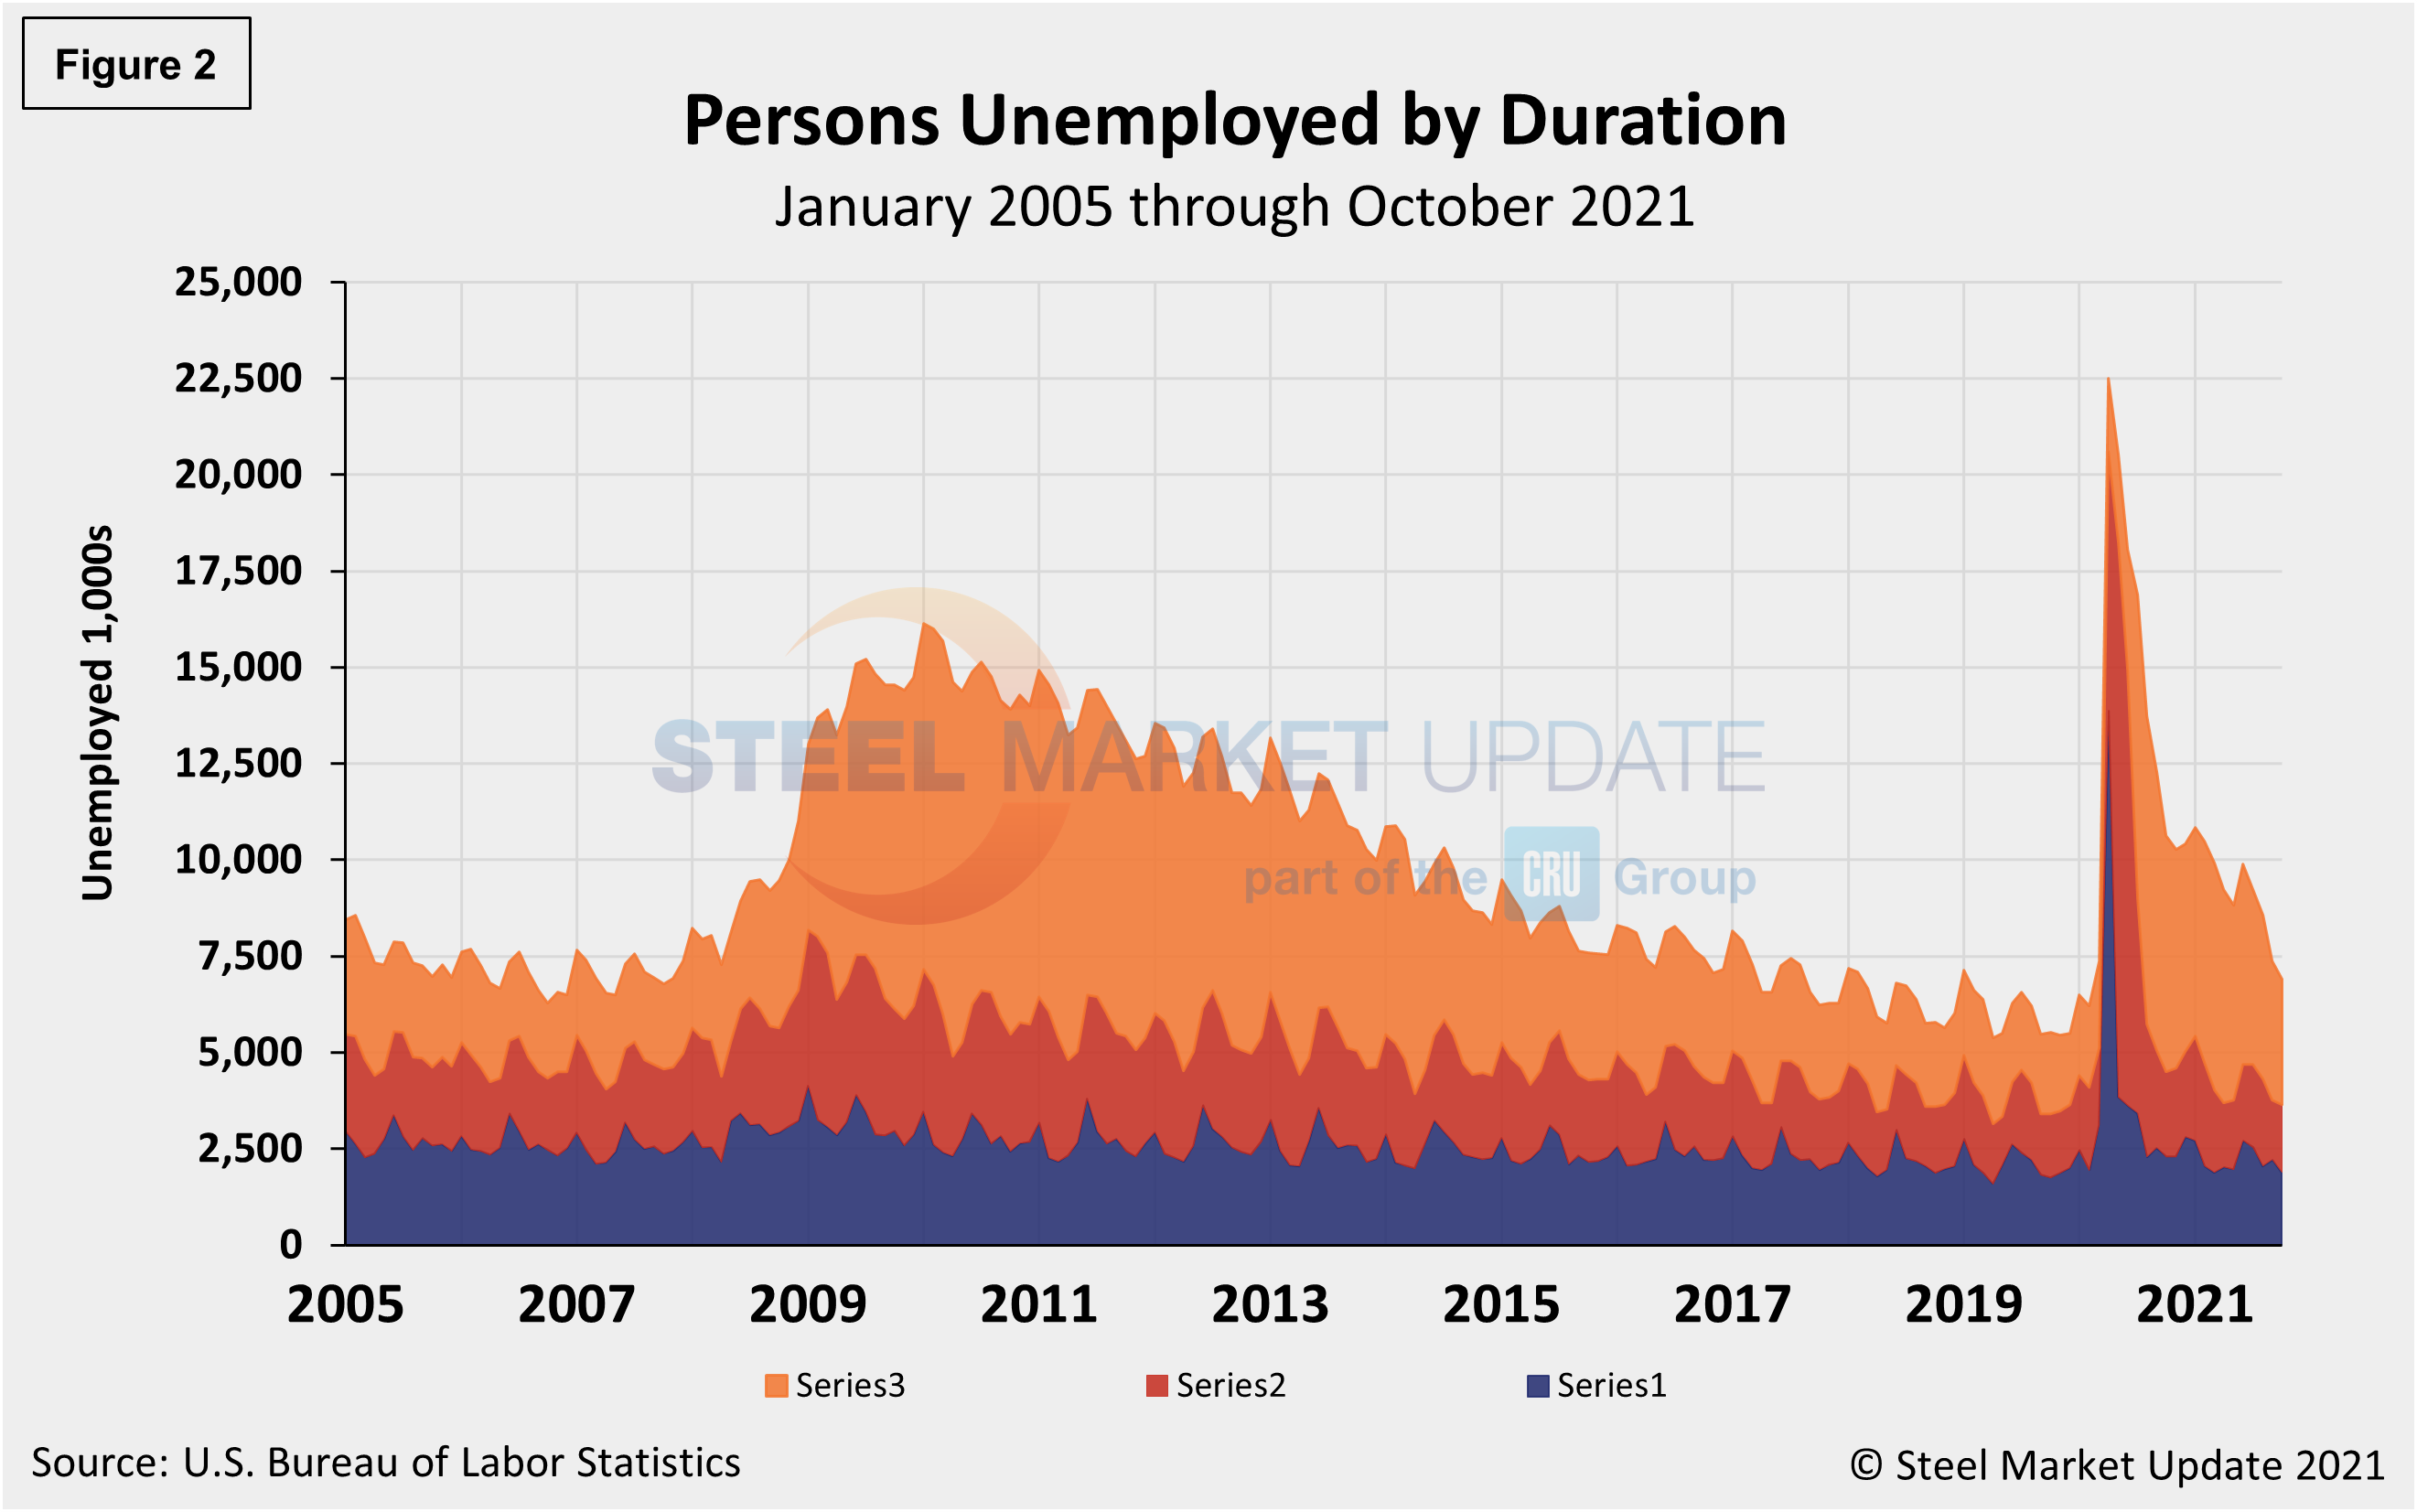
The historical picture for the duration of unemployment since January 2000 is broken down into <5 weeks, 5 to 14 weeks, and >15 weeks below in Figure 2. The total number unemployed was 6.896 million at the end of October, a decrease of 470,000 compared to September. Although unemployment remains above pre-pandemic levels by roughly 678,000 people, about 15.6 million more people now have jobs compared to the 22.5 million thrown out of work during the worst of the pandemic in April of 2020. As of Nov. 5, 47.1% had been unemployed for more than 15 weeks, 25.6% for 5 to 14 weeks, and 27.3% for less than 5 weeks.
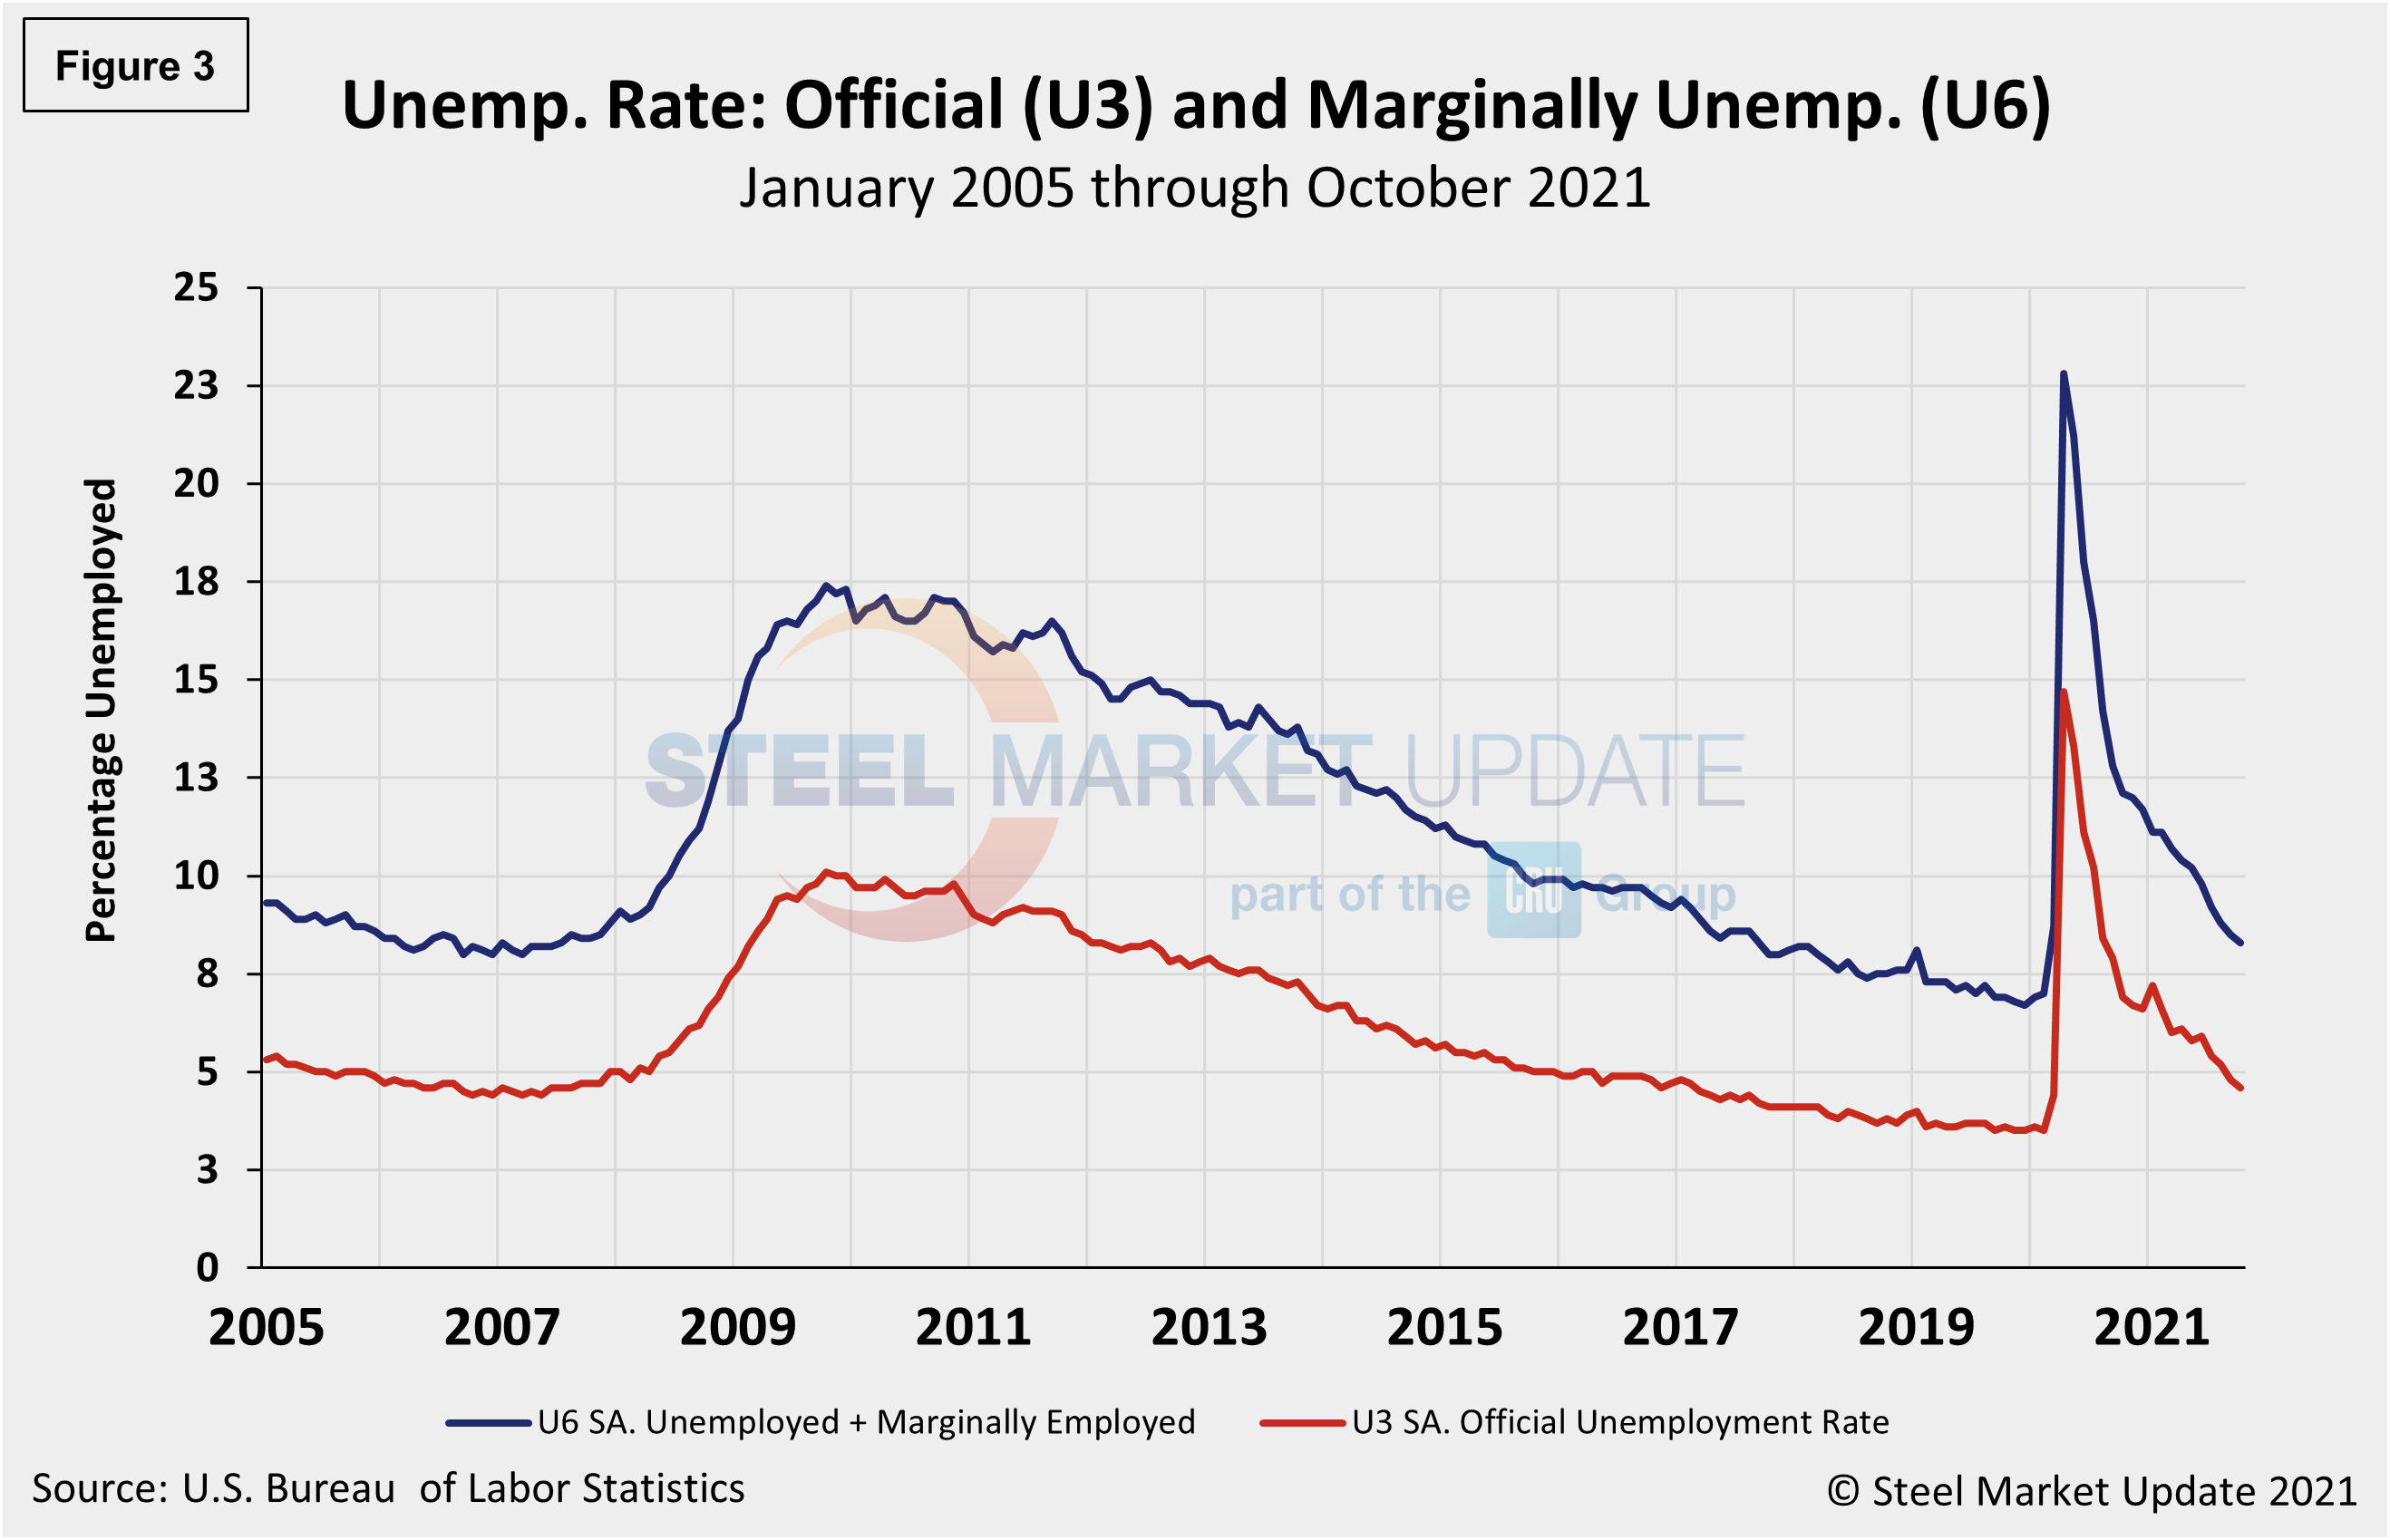
The official unemployment rate, U3, reported in the BLS Household survey (see explanation below) increased from 3.5% in February 2020 to 14.7% in April 2020. Since then, it has trended down at a slow pace. October’s fall to 4.6%, however, was the lowest mark in 19 months as approximately 531,000 people re-entered the labor force. The more comprehensive U6 unemployment rate also dipped last month to 8.3% from 8.5% in September – a continued improvement from 22.8% in April 2020 (Figure 3). U6 includes individuals working part time who want full-time work and those who want to work but are so discouraged they have stopped looking.
The drop in the headline unemployment rate decreased despite a sideways result in the labor force participation rate, unchanged at 61.6% month on month, and still well below the 63.4% in January 2020.
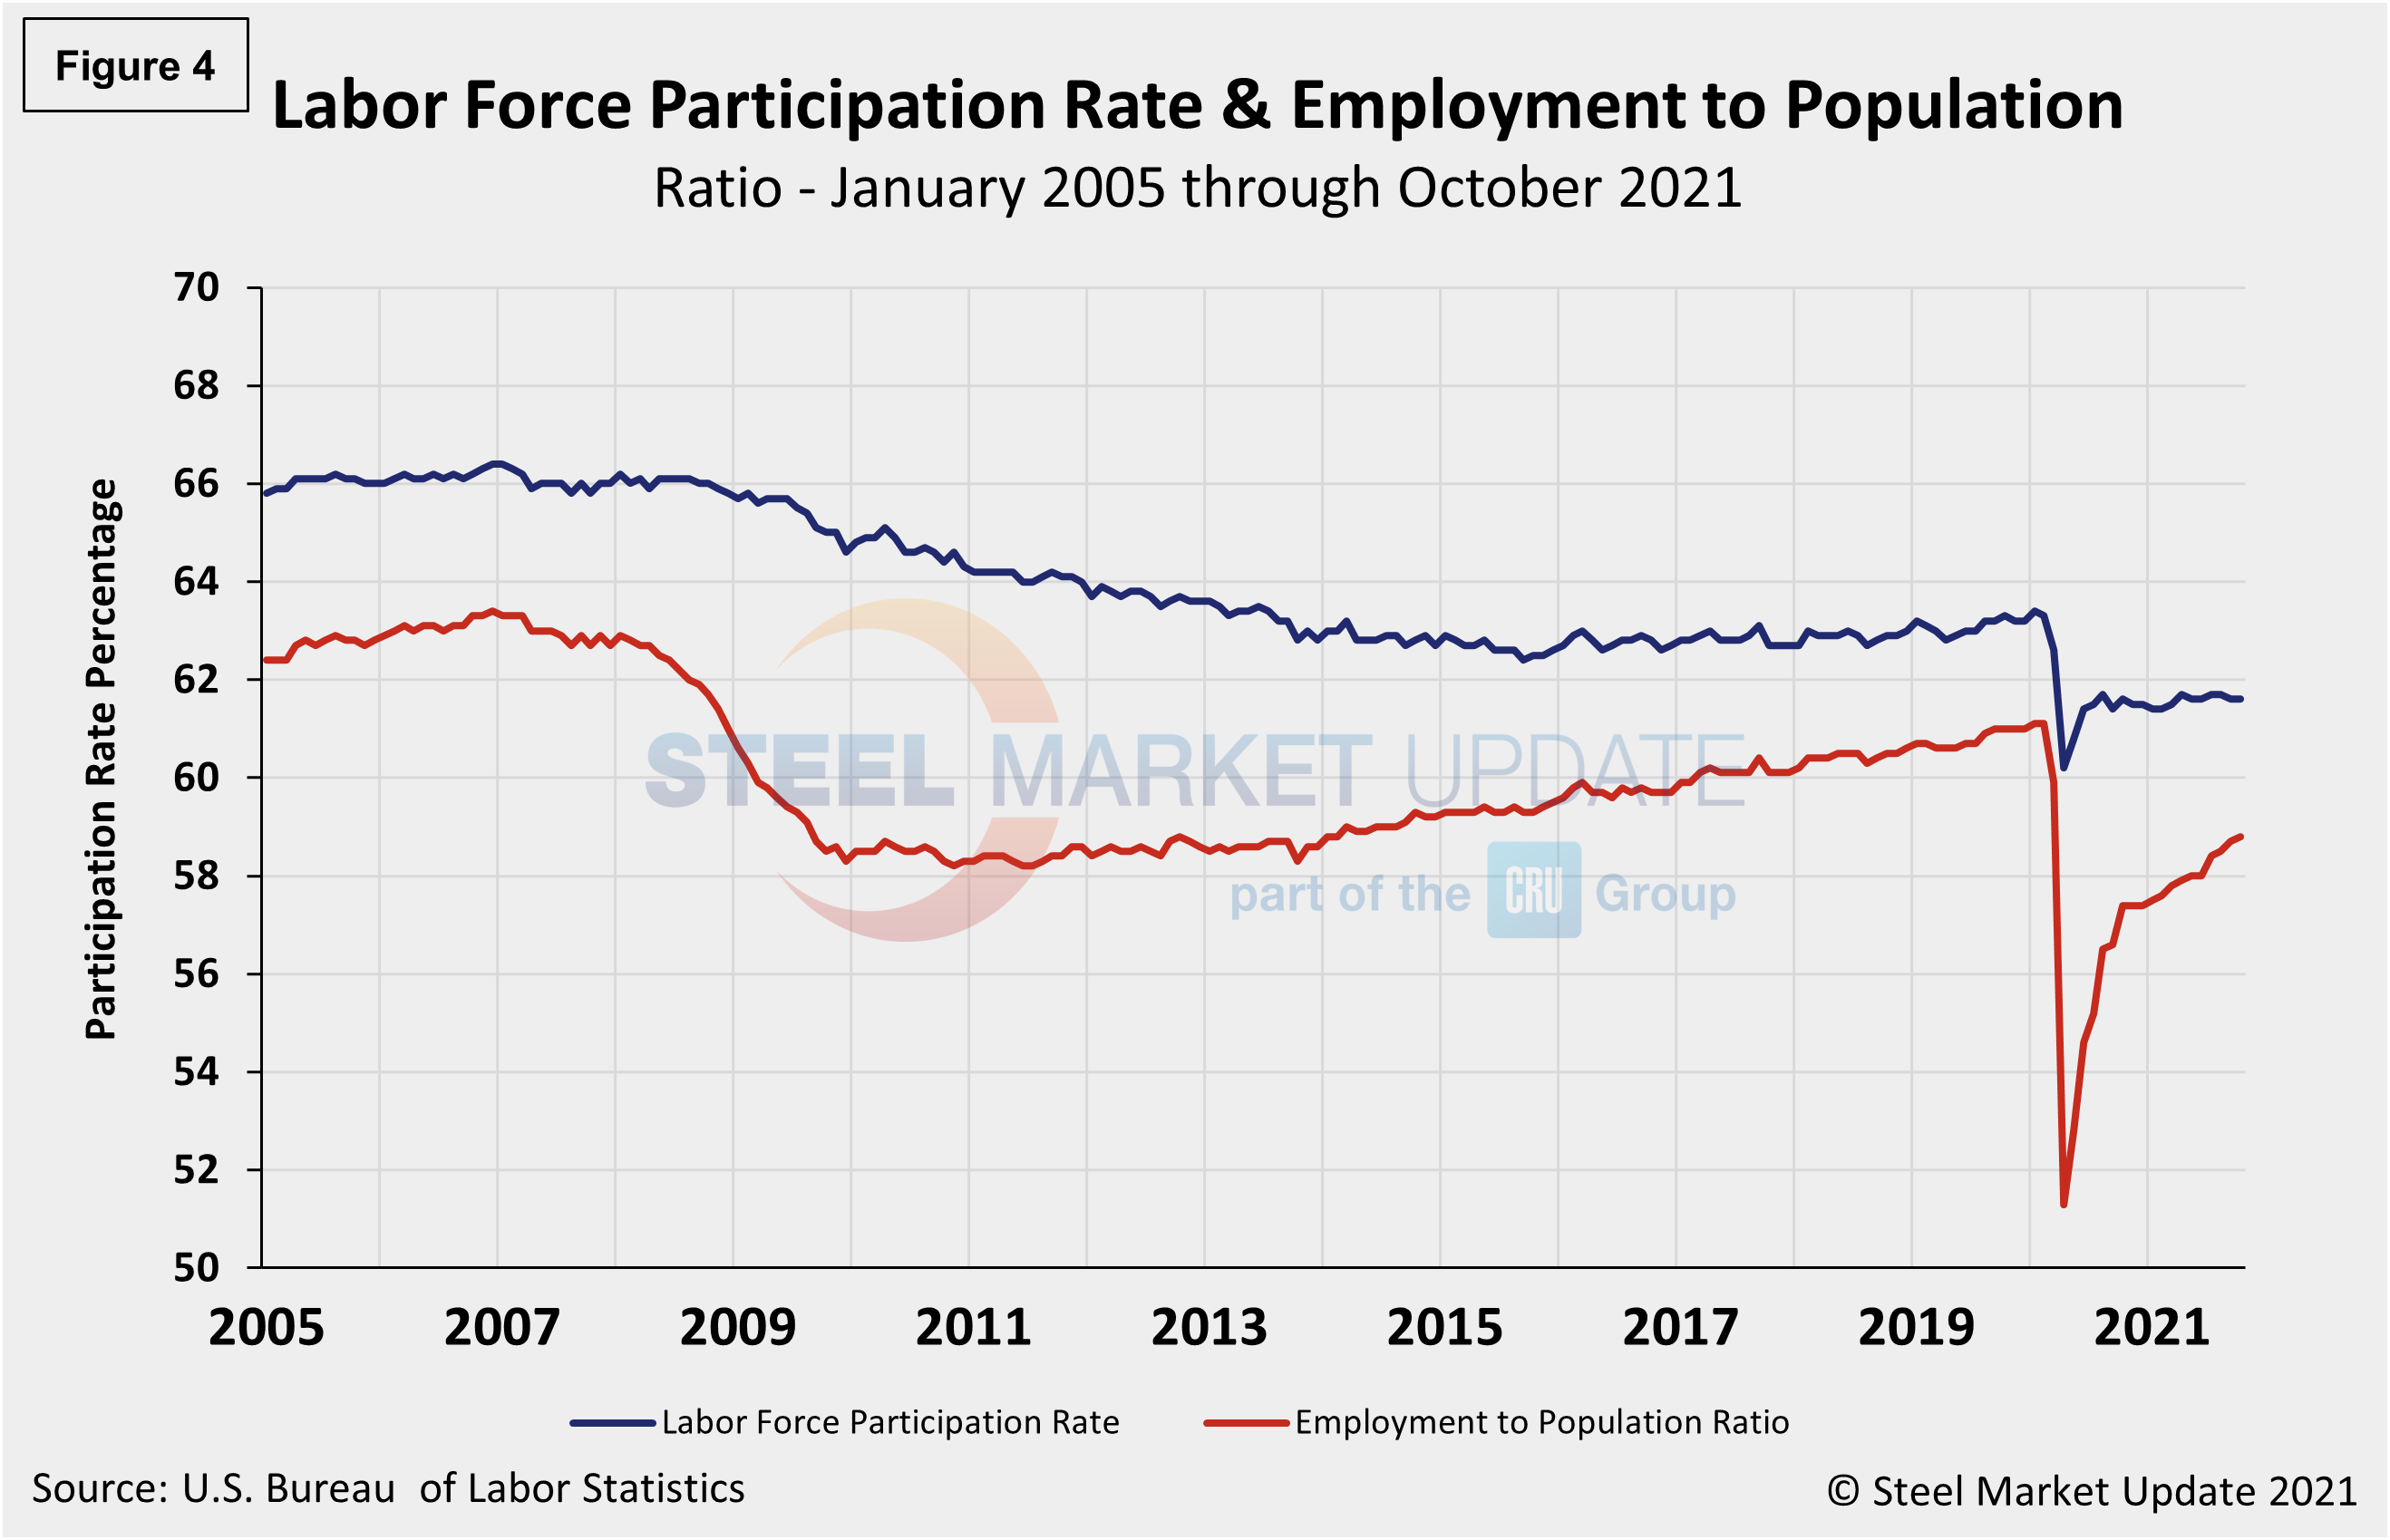
Another gauge, and more definitive view, are the number employed as a percentage of the population. Last month, the employment-to-population ratio was 58.8%, a marginal increase from September when the ratio was 58.7%, highlighting the challenges many companies continue to report in filling openings. Figure 4 shows both measures on one graph.
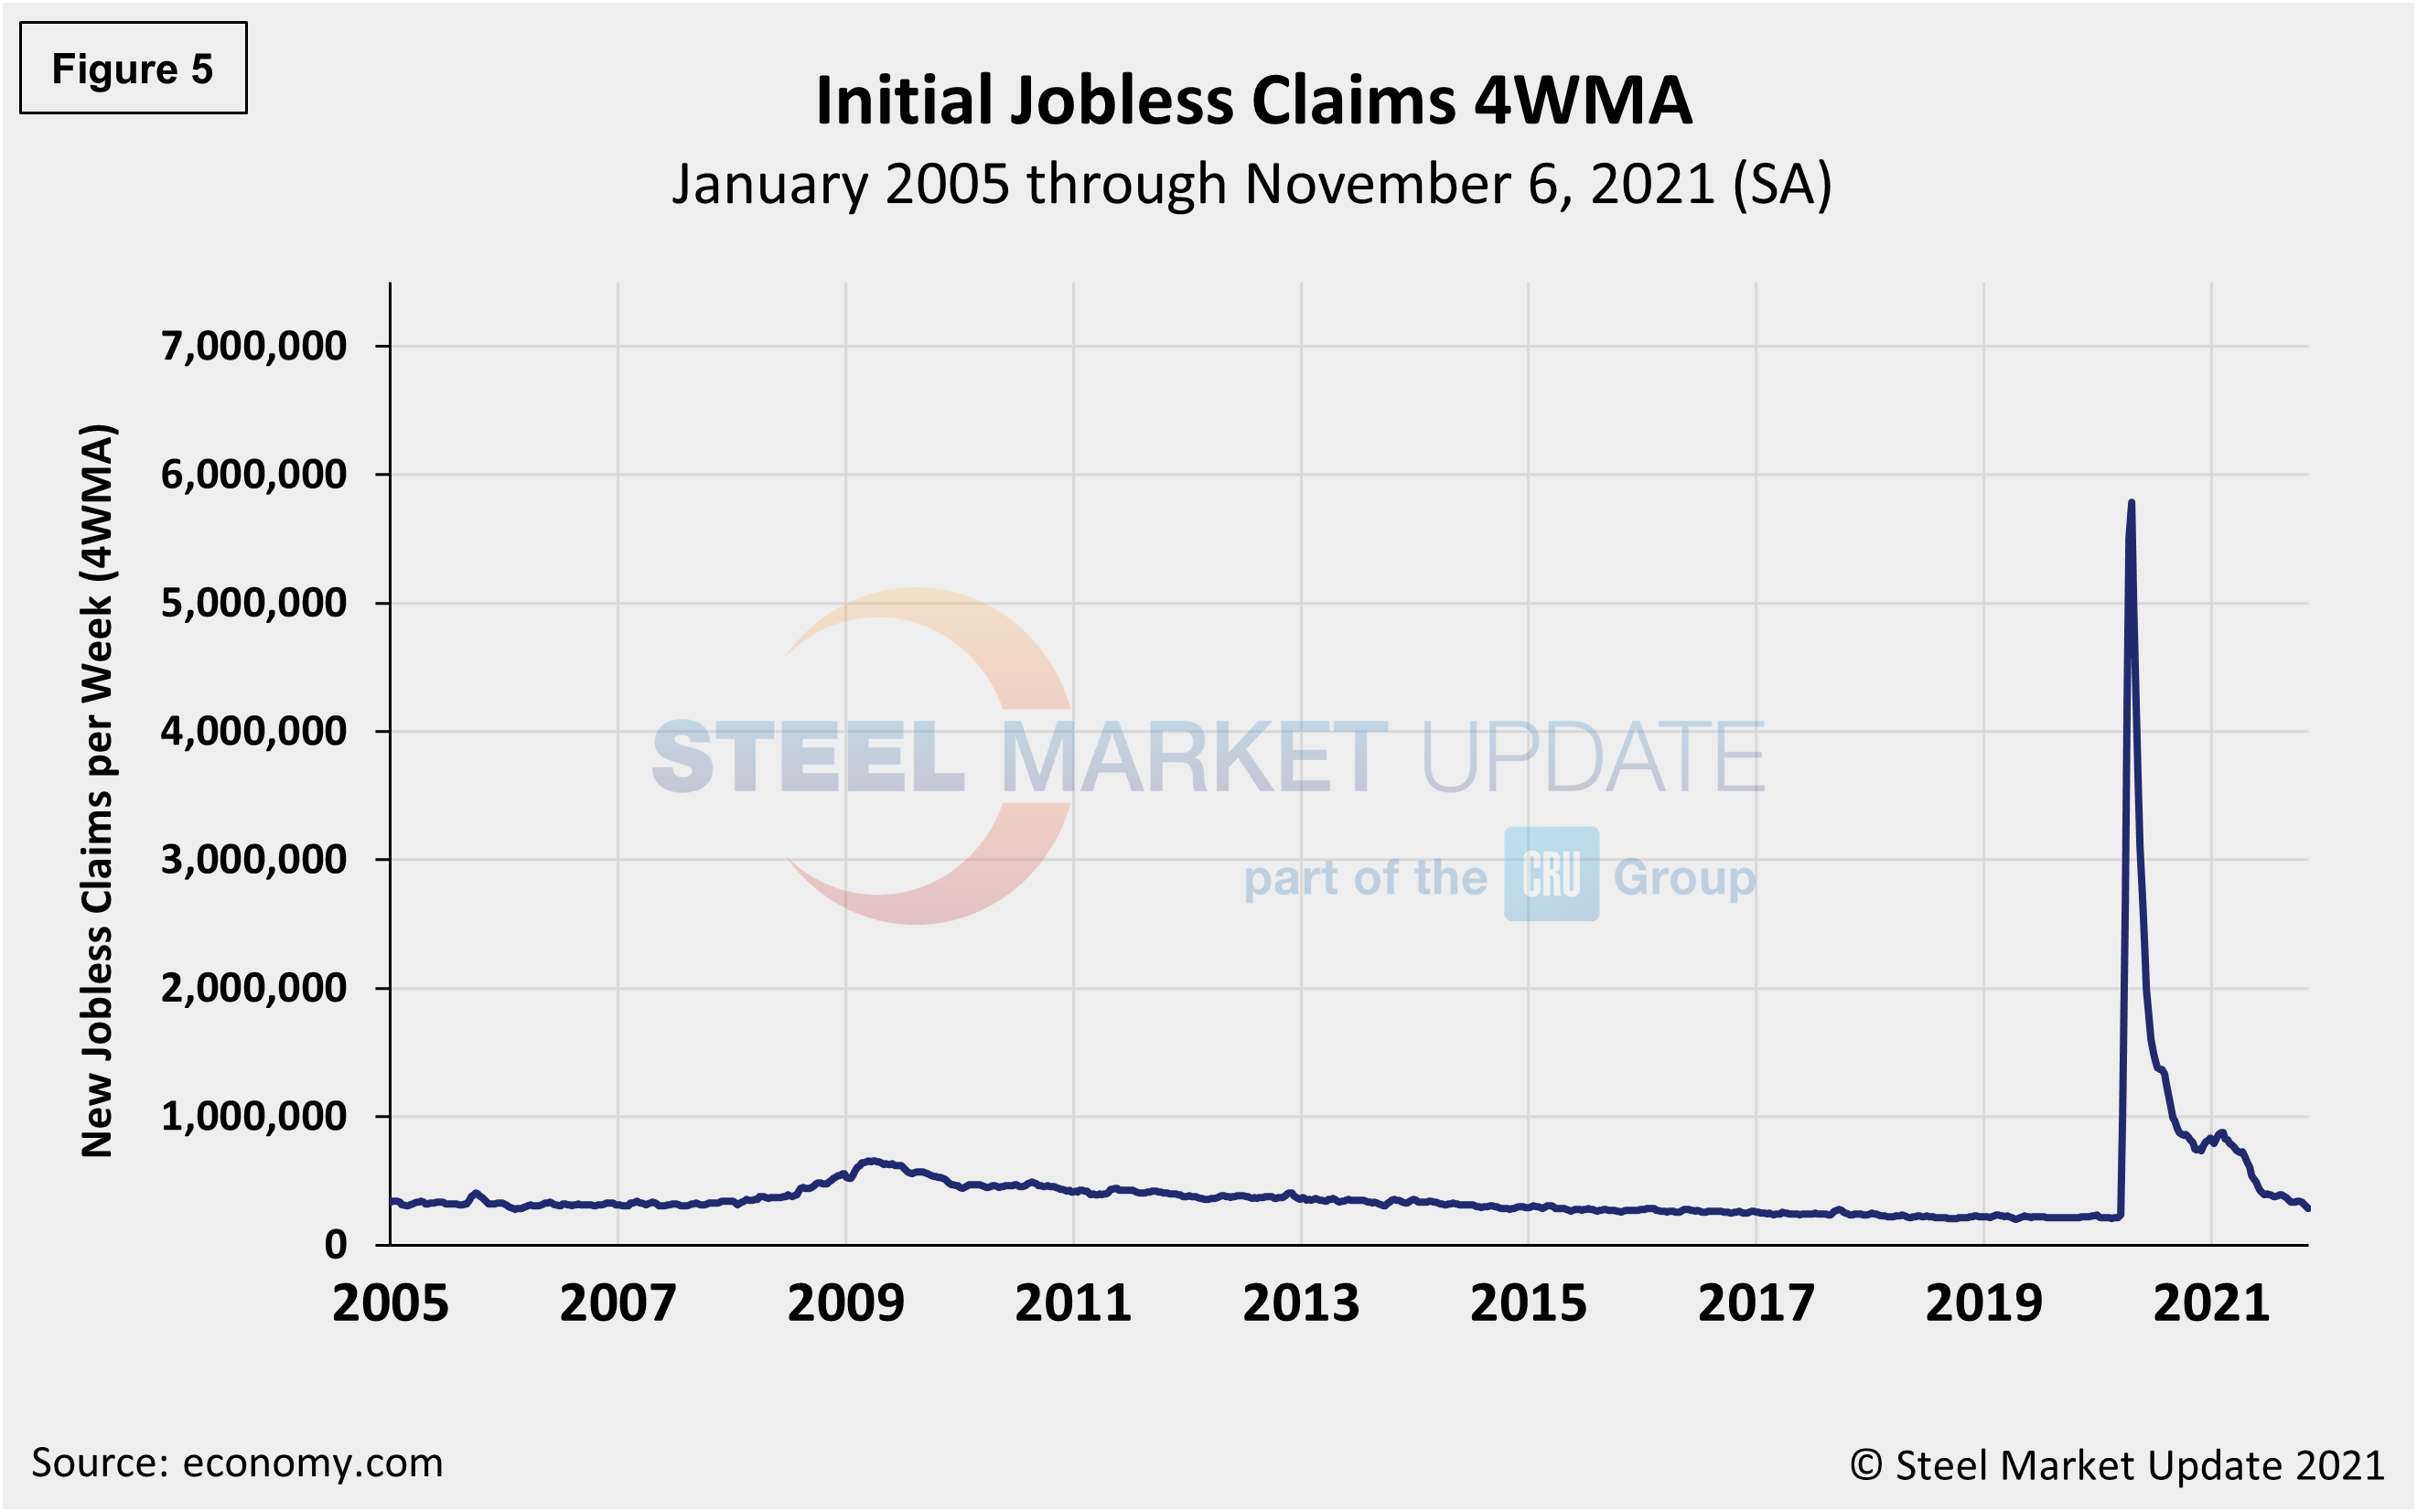
Initial claims for unemployment insurance, which are reported weekly by the Department of Labor, declined by 12,000 to 269,000 in the week ended Nov. 6. Unemployment claims have declined by 57,000 over the past four weeks, a 17% decrease month on month.
“U.S. initial claims for unemployment insurance benefits have declined noticeably over the past few weeks,” reported Economy.com. “New filings fell from a revised 283,000 to 269,000 in the week ended Oct. 30, the fewest since March 2020. The four-week moving average in initial claims dropped 15,000 to 284,750. The new data on initial claims is after the October payroll reference period and won’t have any implications for our view of growth in nonfarm payrolls. However, the improvement in new filings since the October payroll reference period suggests that job growth could be strong in November as well. Continuing claims for unemployment insurance benefits fell 134,000 to 2.105 million in the week ended Oct. 23 while the insured unemployment rate dipped from 1.7% to 1.6%.”
The recent change in initial claims continues to point to a recovering labor market. Figure 5 shows the four-week moving average of new claims since January 2005, seasonally adjusted.
Human resources consulting firm Challenger, Gray and Christmas Inc. produces a monthly employment update for the U.S. It reported that job cuts in October were 22,822, a 27.5% surge from the 17,895 cuts reported the prior month, and the highest monthly total since May when 24,586 cuts were reported. October’s total is 72.0% lower than the same year-ago period when 80,666 cuts were announced. Figure 6 shows the monthly job cuts reported by Challenger on a 3MMA basis since January 2007.
“We’re still in the midst of a labor market in which demand appears much higher than supply,” said Challenger. “We know companies are holding tight to their workers and are in fact looking for workers. However, we also know that for many employers, a federal vaccine mandate from OSHA is forthcoming, and for many government employees and contractors, as well as for health care providers, mandates already exist. This complicates hiring and retention efforts.”
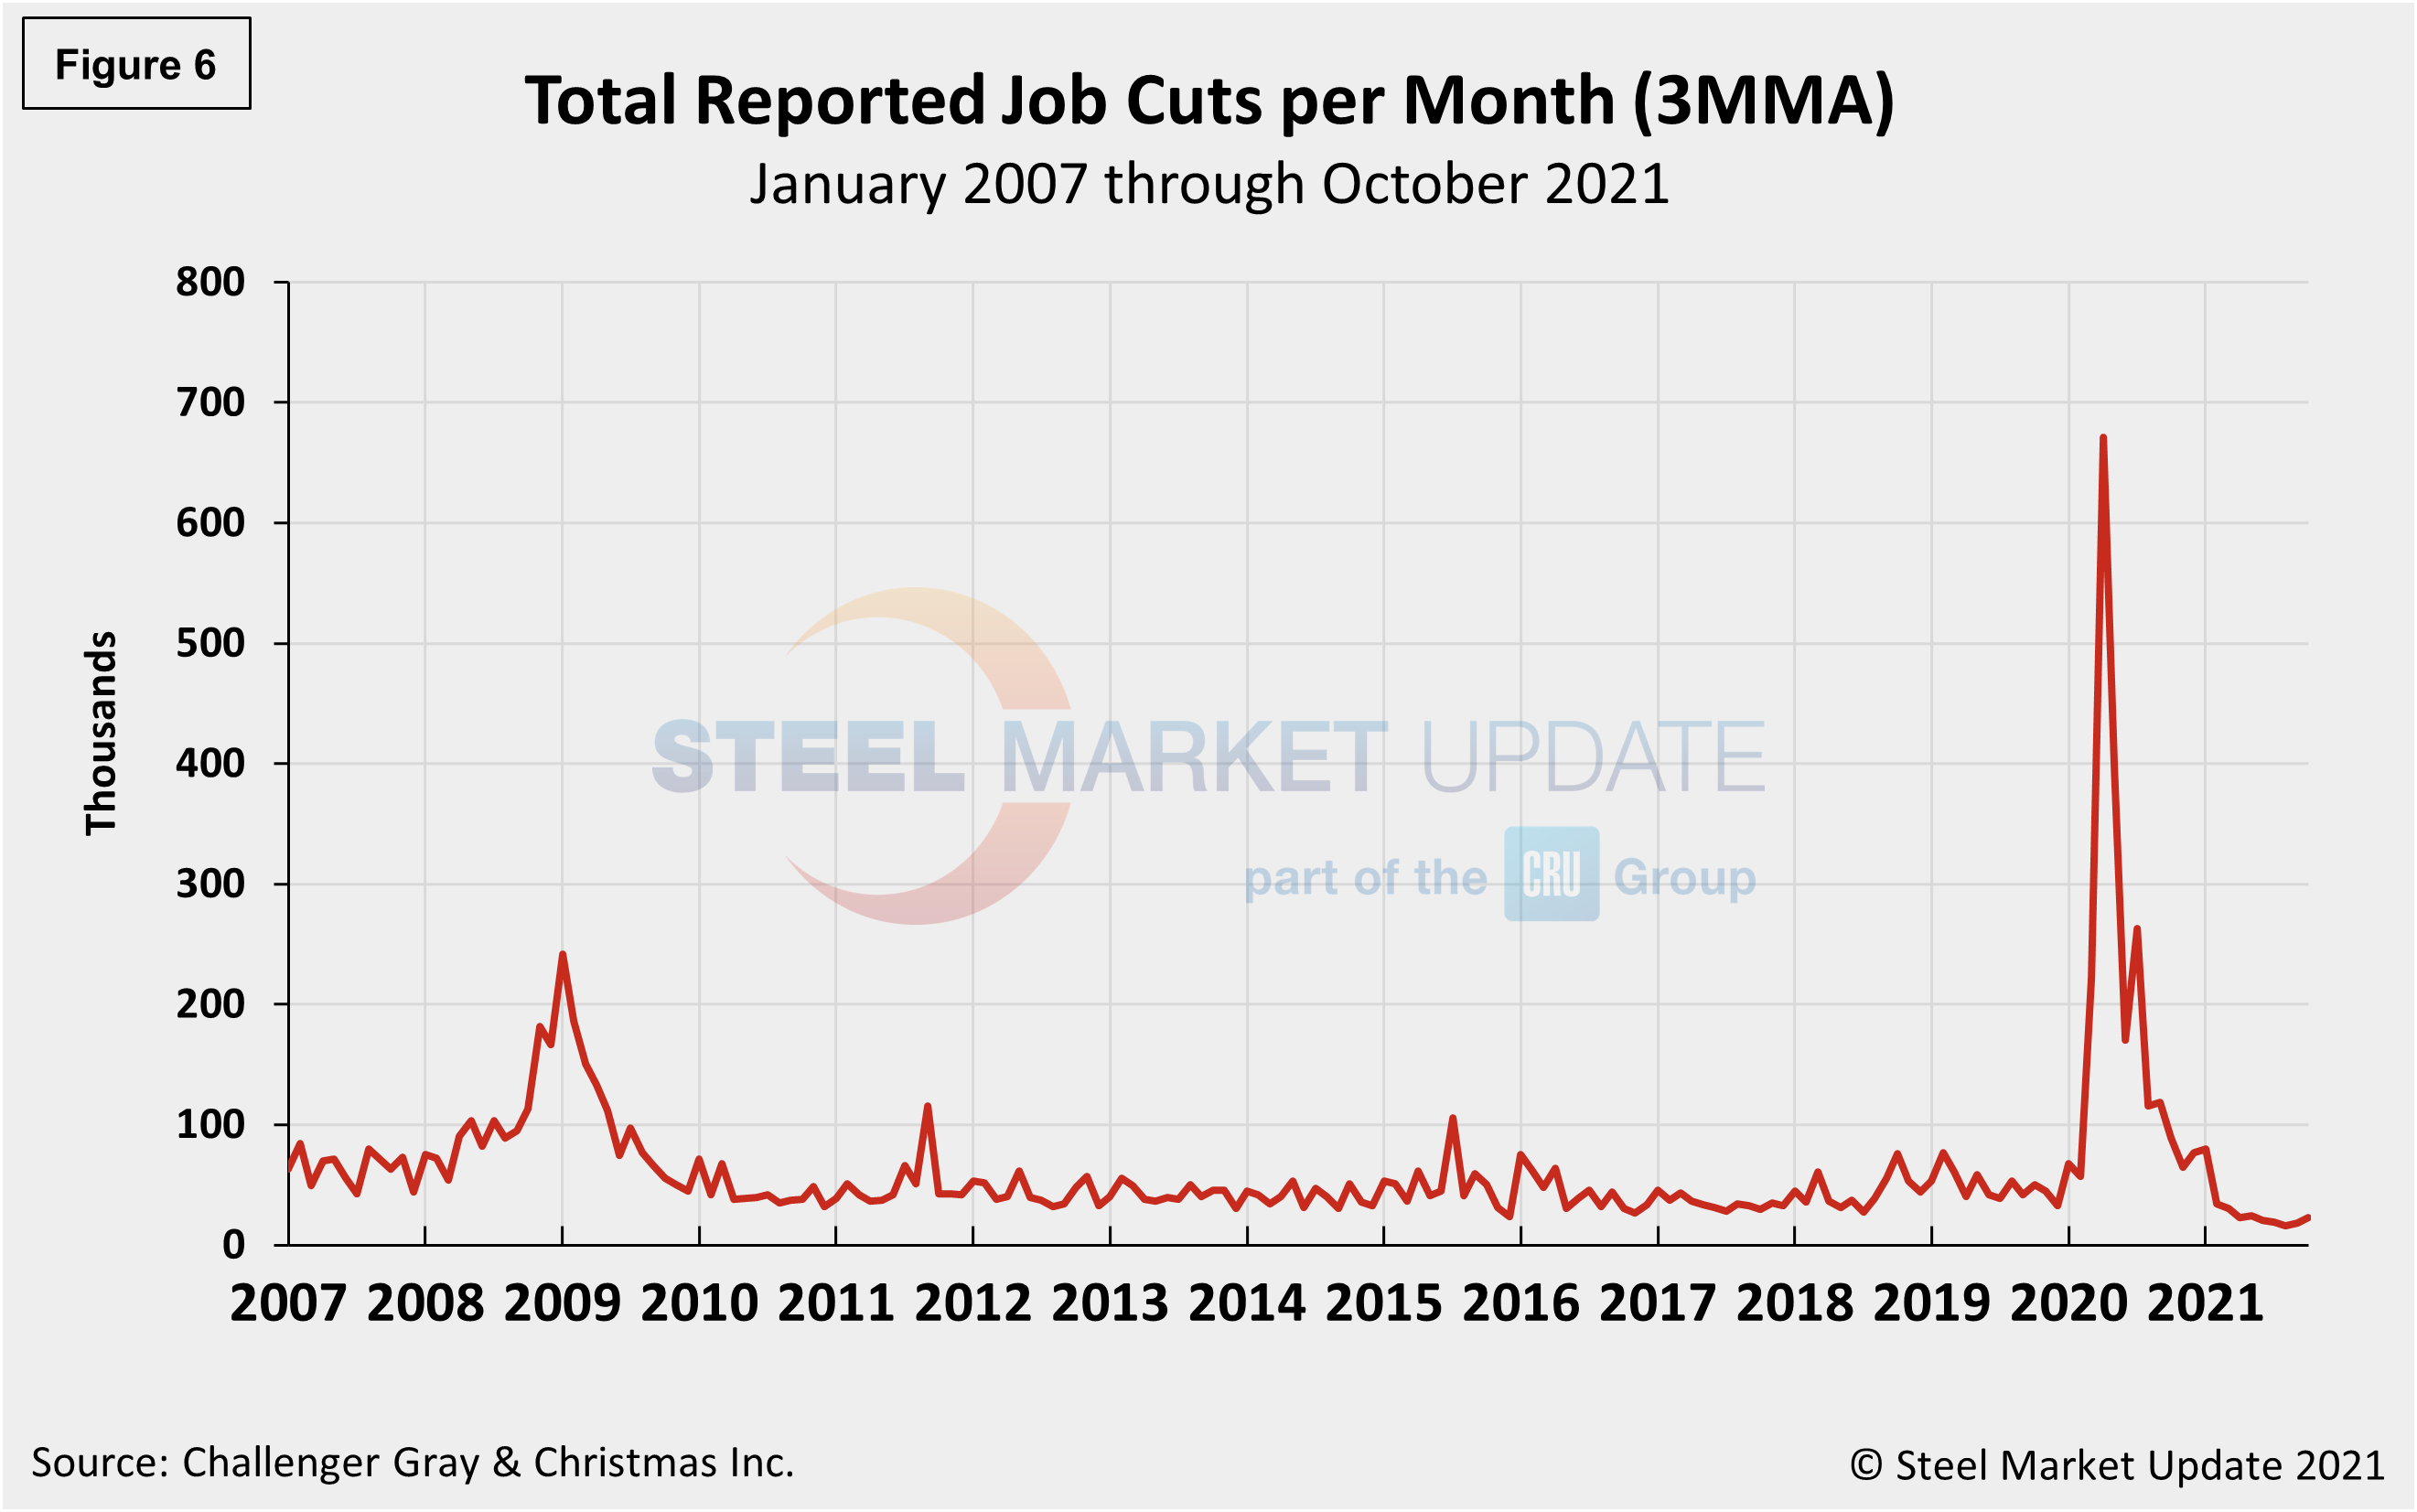
Year-to-date, employers have announced plans to cut 288,043 jobs from their payrolls, down 87.0% from the 2.2 million jobs eliminated through the same period last year. It is the lowest January-September total on record.
Explanation: On the first Friday of each month, the Bureau of Labor Statistics releases the employment data for the previous month. Data is available at www.bls.gov. The BLS reports on the results of two surveys. The Establishment survey reports the actual number employed by industry. The Household survey reports on the unemployment rate, participation rate, earnings, average workweek, the breakout into full-time and part-time workers and lots more details describing the age breakdown of the unemployed, reasons for and duration of unemployment.
By David Schollaert, David@SteelMarketUpdate.com


