Market Data

November 15, 2021
Service Center Shipments and Inventories Report for October
Written by Estelle Tran
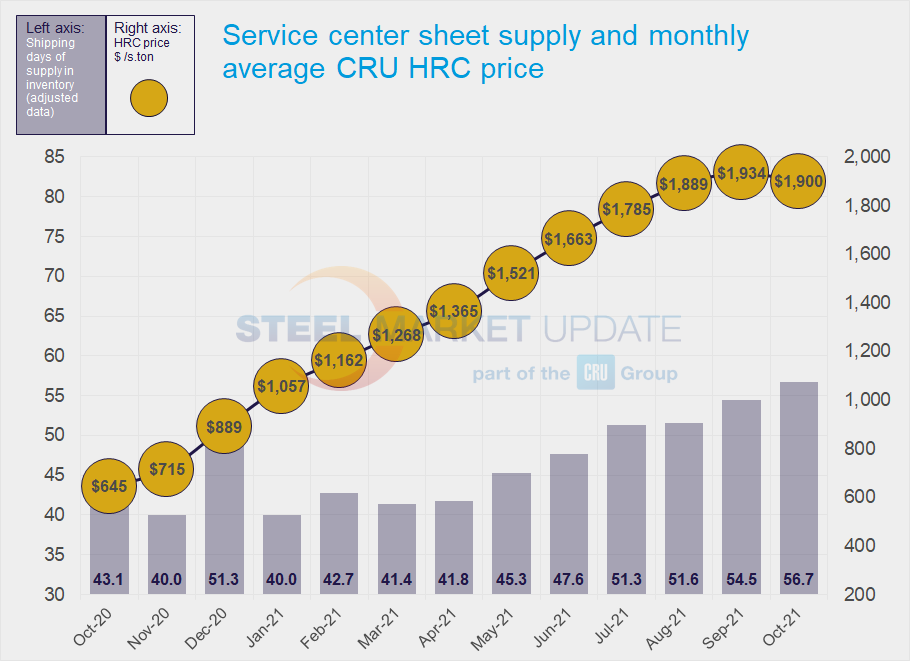
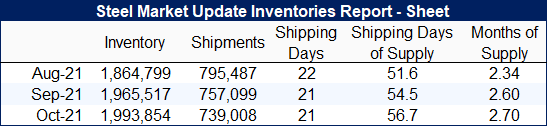
Flat Rolled = 56.7 Shipping Days of Supply
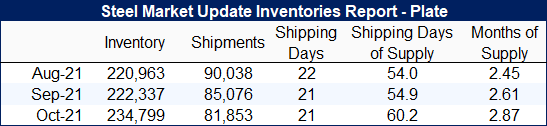
Plate = 62.0 Shipping Days of Supply
Flat Rolled
U.S. service center flat rolled inventories increased in October, as shipments slowed, according to Steel Market Update data. At the end of October, service centers carried 56.7 shipping days of supply on an adjusted basis, compared to 54.5 shipping days at the end of September. In terms of months on hand, October inventories represented 2.7 months, while September inventories represented 2.6 months.
October had 21 shipping days, the same as September, however, shipments decreased by 2.4% m/m. Service center contacts have said they’re seeing more competition in the resale market and there are prices for processed material that are lower than current spot coil offer prices from mills. Service centers are motivated to sell material before year’s end and because prices are softening.
Lower-than-expected shipments to the auto sector have contributed to the overall demand slowdown, however, customer inventories have also caught up with demand. We have started to hear of some order cancellations at service centers, though it is not widespread. Market contacts said that customers are still pulling material, though they’re being careful not to take on too much inventory.
Going forward, we expect inventory levels to continue to rise as mills catch up on past due orders and demand slows. Considering lower seasonal demand ahead in Q4, inventories appear to be on the heavier side relative to shipments.
The amount of sheet on order is falling, which is coinciding with shortening domestic mill lead times and import arrivals. Though material on order keeps sliding, it remains higher than usual. The higher on-order volumes heading into November and December suggest that inventories will be elevated for a while.
As prices have started to slip, the amount of sheet inventory committed to contract has fallen to 59.4% in October from 62.2% in September.
Plate
U.S. service center plate inventories increased in October, as plate shipments also slowed. At the end of October, service centers carried 60.2 shipping days of supply, up from 54.9 shipping days of supply in September. Service centers carried 2.87 months of supply on hand in October, up from 2.61 in September.
Intake increased in October, as plate shipments decreased. Month-on-month plate shipments decreased 3.8%, and service centers also said they were seeing more competition for orders from service centers wanting to offload inventory before the end of the year. One service center contact said he saw larger projects getting delayed. The House of Representatives’ passage of the $1 trillion infrastructure bill has been encouraging, but market participants agree that it will not impact the market until late in 2022.
For now, service centers remain reluctant to book more material than they can sell quickly because of wariness about current high prices. The U.S.-EU trade agreement imposing a tariff-rate quota on steel imported from the EU will alleviate some of the tightness for certain sizes and grades.
In late October, plate mills announced price increases of $50 /s.ton, which market sources said were sticking at least partially. On-order volumes continued to drop in October.
Plate lead times have shortened in recent weeks to about 7 weeks, according to SMU data. The amount of plate on order, though decreasing, is still historically high. In October 2019, service centers had 26.1 shipping days of supply on order.