

Market Data

December 6, 2021
U.S. Job Creation: Poor Showing by Labor Market in November
Written by David Schollaert
U.S. job growth was weaker than expected in November, well below estimates for the third time in the past four months. November payrolls rose by 210,000, well below the 573,000 anticipated by Wall Street and a disappointing showing following the 531,000 new jobs added the month prior.
Despite the big hiring miss, the unemployment rate fell to 4.2%, a 0.4 percentage point decline in spite of rising labor force participation, the Labor Department reported.
Leisure and hospitality, which includes bars, restaurants, hotels and similar businesses, saw a gain of just 23,000 after being a leading job creator for much of the recovery. Though the sector has regained nearly 7 million of the jobs lost at the depths of the pandemic, it remains about 1.3 million below its February 2020 level, with an unemployment rate stuck at 7.5%.
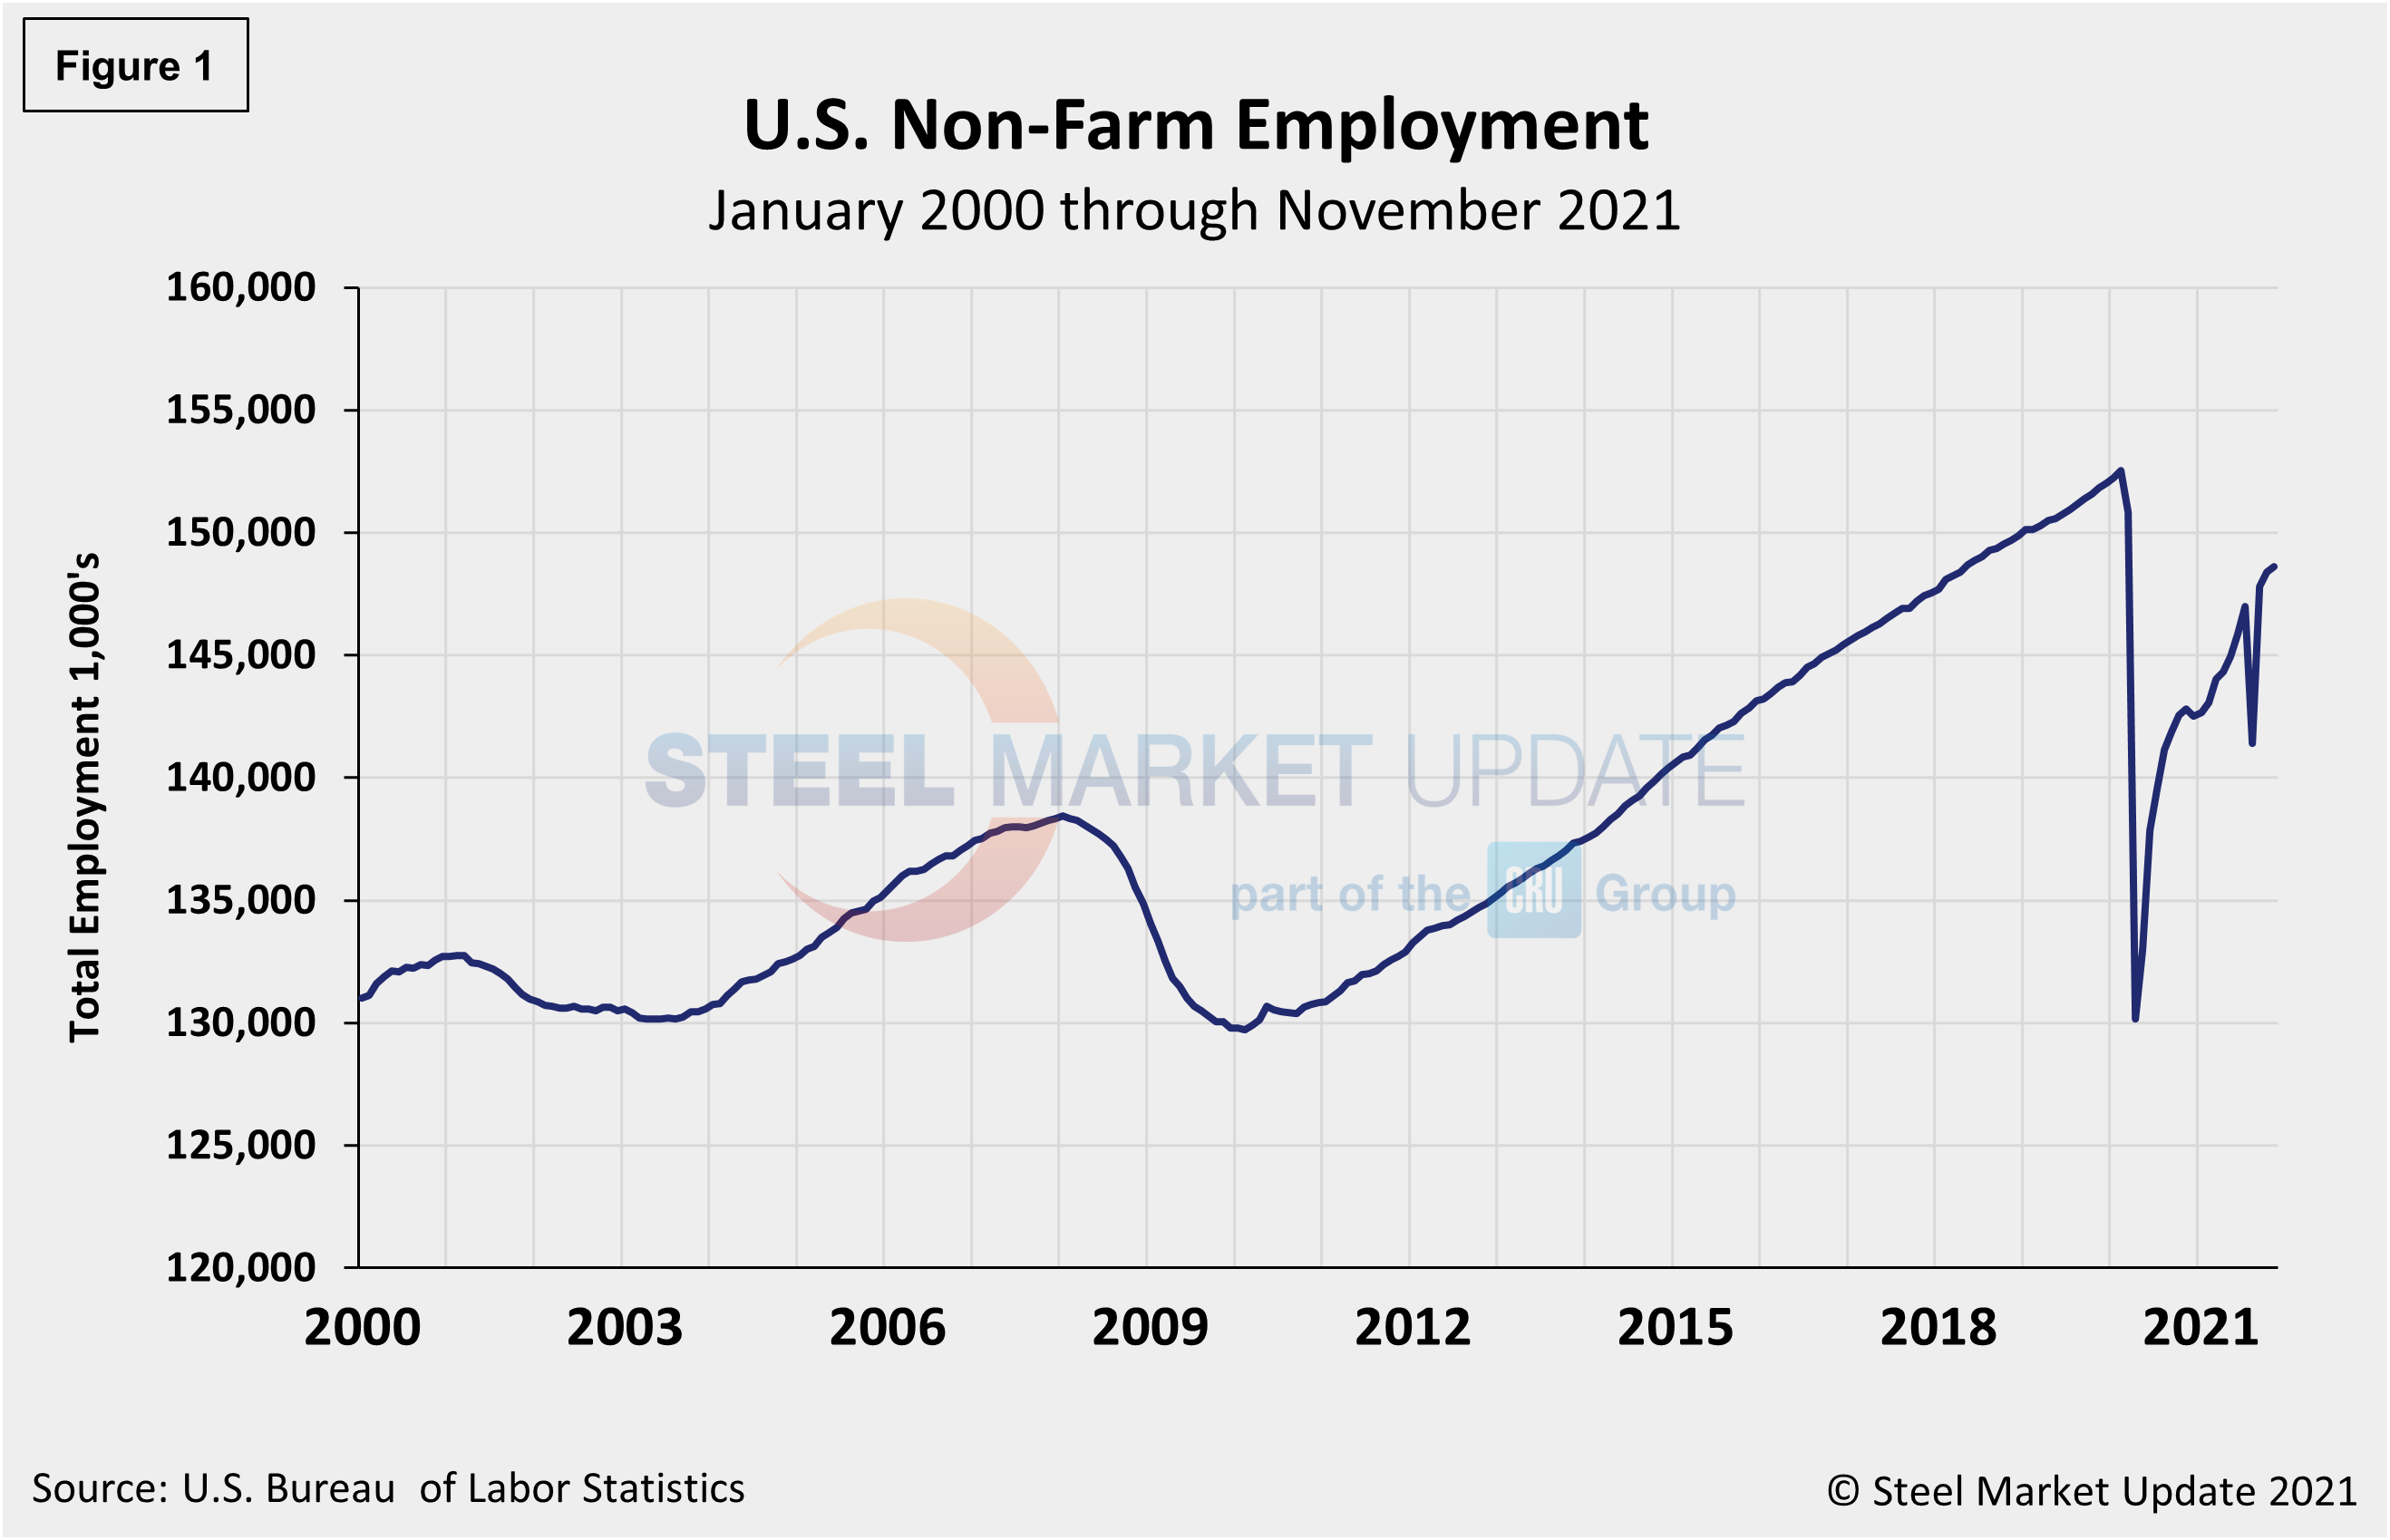
Professional and business services added another 90,000 to payrolls, while transportation and warehousing gained 50,000 and construction 31,000 more jobs in November. The October and September estimates were moved up a combined 82,000 in Friday’s report versus the initial Bureau of Labor Statistics (BLS) estimate the month prior. Figure 1 shows the total number of nonfarm workers employed in the U.S. since 2000.
The latest set of discouraging numbers is more in line with the late-summer lull caused by the Delta surge. Supply-chain challenges and delayed shipments were not the only concerns seen last month. Despite the holiday season shopping rush, retail employment declined by about 20,000 in November, the report showed. Losses were concentrated in clothing, sporting goods and hobby stores, but partially offset by gains in grocery and building supply stores.
Worker wages climbed for the month, rising 0.26% in November and 4.8% from a year ago. Both numbers were slightly below estimates, while the average work week was up by one-tenth of an hour to 34.8 hours.
The number of long-term unemployed (out-of-work for at least 27 consecutive weeks) was little changed in November, currently at 2.2 million, but remains 1.1 million higher than in February 2020. The labor force participation rate was up 0.2 percentage points to 61.8% in November, still well behind the 63.3% in February 2020, the month before the pandemic hit.
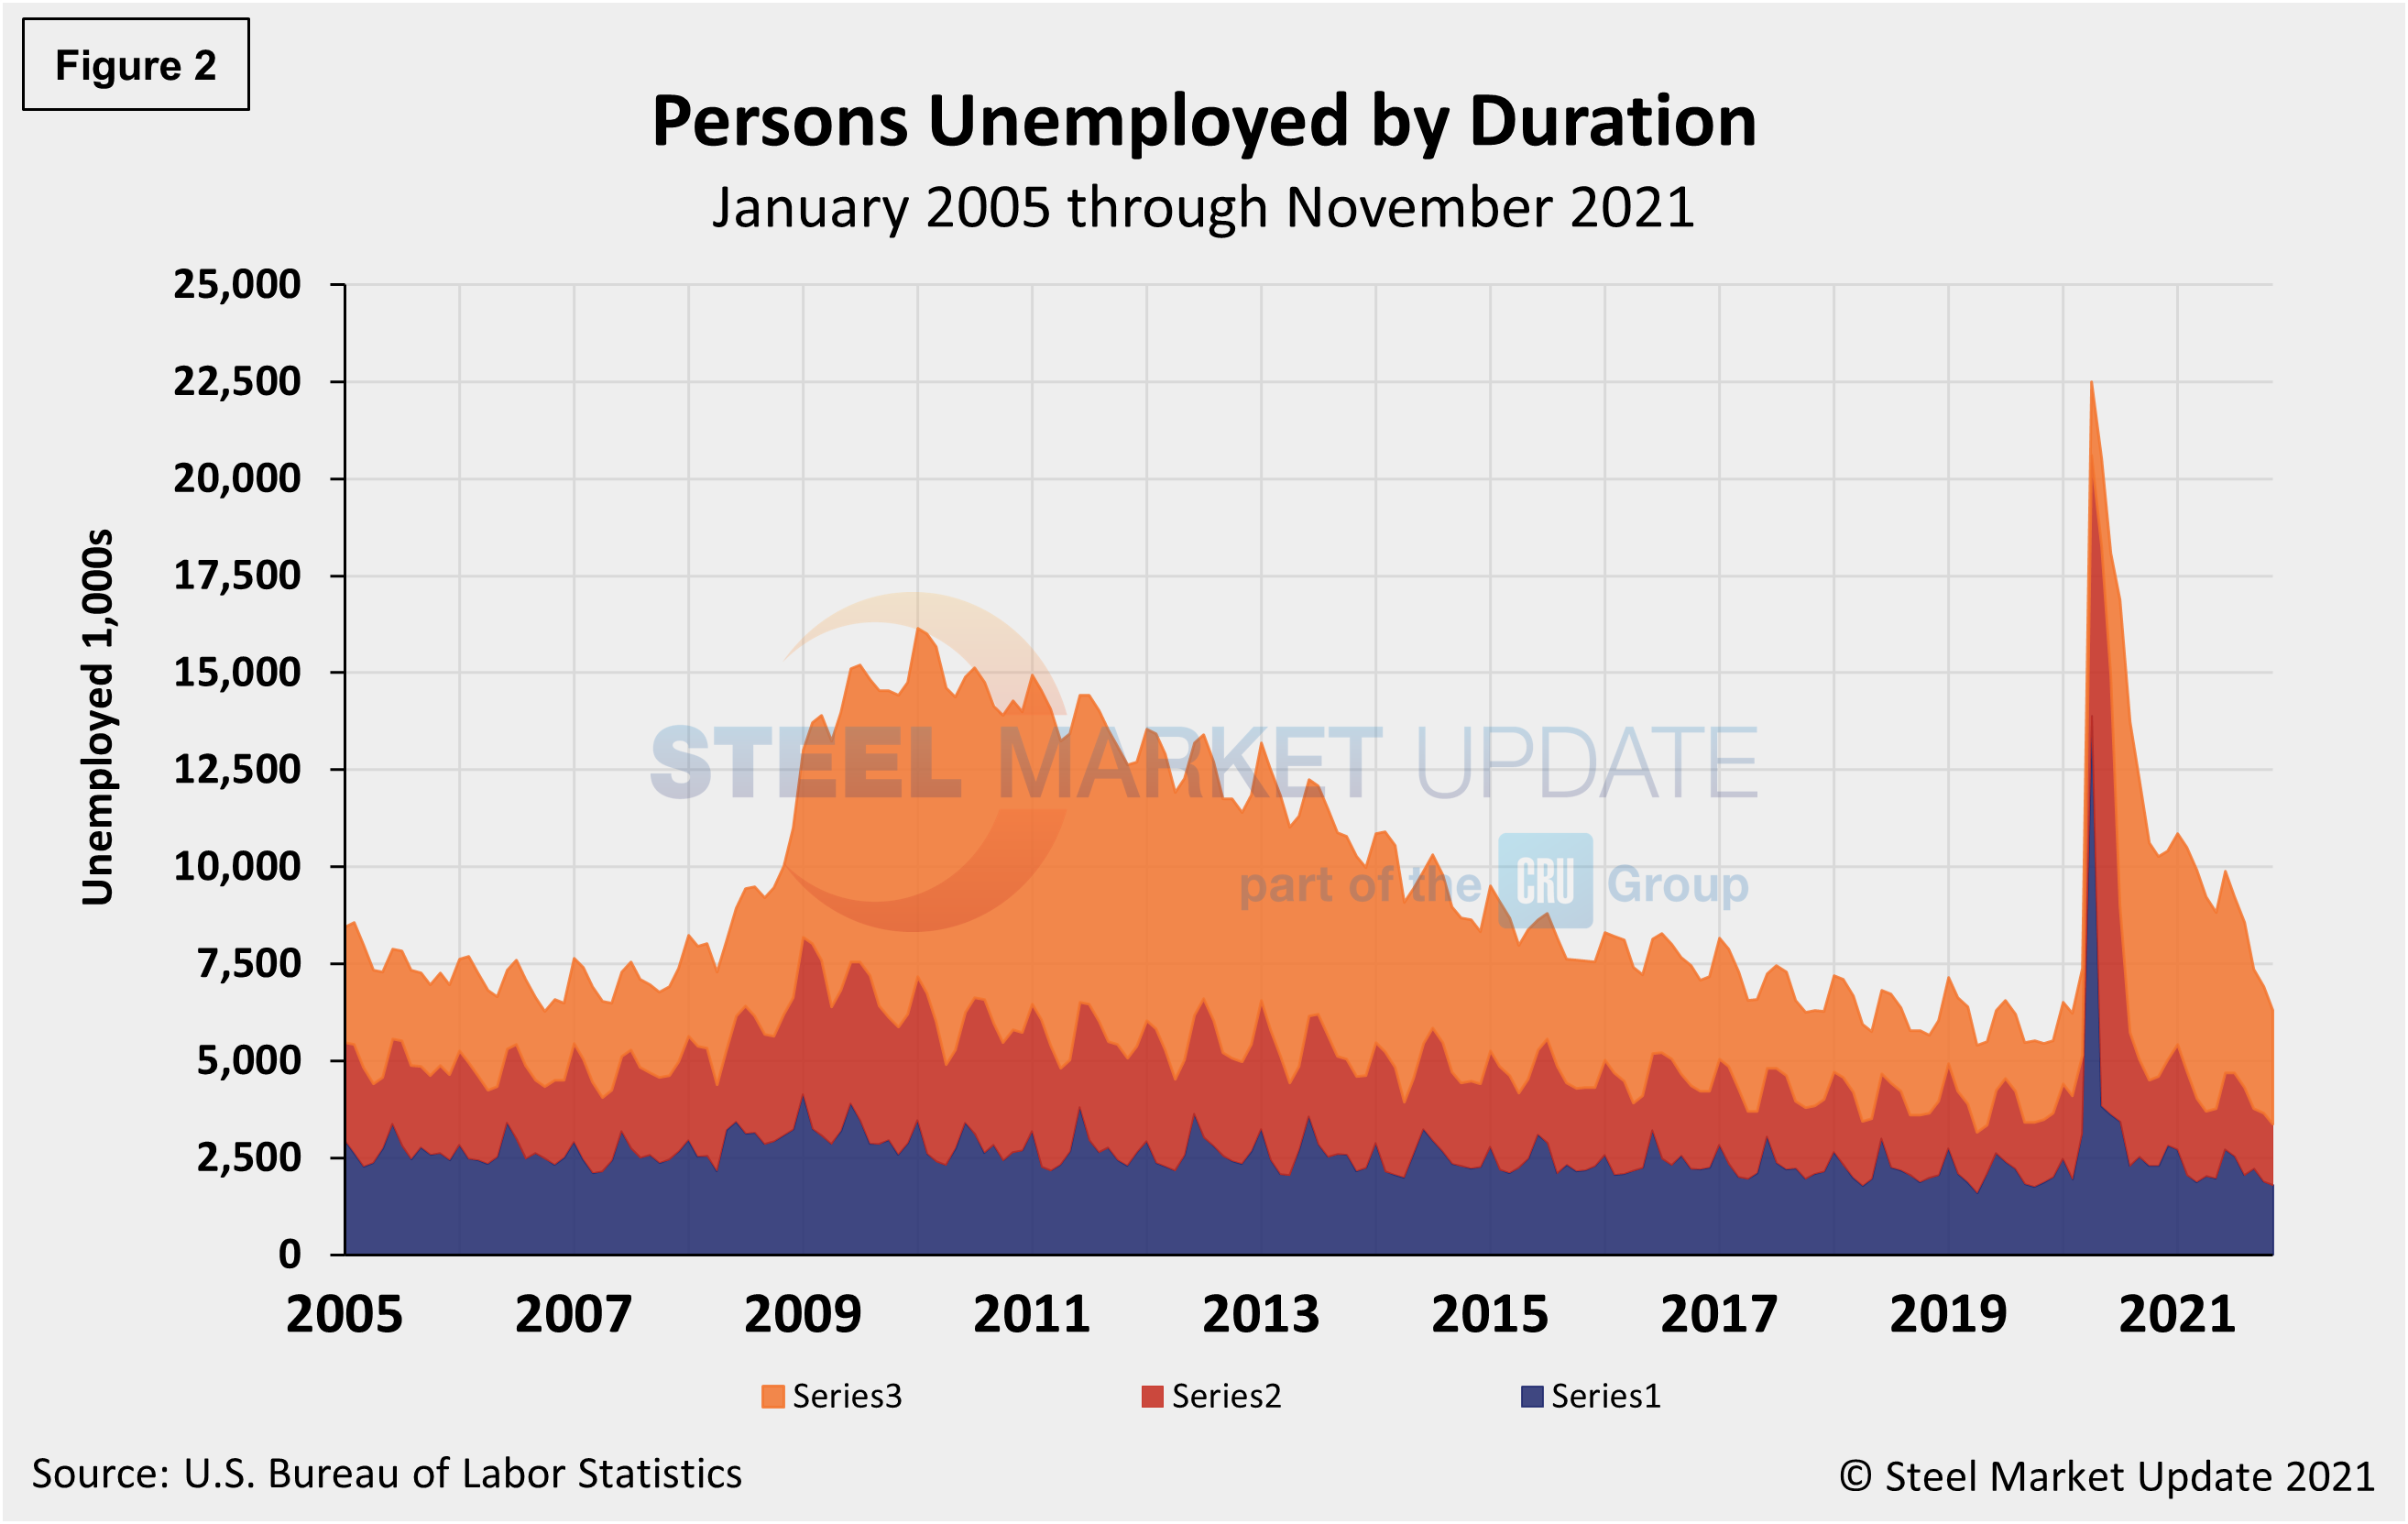
The historical picture for the duration of unemployment since January 2000 is broken down into <5 weeks, 5 to 14 weeks, and >15 weeks in Figure 2. The total number unemployed was 6.302 million at the end of November, a decrease of 594,000 compared to October. Although unemployment remains above pre-pandemic levels by roughly 84,000 people, about 16.2 million more people now have jobs compared to the 22.5 million thrown out of work during the worst of the pandemic in April of 2020. As of Dec. 6, 46.6% had been unemployed for more than 15 weeks, 25.0% for 5 to 14 weeks, and 28.4% for less than 5 weeks.
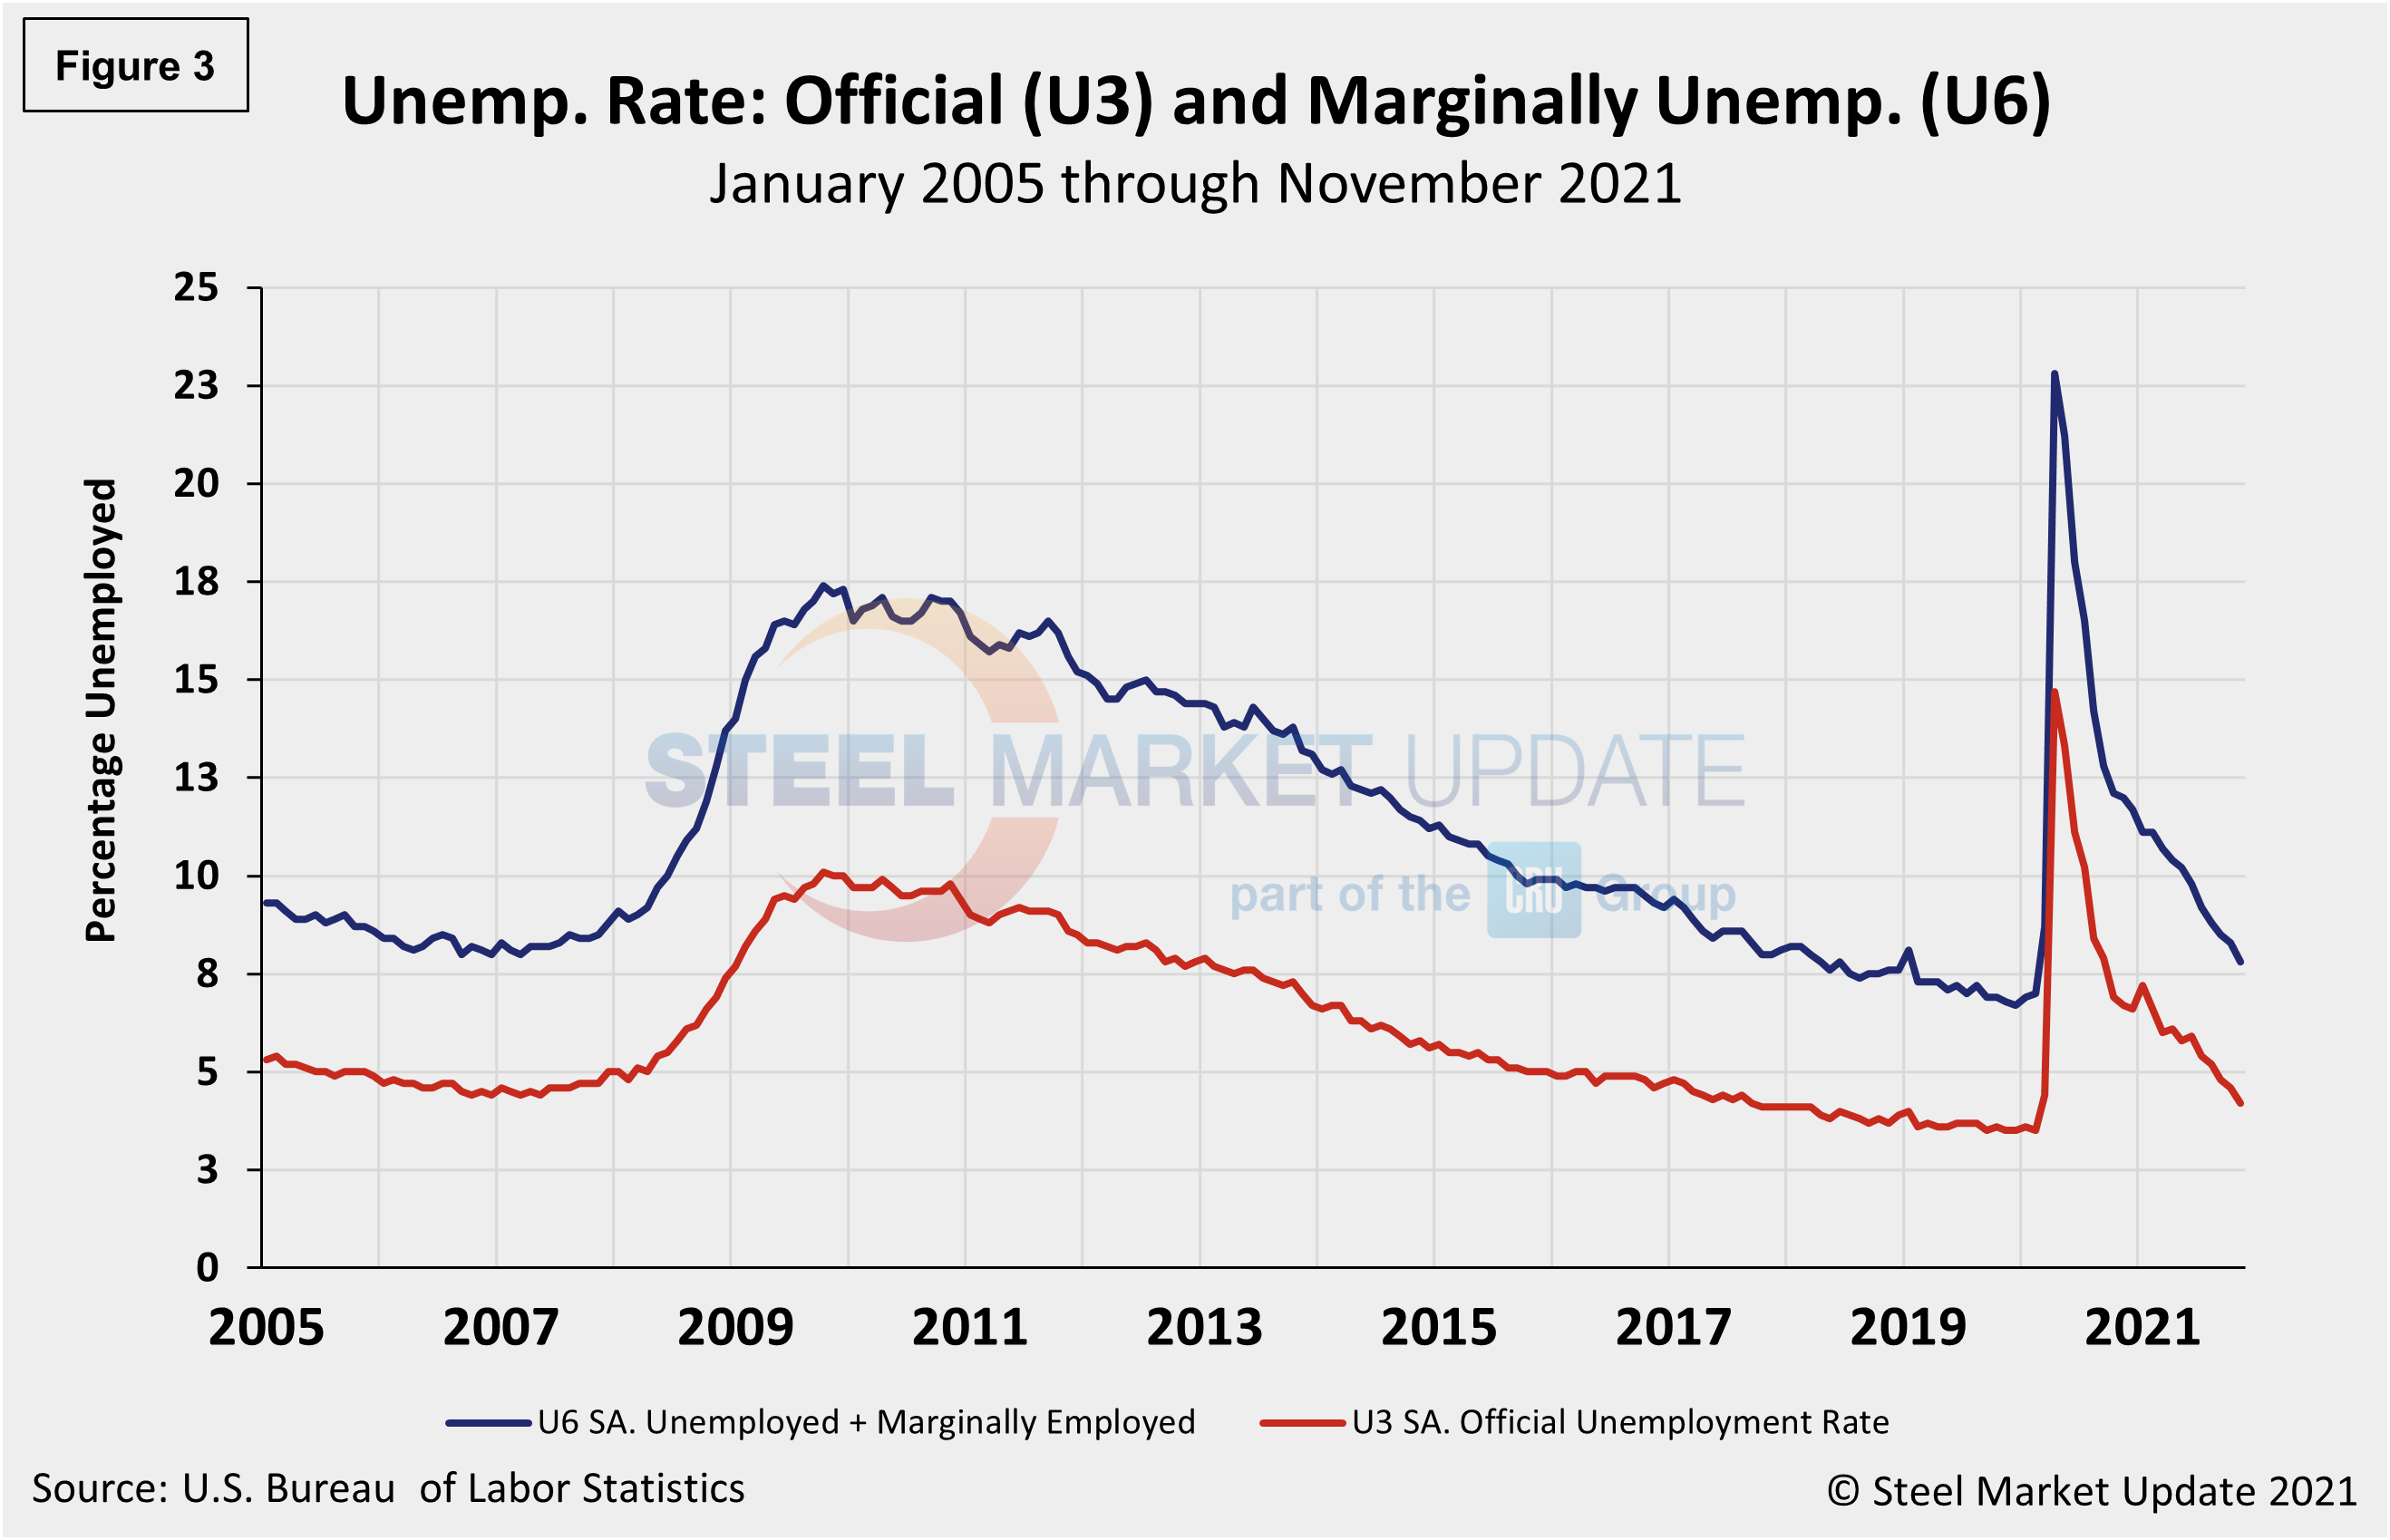
The official unemployment rate, U3, reported in the BLS Household survey (see explanation below) increased from 3.5% in February 2020 to 14.7% in April 2020. Since then, it has trended down at a slow pace. November’s fall to 4.2% was the lowest mark in 20 months. U6, a more encompassing measure of unemployment that includes discouraged workers and those holding part-time jobs for economic reasons, dropped even more, tumbling to 7.8% from 8.3% (Figure 3).
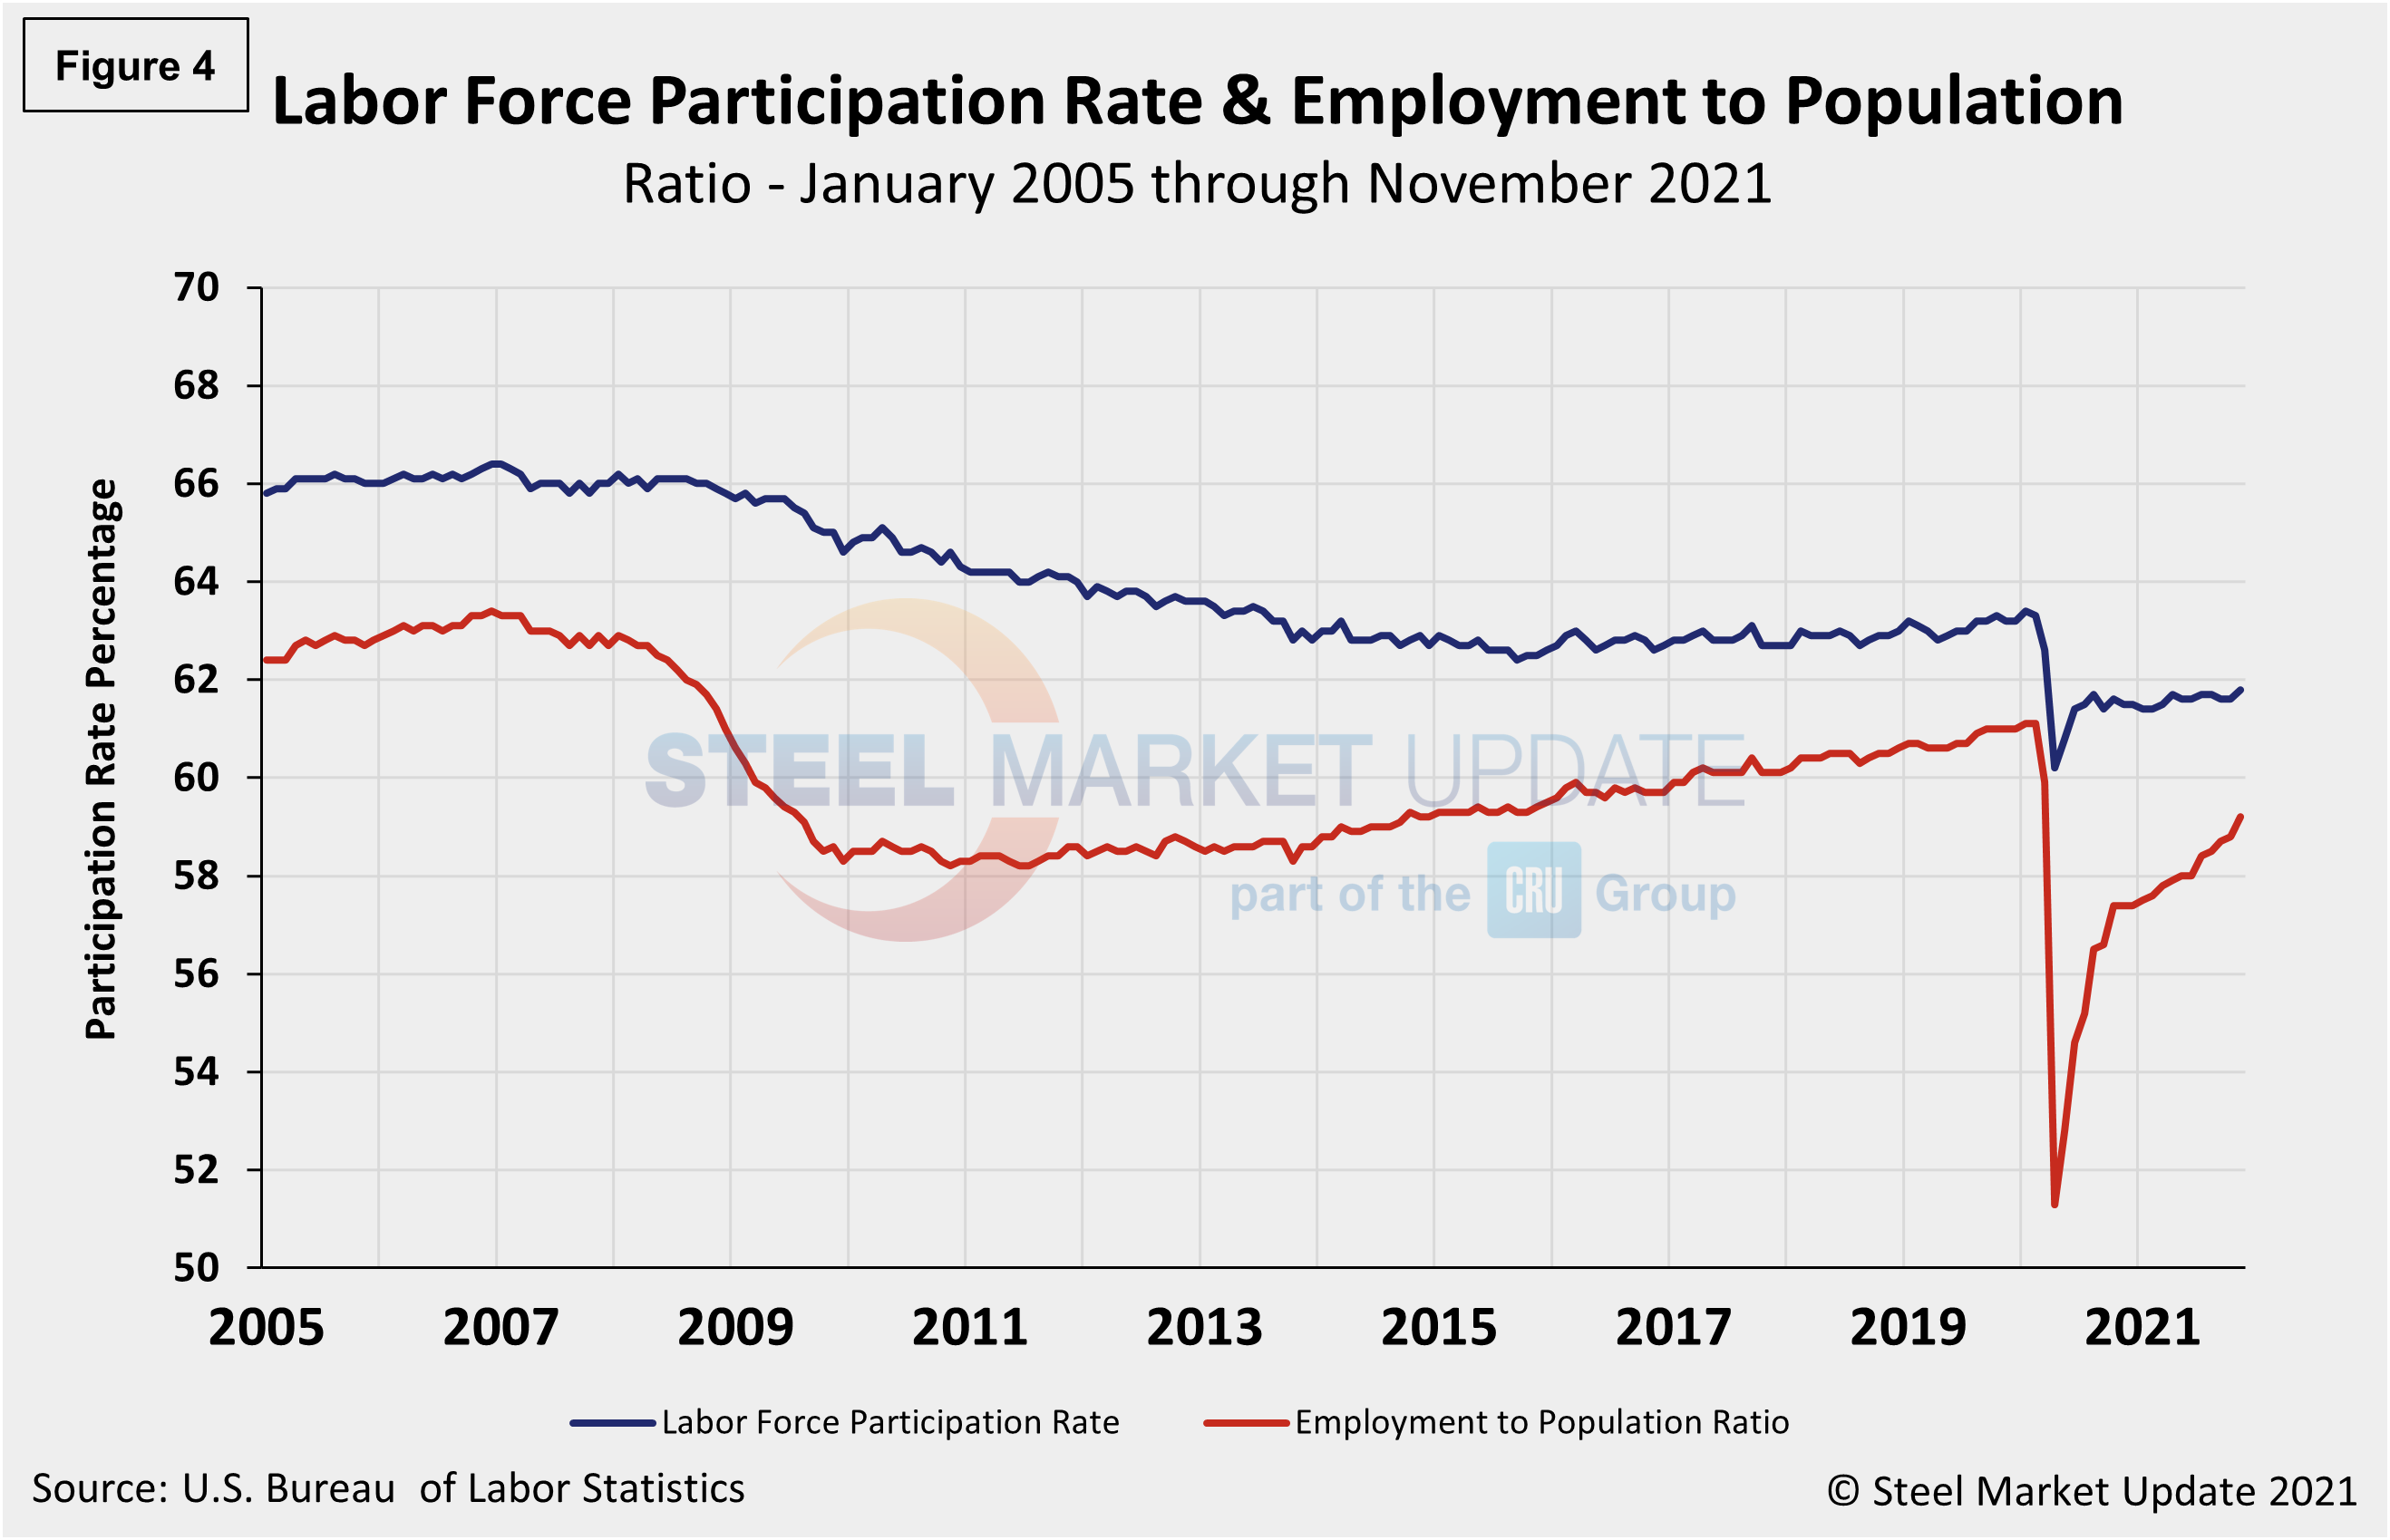
Another gauge, and more definitive view, are the number employed as a percentage of the population. Last month, the employment-to-population ratio was 59.2%, a marginal increase from October when the ratio was 58.8%, highlighting the challenges many companies continue to report in filling openings. Figure 4 shows both measures on one graph.
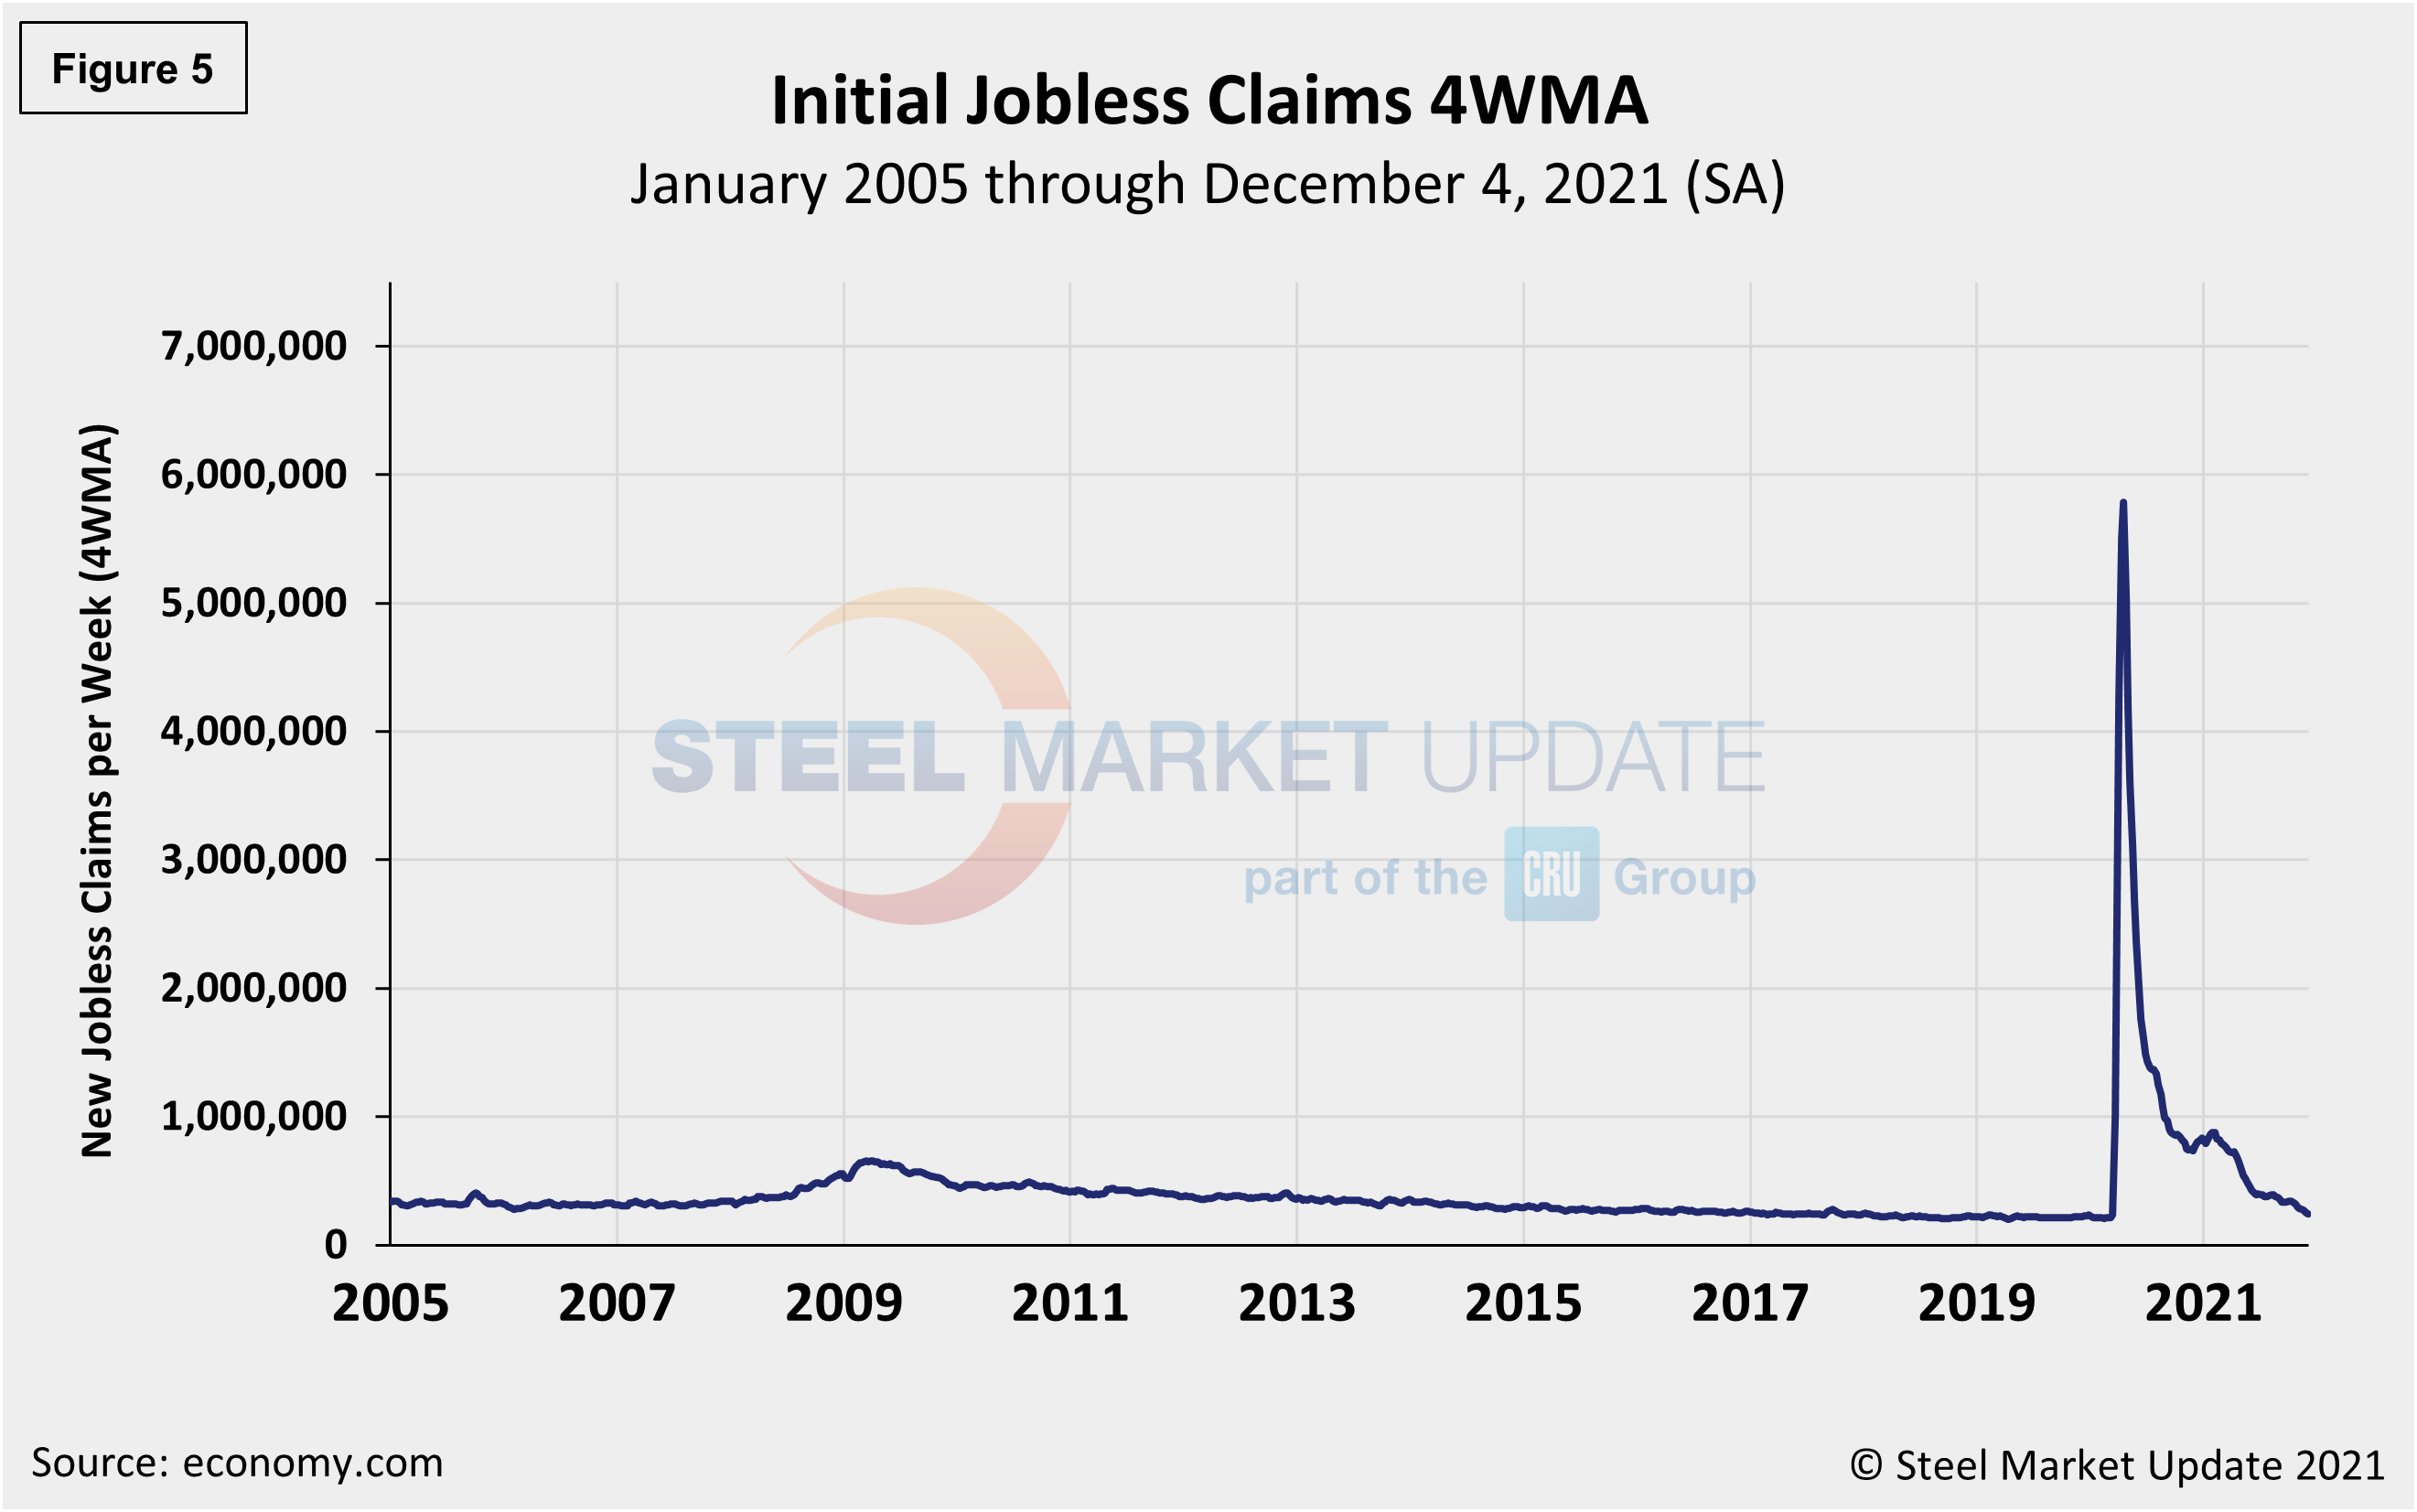
Initial claims for unemployment insurance, which are reported weekly by the Department of Labor, declined by 11,750 to 222,000 in the week ended Dec. 4. Unemployment claims have declined by 57,000 over the past four weeks, a 17% decrease month on month.
“U.S. initial claims for unemployment insurance benefits are volatile this time of year, so one needs to take them with a grain of salt,” reported Economy.com. “New filings rose 28,000 to 222,000 in the week ended Nov. 27, reversing only some of the 76,000 decline in the prior week. The four-week moving average in initial claims for unemployment insurance benefits fell from 251,000 to 238,750. Continuing claims continue to drop sharply, falling 107,000 in the week ended Nov. 20. This brings the cumulative decline in continuing claims since early November to 253,000. The insured unemployment rate slipped from 1.5% to 1.4%. The insured unemployment rate was 3.8% this time last year.”
The recent change in initial claims continues to point to a recovering labor market. Figure 5 shows the four-week moving average of new claims since January 2005, seasonally adjusted.
Human resources consulting firm Challenger, Gray and Christmas Inc. produces a monthly employment update for the U.S. It reported that job cuts in November were 14,875, a 34.8% fall from the 22,822 cuts reported the prior month, and the lowest monthly total since May 1993 when 14,086 cuts were reported. November’s total is 77.0% lower than the same year-ago period when 64,797 cuts were announced. Figure 6 shows the monthly job cuts reported by Challenger on a 3MMA basis since January 2007.
“With the Omicron variant emerging and the unknowns that come with its spread, coupled with the ongoing difficulty hiring and retaining workers, it’s no surprise job cuts are at record lows,” said Challenger. “Employers are spread thin, planning best- and worst-case scenarios in terms of COVID, while also contending with staff shortages and high demand.”
Vaccine refusal has accounted for 7,227 job cuts so far this year, 384 of which occurred last month, according to the report. Of those, 6,322 occurred in the health care/products sector. Another 595 occurred in transportation companies, while 305 occurred in government entities. Five cuts were reported at organizations in the education sector.
“Companies are in limbo over the legal challenges to the OSHA rule that will require companies with at least 100 employees to ensure workers are either vaccinated or tested regularly,” added Challenger. “Government contractors and health workers will not have an option to test. Currently, approximately 59.4% of the population is fully vaccinated and 20.9% have received booster shots, according to the CDC.”
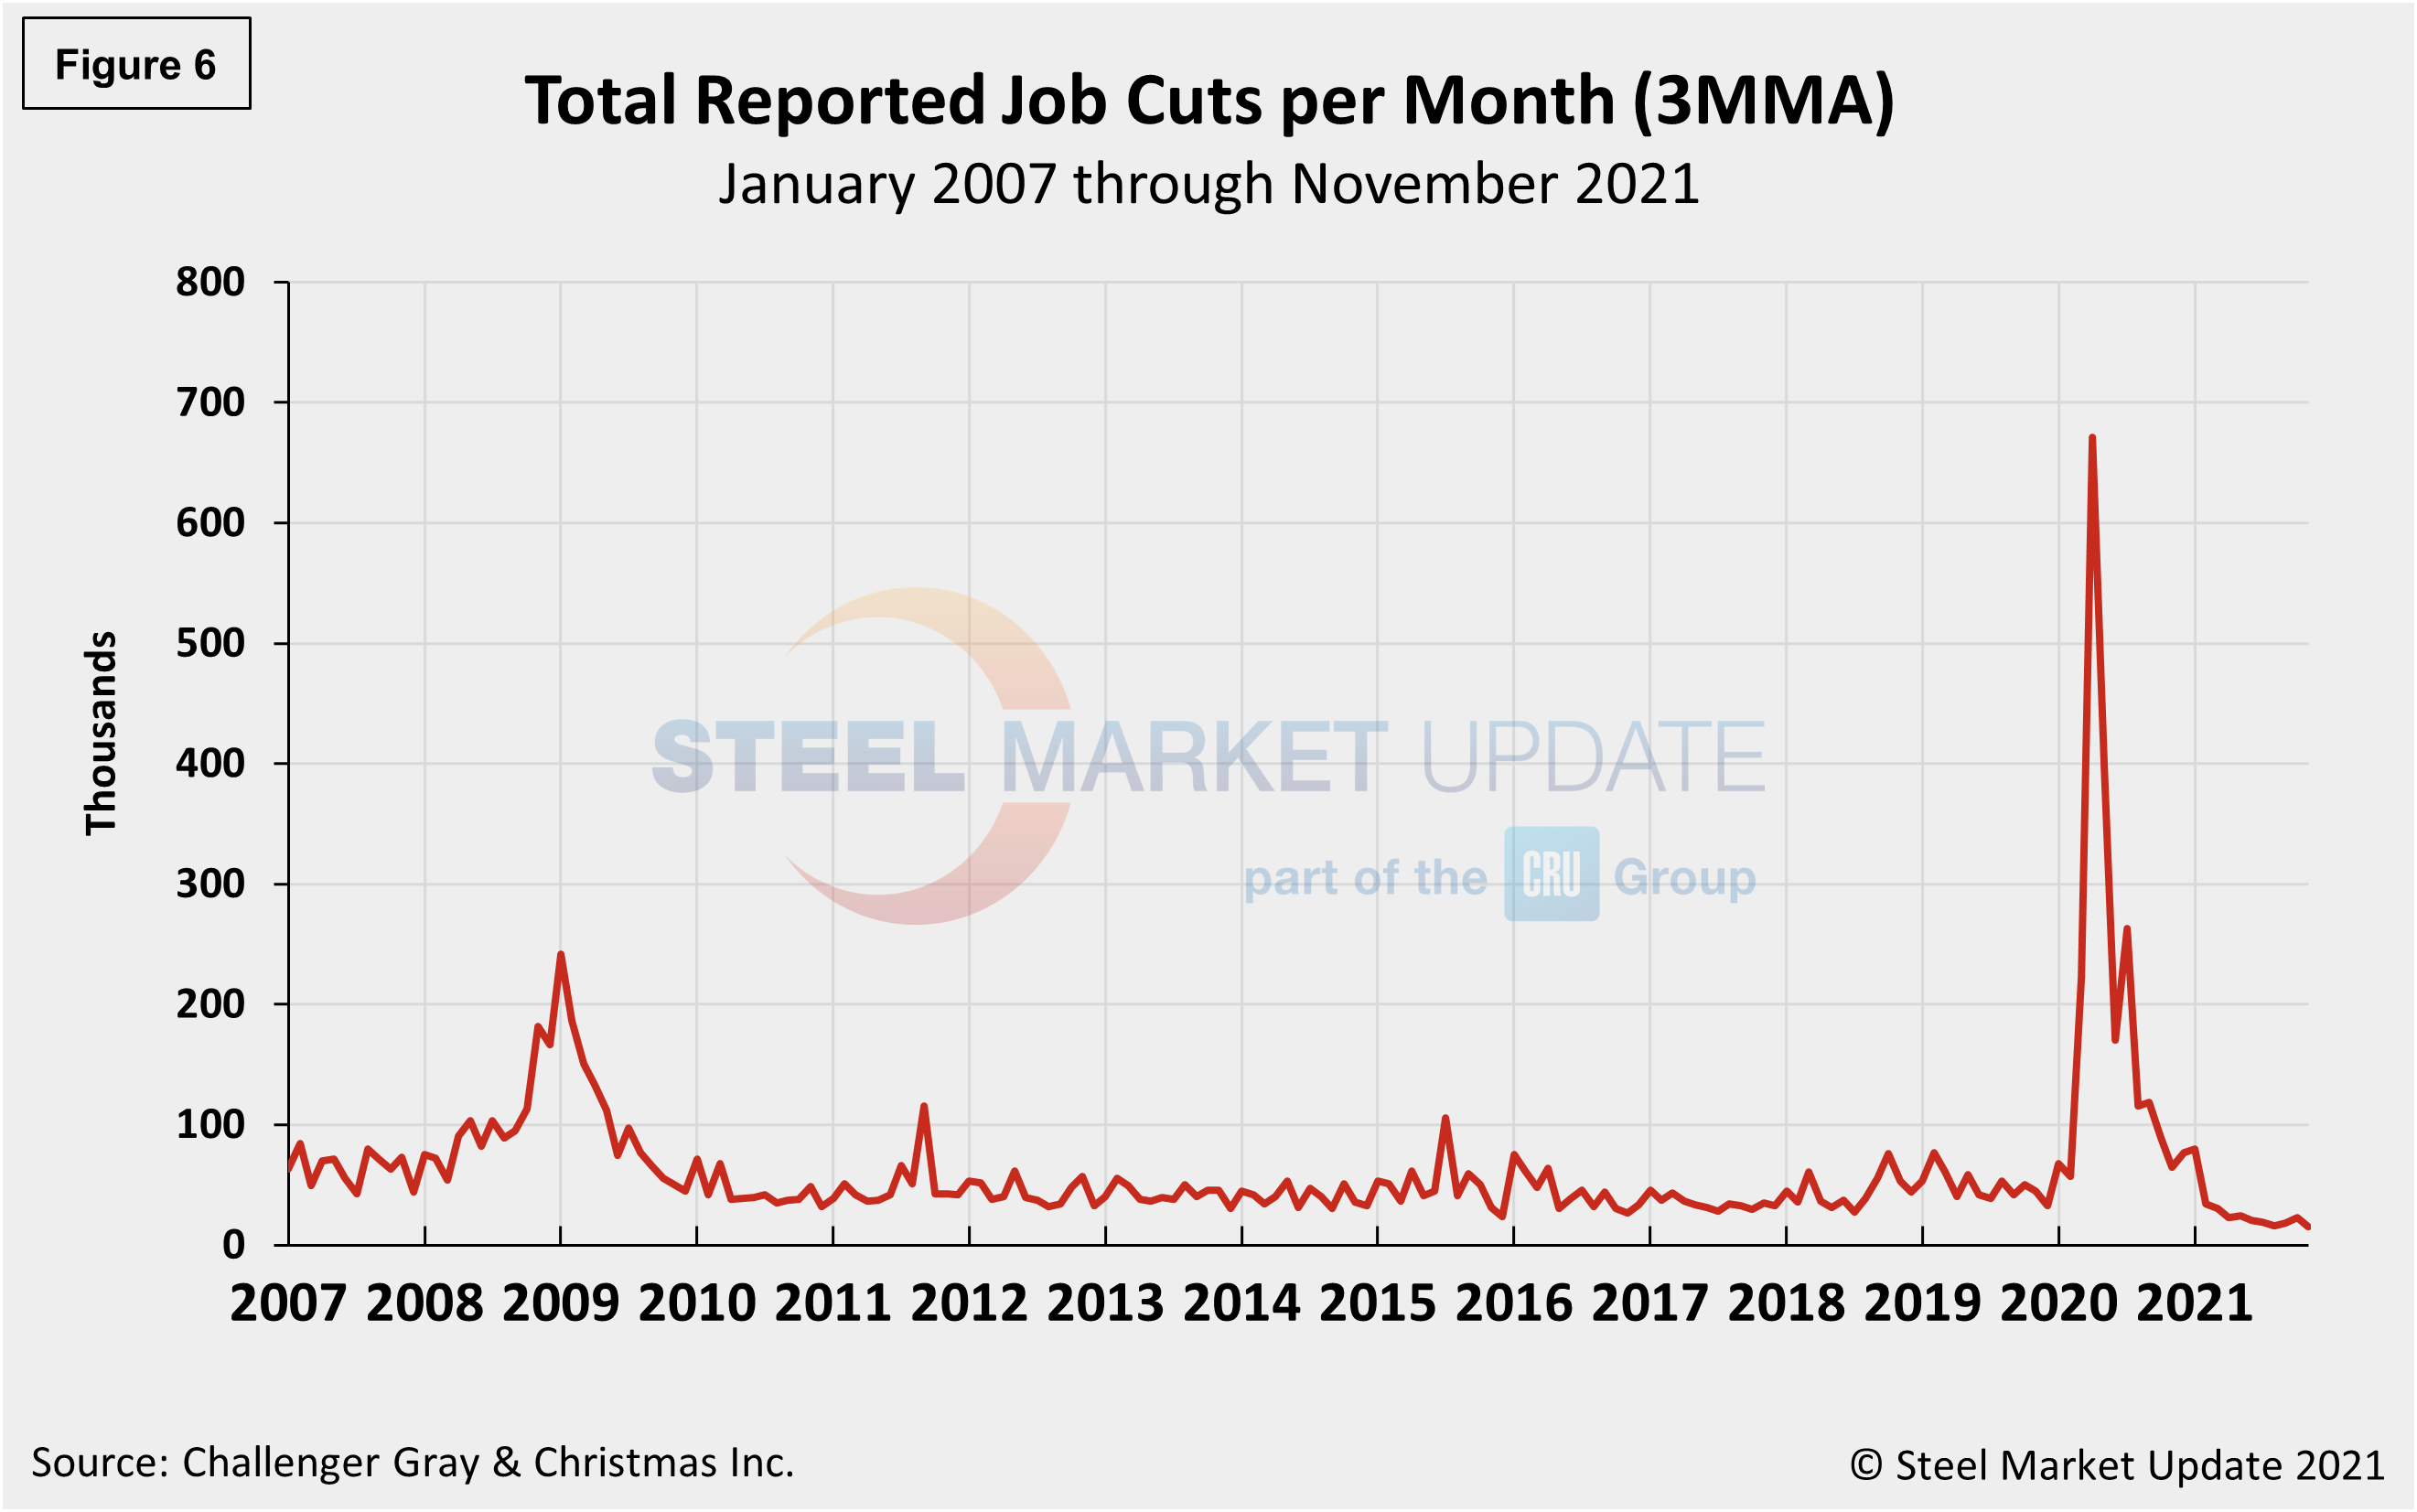
Year-to-date, employers have announced plans to cut 302,918 jobs from their payrolls, down 86.0% from the 2.2 million jobs eliminated through the same period last year. It is the lowest January-November total on record.
Explanation: On the first Friday of each month, the Bureau of Labor Statistics releases the employment data for the previous month. Data is available at www.bls.gov. The BLS reports on the results of two surveys. The Establishment survey reports the actual number employed by industry. The Household survey reports on the unemployment rate, participation rate, earnings, average workweek, the breakout into full-time and part-time workers and lots more details describing the age breakdown of the unemployed, reasons for and duration of unemployment.
By David Schollaert, David@SteelMarketUpdate.com


