

Analysis

December 9, 2021
North American Auto Assemblies Gain Ground in November
Written by David Schollaert
Steel Market Update is pleased to share this Premium content with Executive members. For information on upgrading to a Premium-level subscription, email Info@SteelMarketUpdate.com.
North American auto assemblies pushed higher in November, expanding for the second straight month as they recover from the lowest monthly total year-to-date in September. November’s production total was up 4.1% sequentially, but was still down 8.7% year on year.
The impact of the microchip shortage and supply-chain disruptions is still constraining the automotive sector; however, most carmakers have seen noticeable production improvements. The semiconductor scarcity and parts delays had further worsened through the third quarter, reducing vehicle inventories and causing regional sales to tumble during the month, according to LMC Automotive (LMCA), however, the fourth quarter has stabilized resulting in steady advancements.
North American vehicle production, including personal and commercial vehicles, totaled 1.146 million units in November, up from 1.100 million units in October, but down from 1.256 million units in November 2020.
Despite some improvements, and speculation that the worst may have passed, continued delays and production shortages are expected at vehicle assembly plants across the country for the remainder of the year. The duration of the chip shortage is still expected to carry on well into 2022, keeping vehicle inventories at historically low levels and further impacting sales.
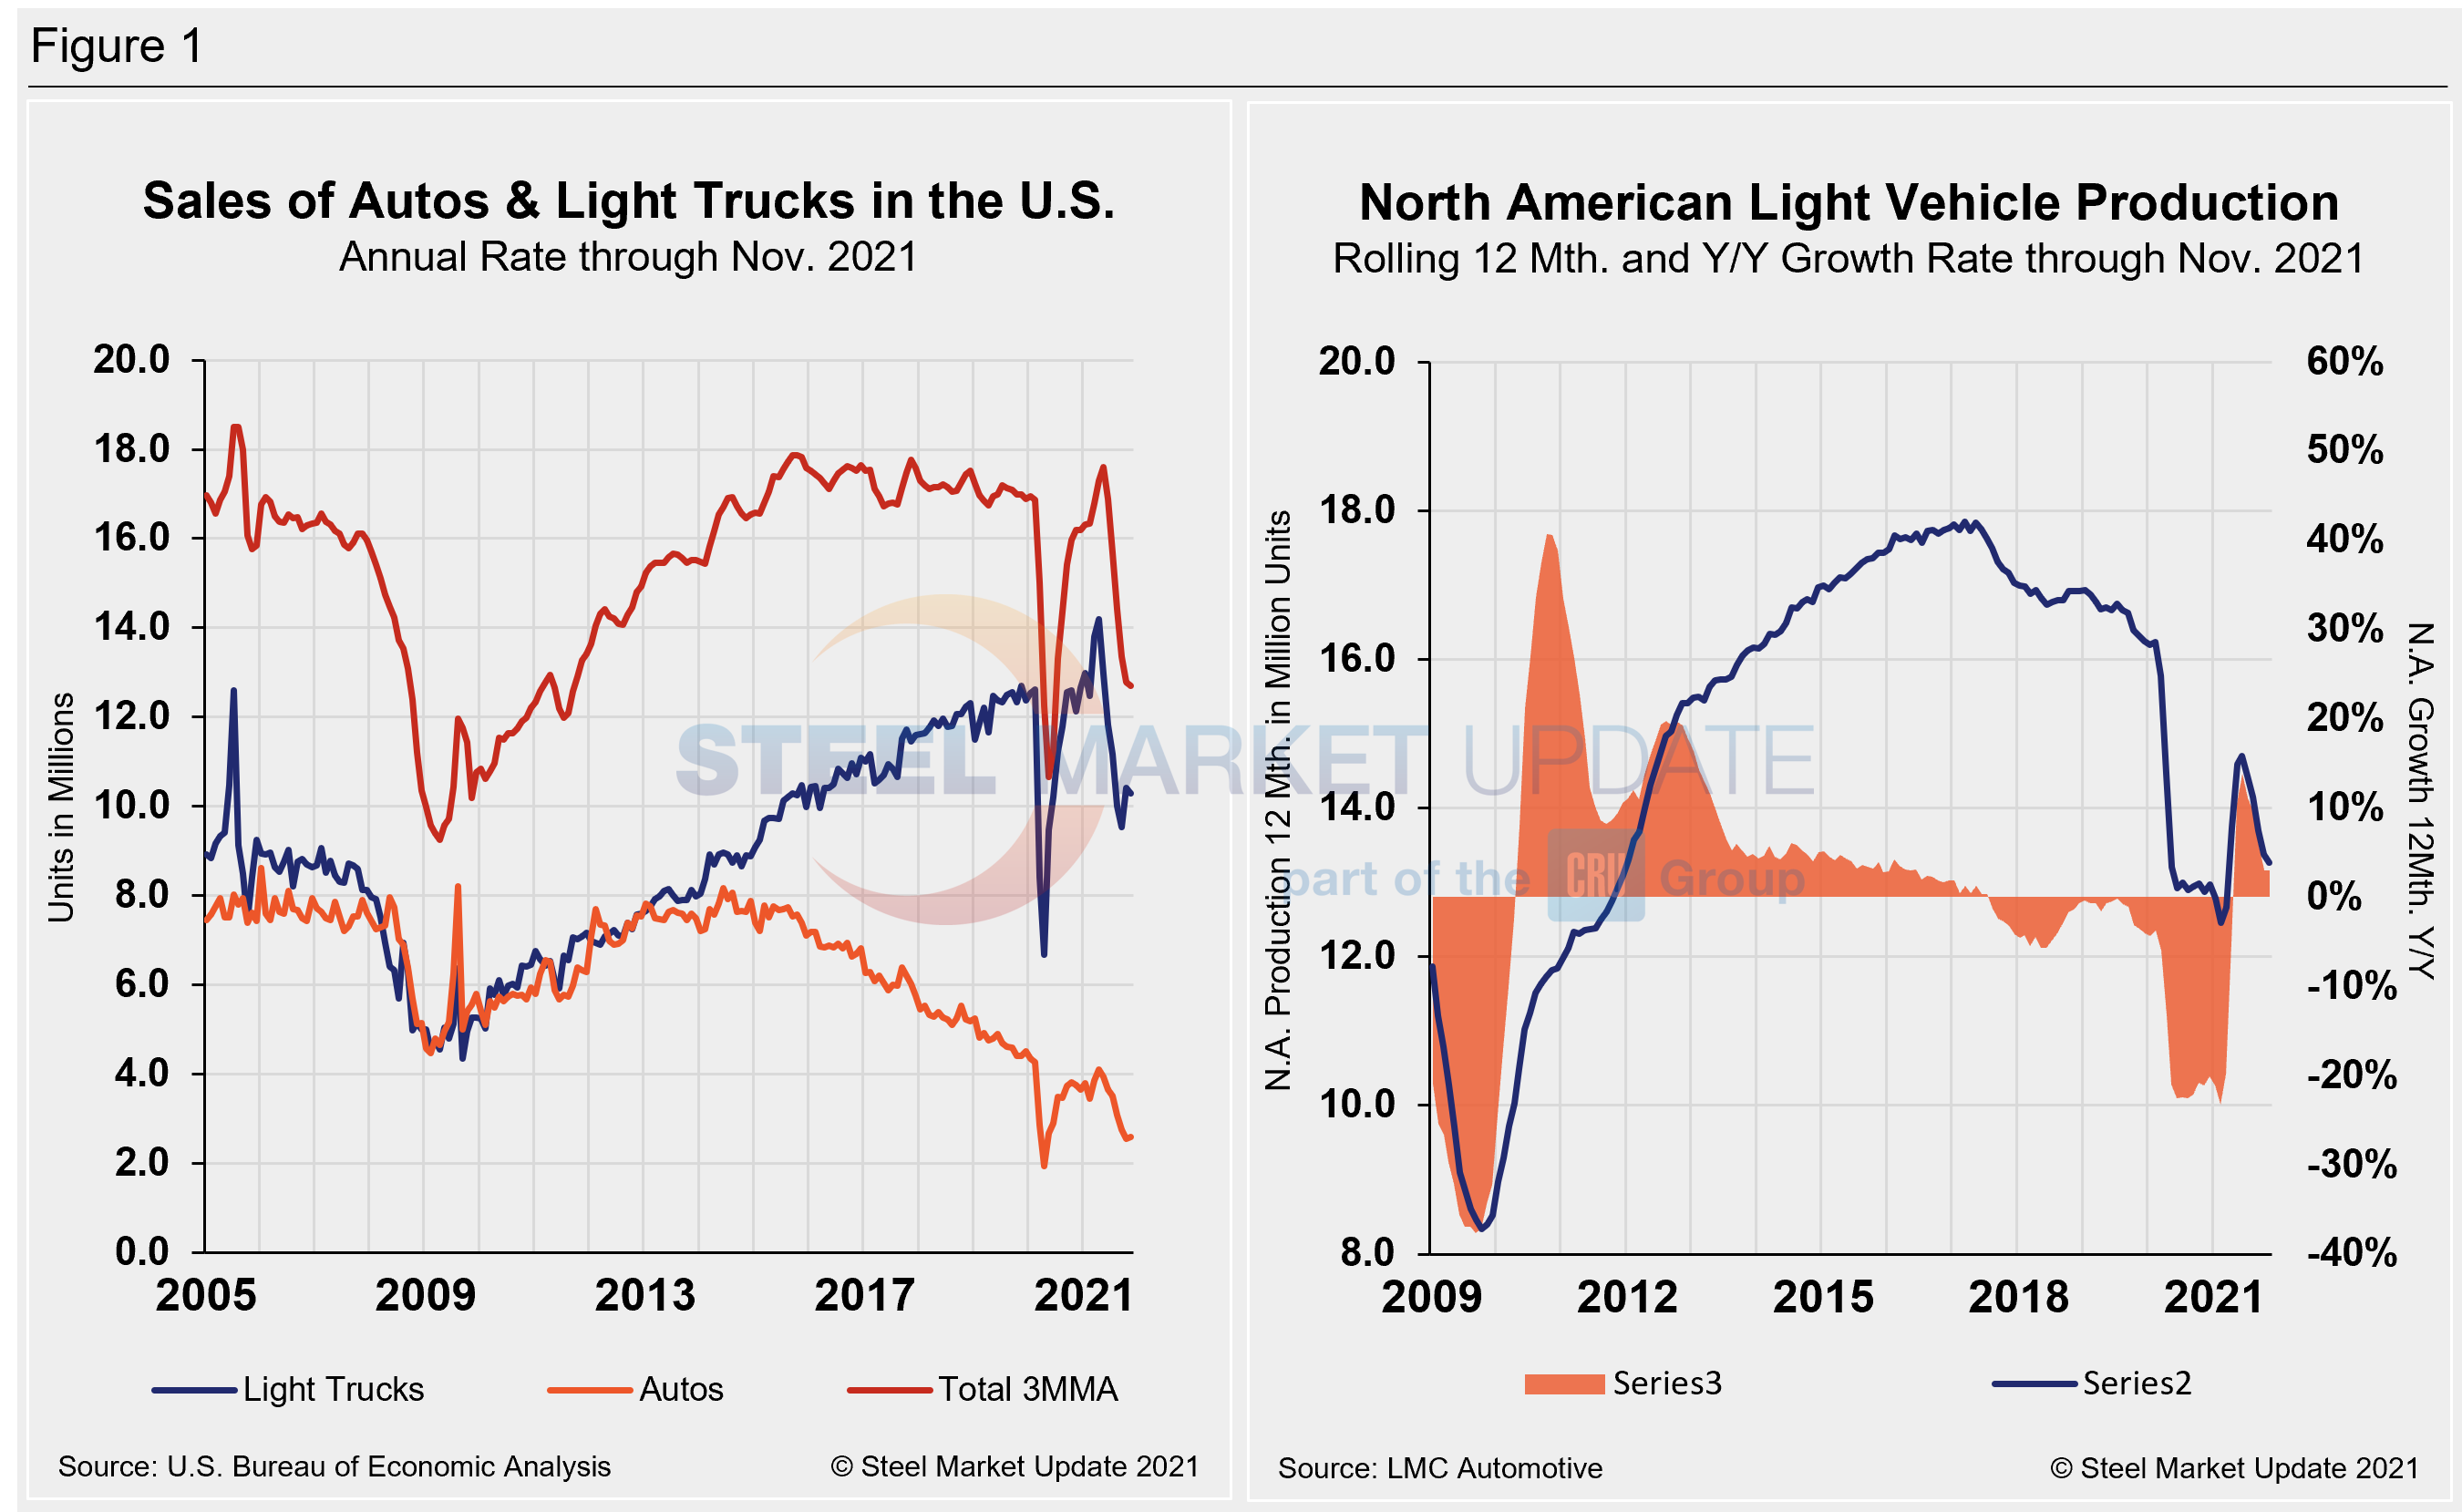
Sales volumes saw an aggressive rebound a year ago, recovering from the initial impact of the COVID-related closures. The extended effects of the pandemic caused U.S. light vehicle sales to tumble last month, unable to keep the momentum seen in October. Sales are still being impacted partly due to inventory limitations. Volumes fell by 21.5% year on year to 12.864 million units annualized and seasonally adjusted in November, compared to 16.185 million units during the same year-ago period.
The chip shortage – and supply chain disruptions more generally – continued to weigh on inventory and therefore sales. The average transaction price hit another record high of $46,329 in November. That’s a 13.0% gain or $5,392 more than just one year ago, and up from $44,417 in October.
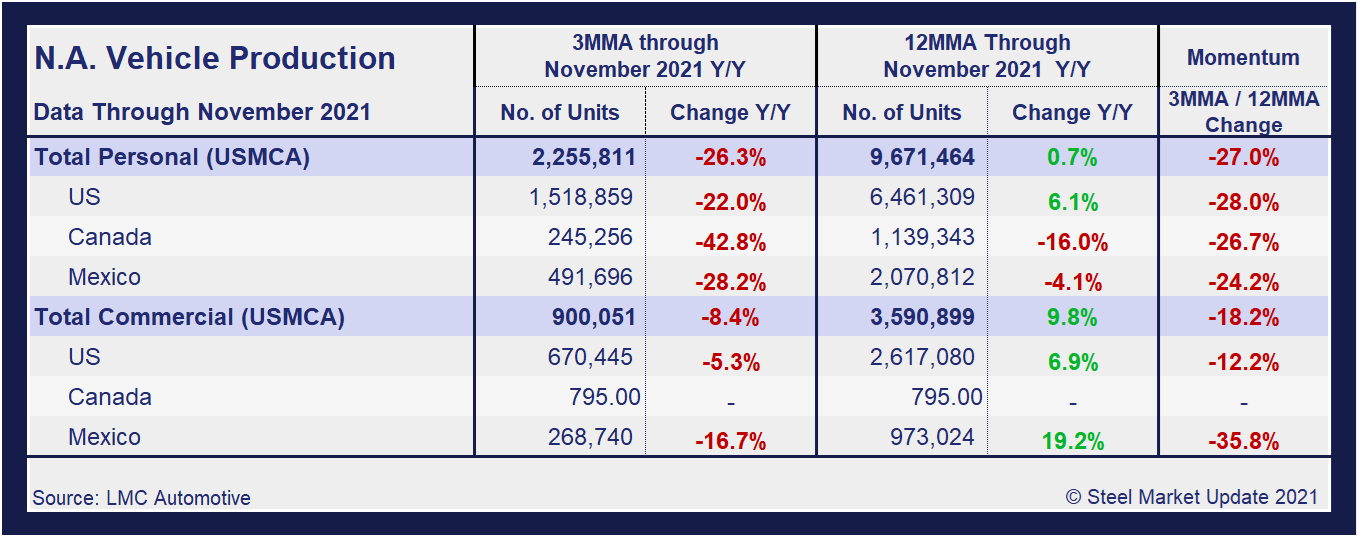
A short-term snapshot of assembly by nation and vehicle type is shown in the table below. It breaks down total North American personal and commercial vehicle production into the U.S, Canadian and Mexican components, along with the three- and 12-month growth rate for each. At the far right it shows the momentum for the total and for each of the three nations.
Although the initial rebound from the COVID-19 doldrums was impressive, the effect of the chip shortage has been even more damaging due to its prolonged nature. Through June, growth rates for personal and commercial light vehicles soared by 156.8% and 127.4%, respectively, but have since seen a nosedive as the chip shortage and supply-chain disruptions have taken hold.
In three months through November, the growth rate for total personal vehicle assemblies in the USMCA was a negative -27.0% year over year, but still a 3.1 percentage point improvement month on month. Commercial light vehicle assemblies saw a decline of -18.2% over the same period, but a 4.2 percentage point worsening compared the month prior. The impact of the global semiconductor chip shortage on automotive production across North America has been disastrous.
Personal Vehicle Production
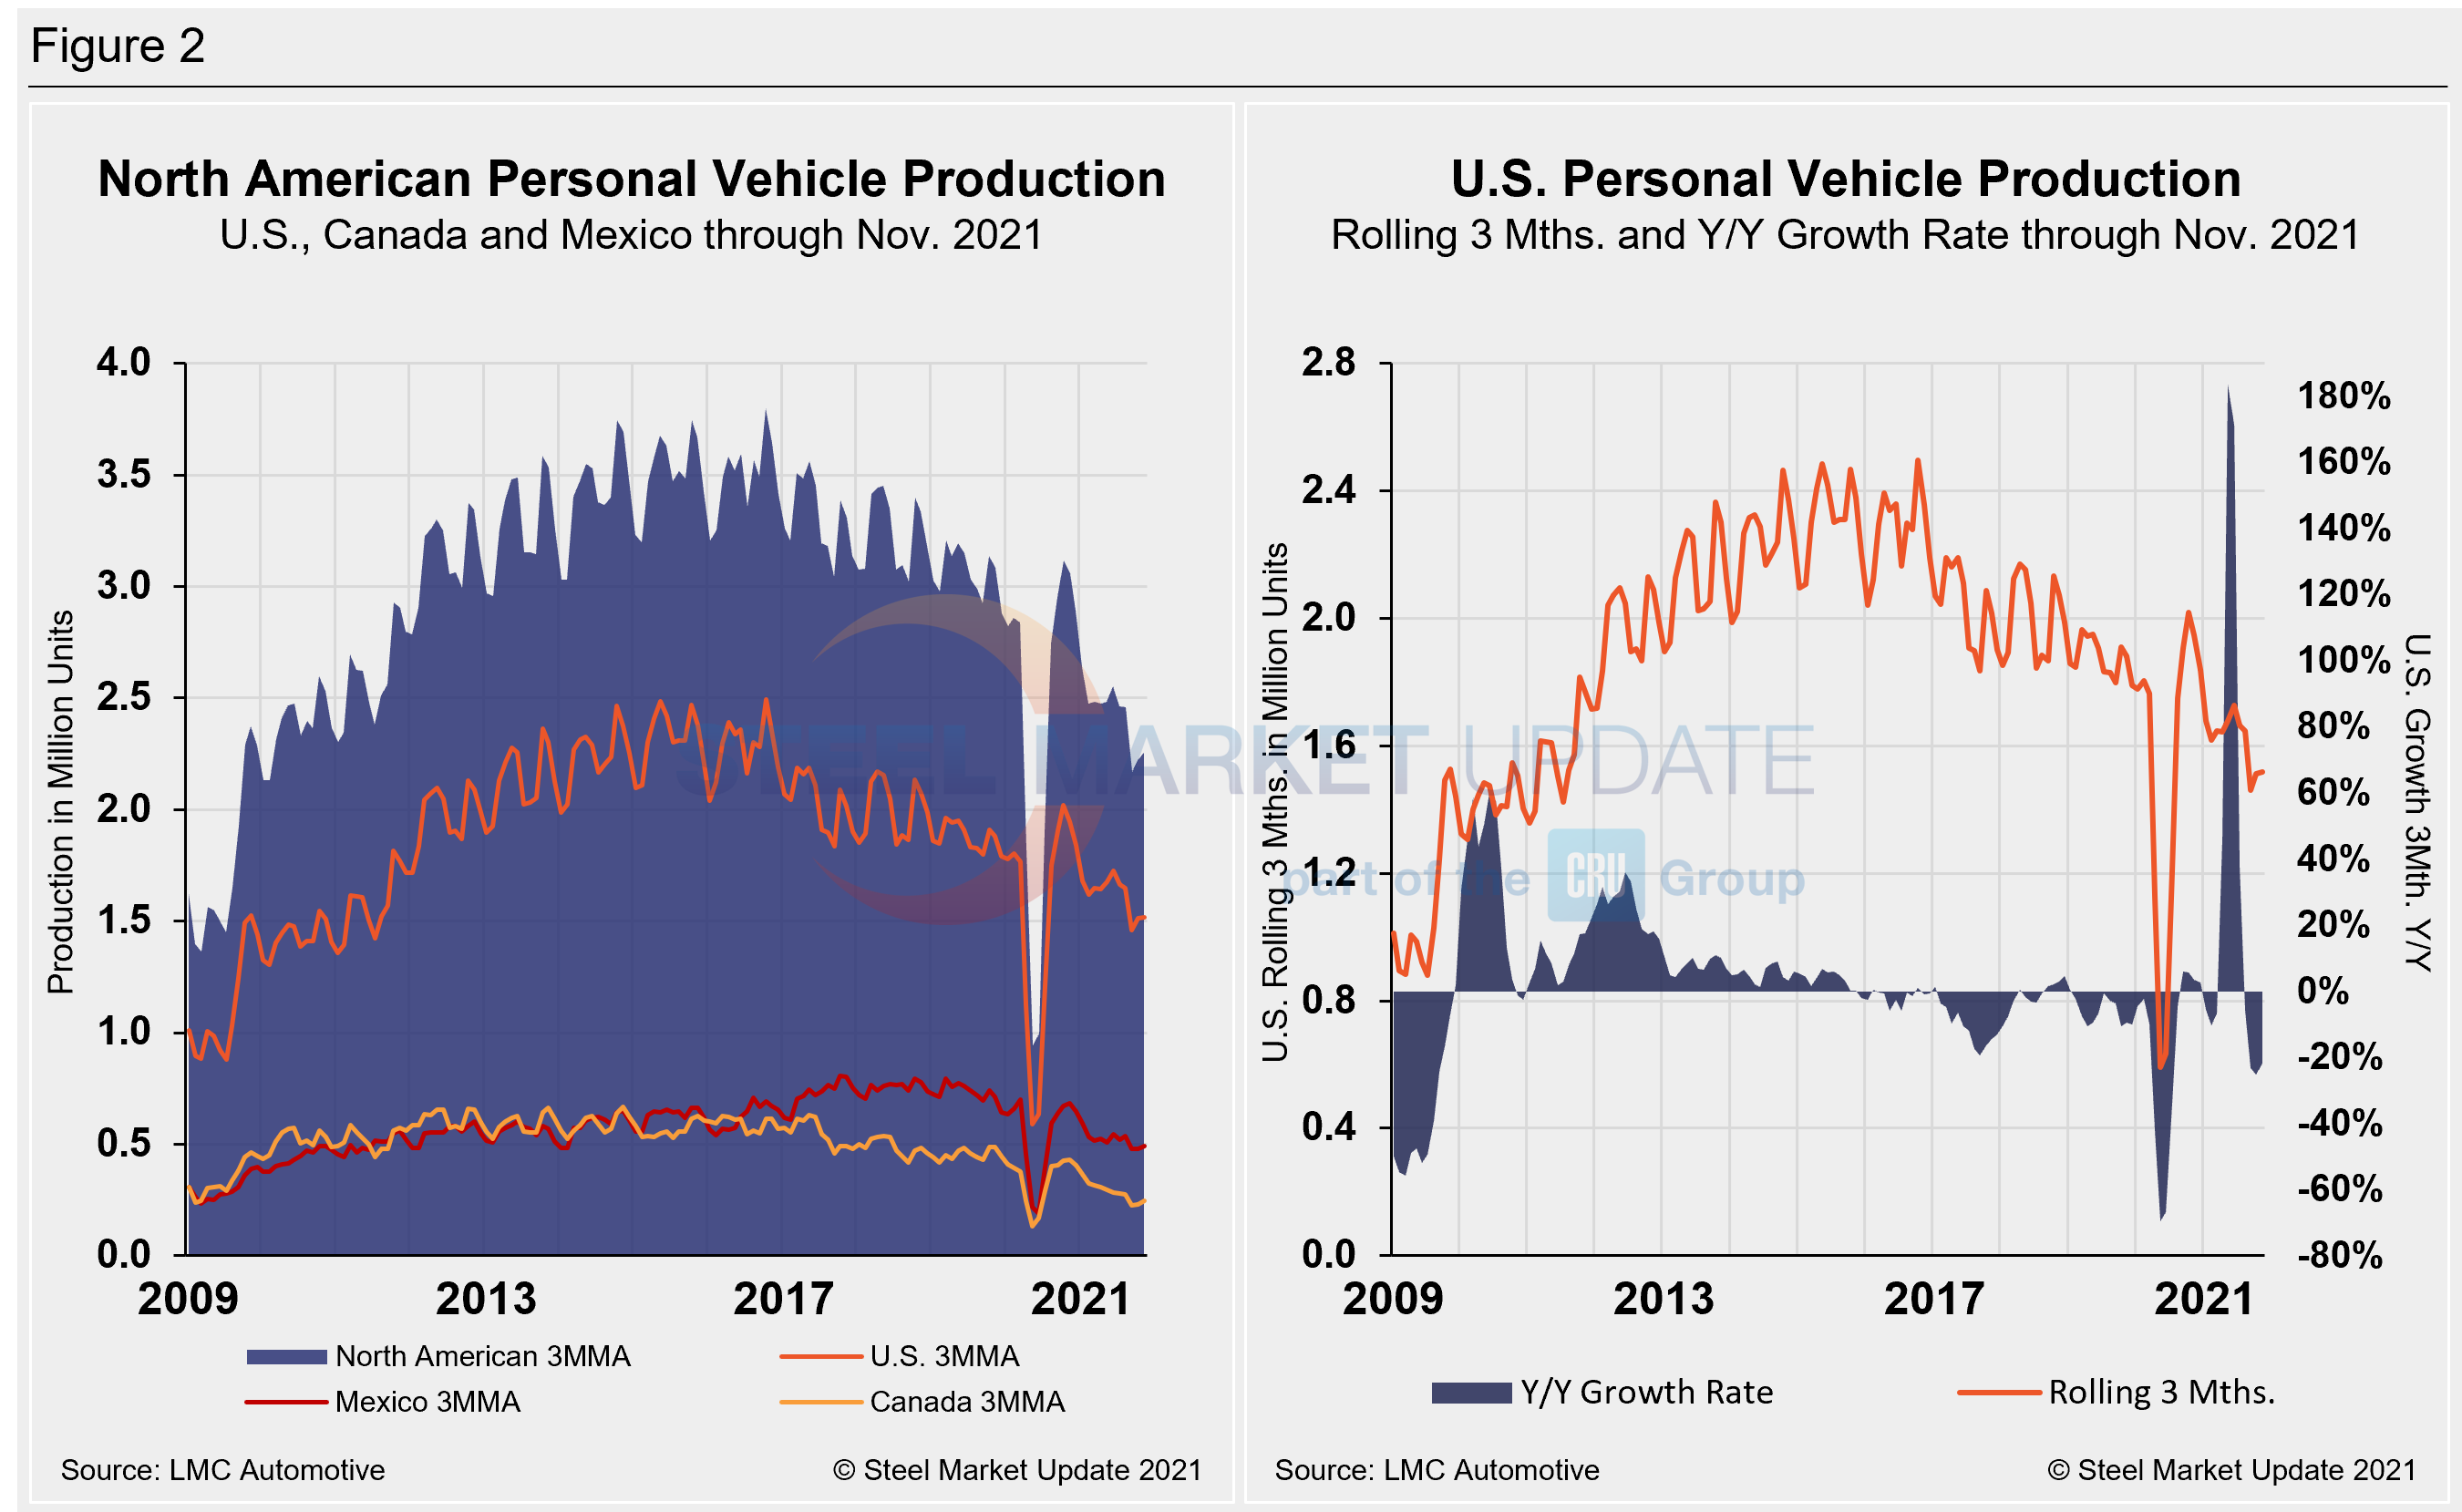
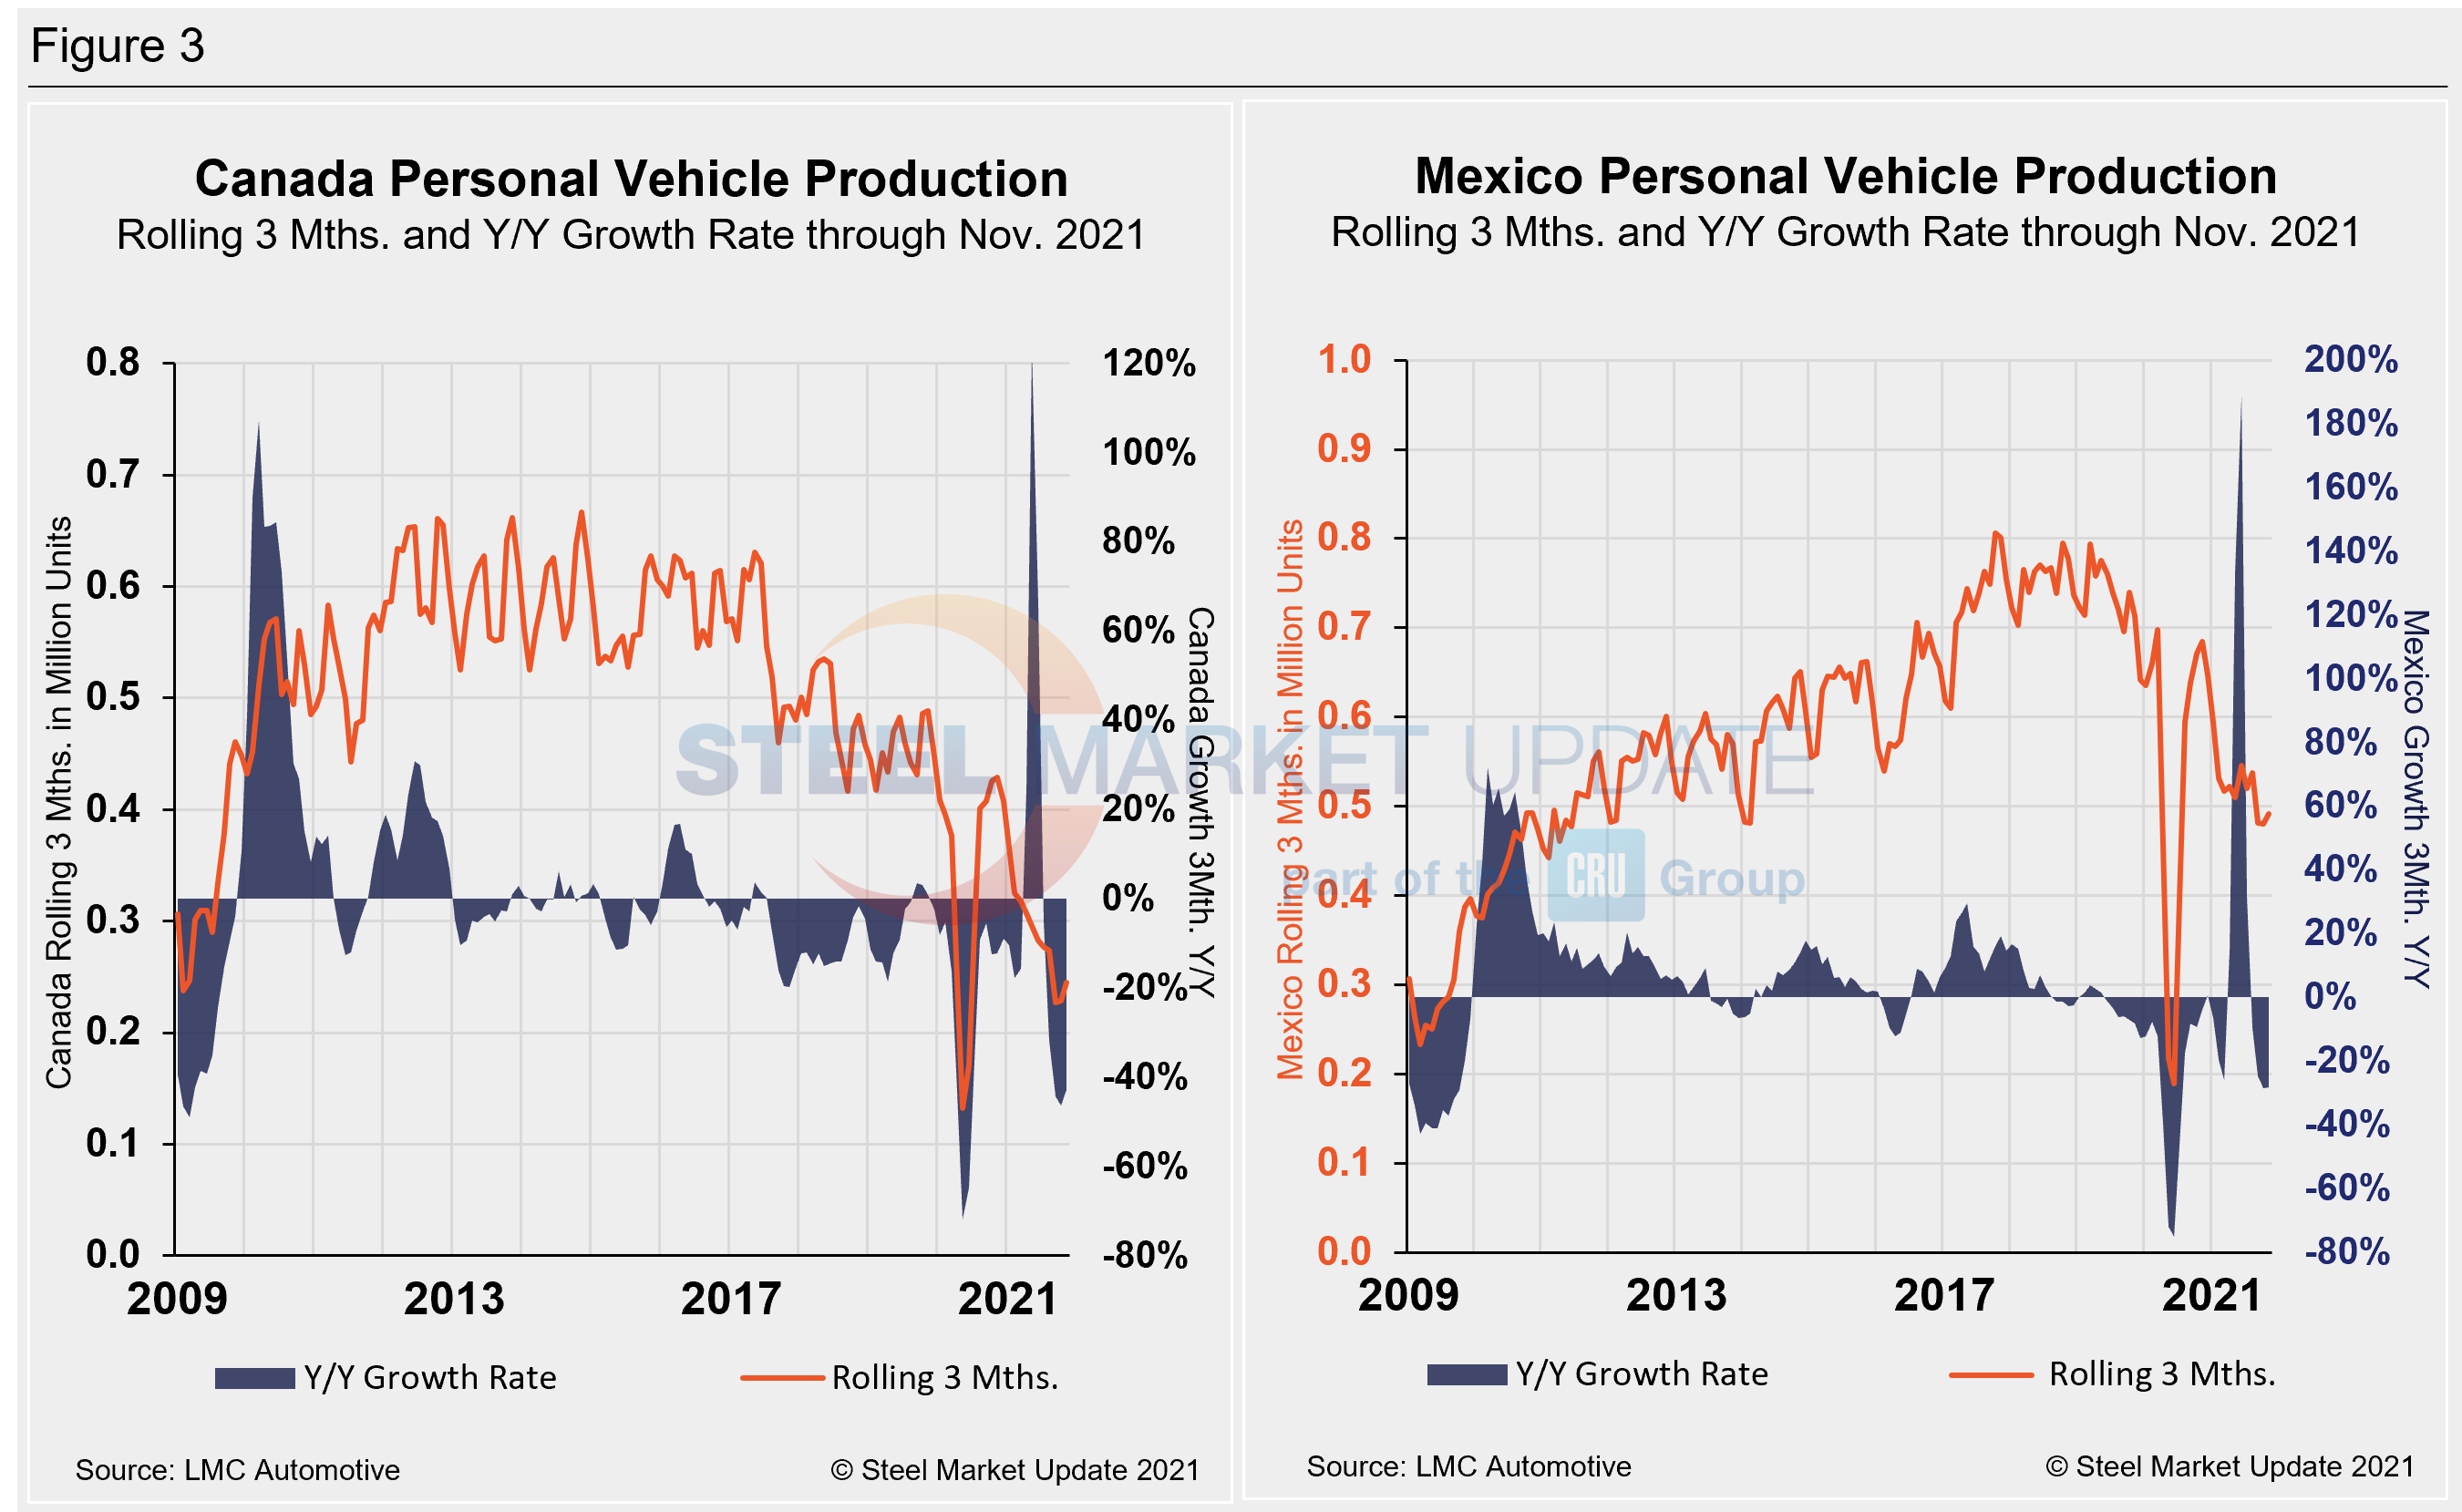
The longer-term picture on personal vehicle production across North America is shown below. The first chart in Figure 2 shows the total personal vehicle production for North America and the total for each nation. The production of personal vehicles in the U.S. and the year-over-year growth rate is displayed in the second chart. Figure 3 shows side-by-side the production of personal vehicles in Canada and Mexico and the year-over-year growth rate.
In terms of personal vehicle production, all three countries in the region recovered further in November, building on the growth seen the month prior. Canada again saw the greatest percentage increase at 22.7% or 19,195 more units when compared to the month prior. The U.S. saw the largest growth in total units, up 24,766 units or 4.7% month on month. Mexican auto assemblies were up 4.4% or 7,466 units in November versus the prior month. The annual growth rate across the region plummeted – Canada saw the most aggressive decrease at -42.8%, followed by Mexico at -28.2% and the U.S. at -22.0%.
Canada’s personal vehicle production share of the North American market rose to 10.9% in November, compared to 10.3% the month prior. Mexico was 21.8% last month versus 21.6% in October, while the U.S. edged down to a 67.3% share of the North American market in November versus 68.1% the month prior.
Commercial Vehicle Production
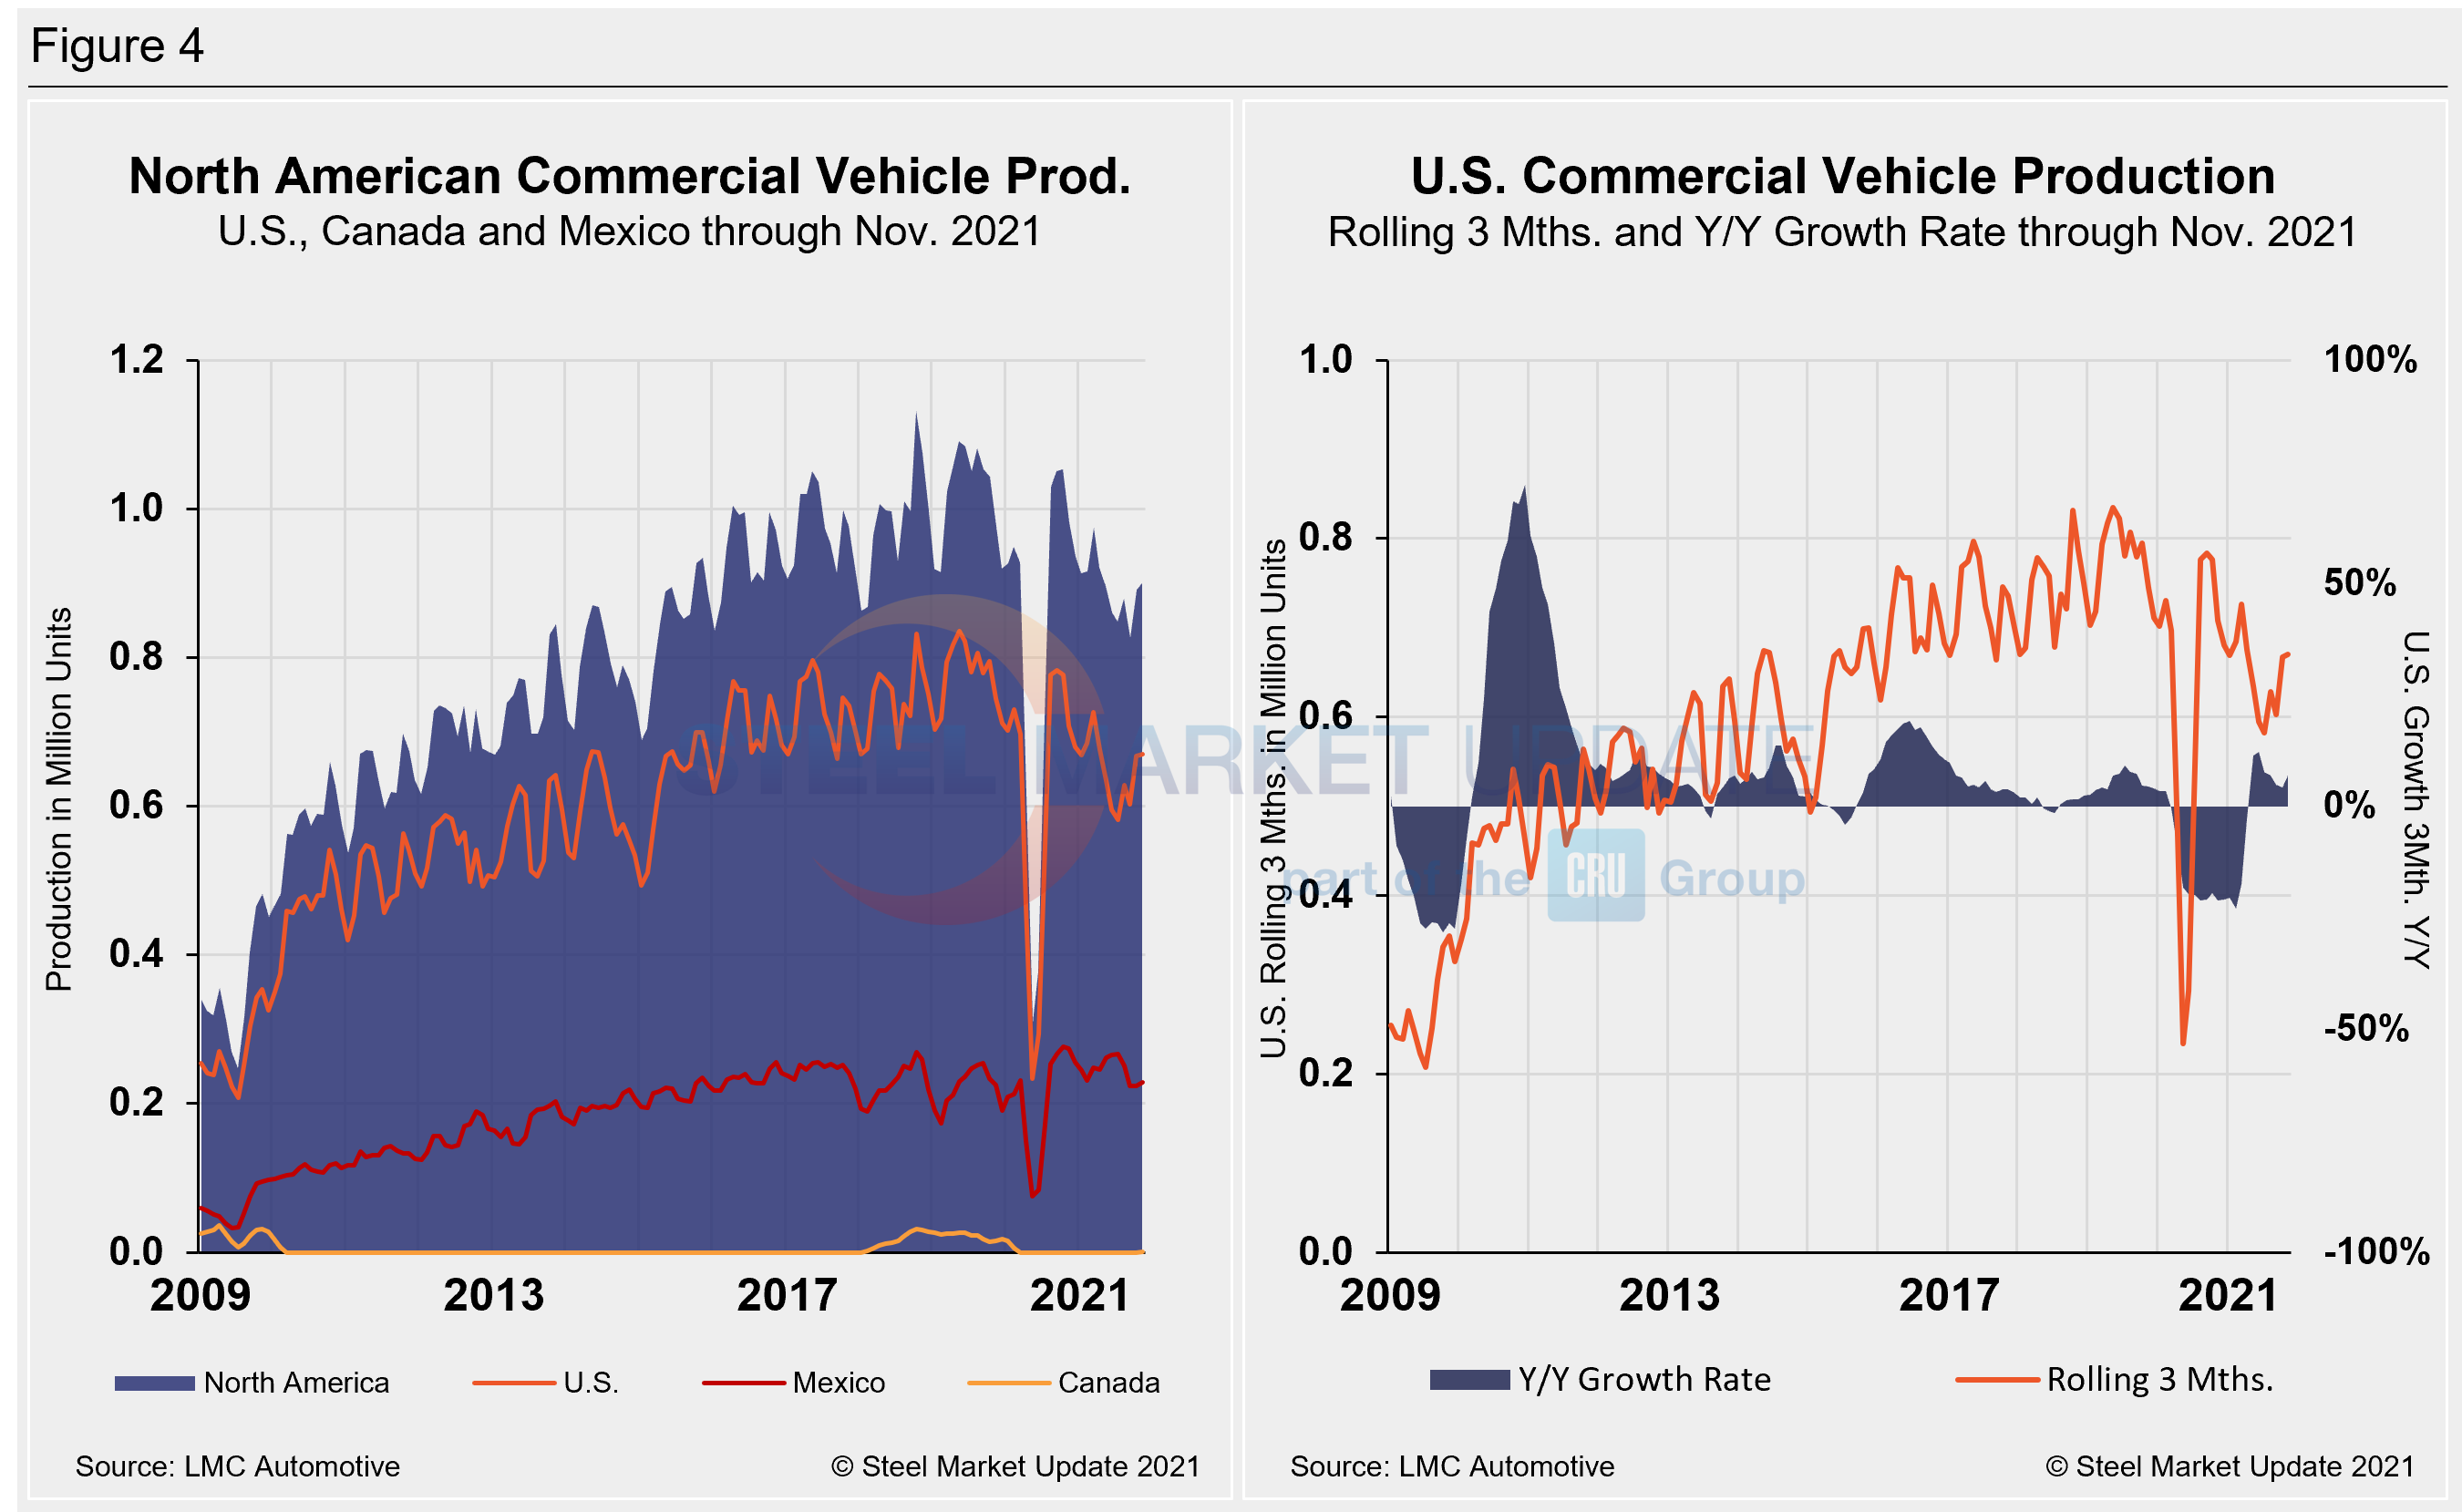
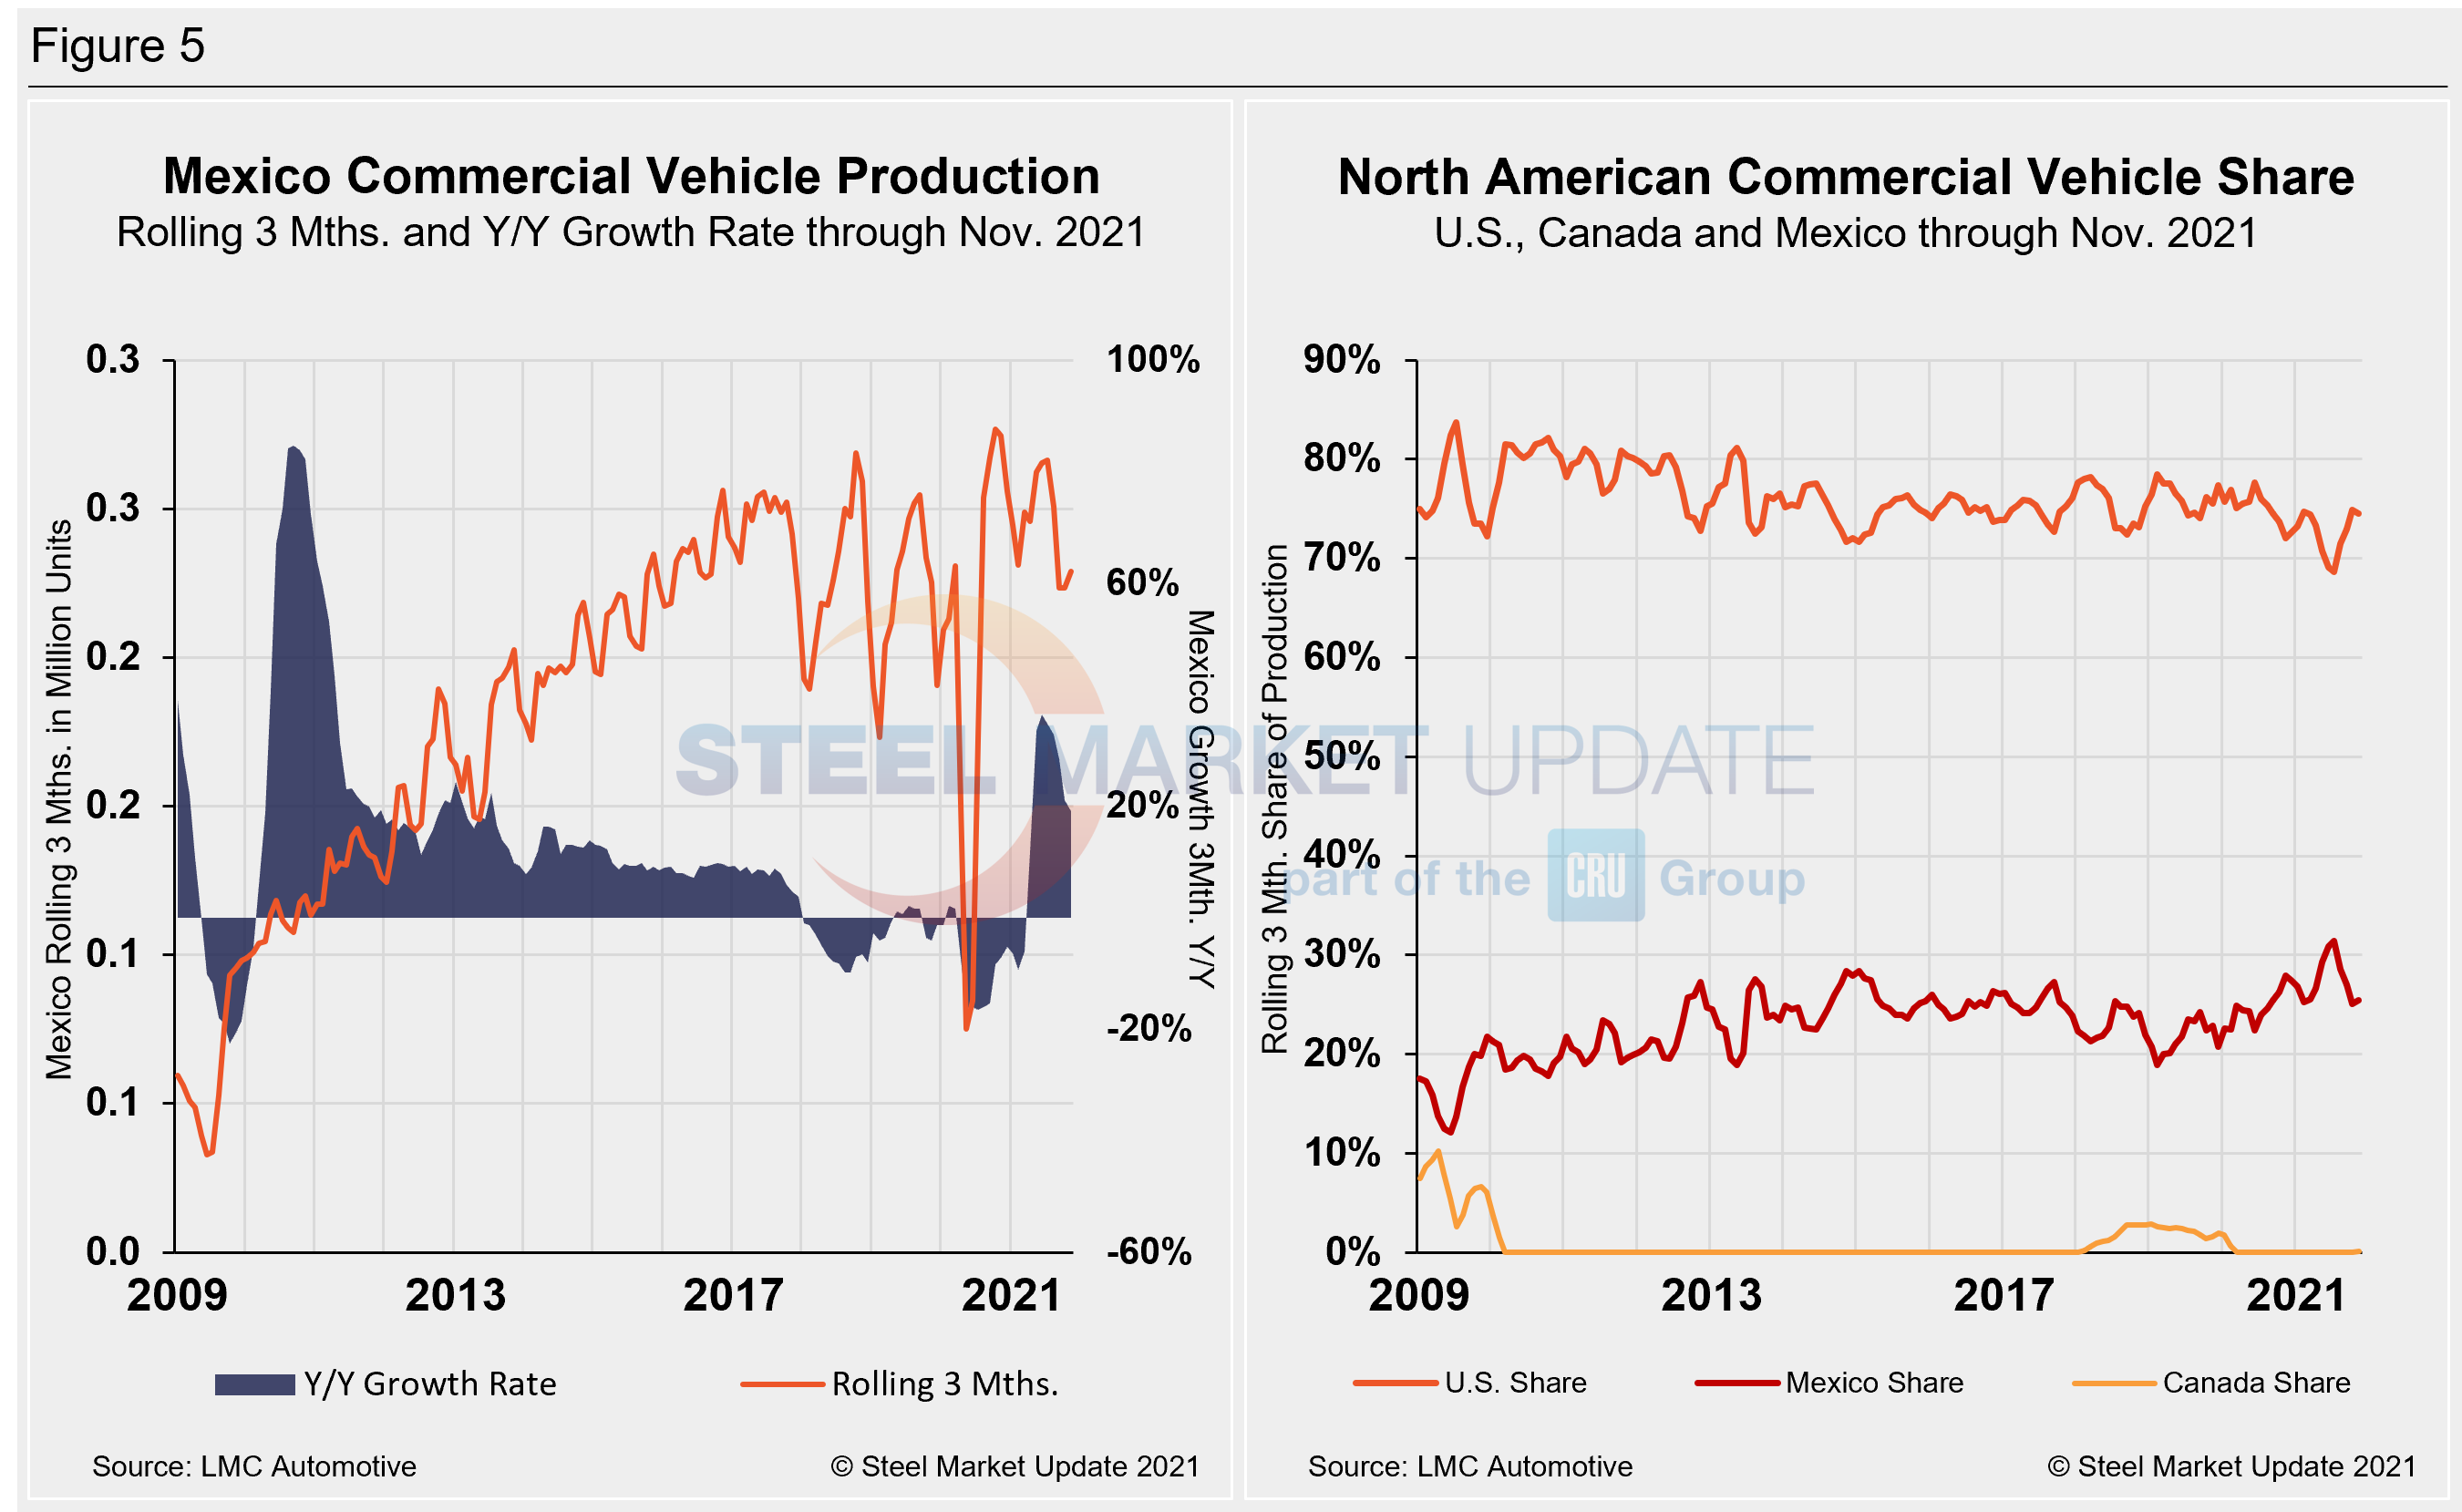
Total commercial vehicle production for North America and the total for each nation on a rolling three-month basis is shown below in the first chart in Figure 4, while the production of commercial vehicles in the U.S and the year-over-year growth rate is displayed in the second chart. Figure 5 shows the production of commercial vehicles and the year-over-year growth rate in Mexico displayed in the first chart, while the second chart shows the production share for each nation. Of note for the Canadian automotive sector, November marked Canada’s first month of commercial vehicle production in 23 months. The U.S.’s northern neighbor produced 795 light commercial vehicles in November, the first month of production since December 2019 when they produced 5,966 units.
North American commercial vehicle production was down 1.9% in November, 5,986 units month on month. The downgrade comes after a surge of 22.5% the month prior when the region produced 321,744 units. Despite the increase in Canadian light commercial vehicles, the month-on-month dip was driven by decreases of 1.7% or 4,515 units in the U.S., and a decrease of 3.1% or 2,630 unts in Mexico. Production limitations due to the semiconductor shortage and other supply-chain constraints are expected to continue through the fourth quarter, but the addition of Canadian-produced commercial light vehicles is a noteworthy mark.
The annual growth rate is now negative at -16.7% in Mexico, year on year, while the U.S. growth rate over the same period is -5.3%. Canada’s renewed production saw its growth rate improve to -86.7% in November. The U.S. share was 74.5% in November, down 0.4 of a percentage point versus the month prior. Mexico’s share fell similarly to 19.2% month on month, while Canada now has a 0.1% share of the market with November’s added units. Presently, Mexico exports just under 80% of its light vehicle production, while the U.S and Canada are the highest volume destinations for Mexican exports.
Editor’s Note: This report is based on data from LMC Automotive for automotive assemblies in the U.S., Canada and Mexico. The breakdown of assemblies is “Personal” (cars for personal use) and “Commercial” (light vehicles less than 6.0 metric tons gross vehicle weight rating; heavy trucks and buses are not included). In this report, we describe light vehicle sales in the U.S. and report in detail on assemblies in the three regions of North America.
By David Schollaert, David@SteelMarketUpdate.com


