

Analysis

January 7, 2022
CPIP Data: Construction Spending Edged Up in November
Written by David Schollaert
U.S. construction spending increased in November amid strong gains in single-family homebuilding, but outlays on public projects were weak. Construction spending rose 0.4% after a similar advance in October, the Commerce Department reported.
The Census Bureau’s report on construction spending shows spending on private construction projects rose 0.6% in November. Outlays on residential construction were up 0.9%, while single-family homebuilding spending shot up 1.2%, but outlays on multi-family housing projects dipped 0.3%.
Homebuilding remains constrained by shortages, which are boosting prices of building materials. Residential investment contracted for a second straight quarter in the third quarter, weighed down by decreases in home improvements and single-family homebuilding.
Investment in private nonresidential structures like gas and oil well drilling edged up 0.1% in November. Spending on structures declined for a second straight quarter, led by commercial and healthcare structures.
Spending on public construction projects fell 0.2% in November. Outlays on state and local government construction projects dropped 0.2%, while federal government spending decreased 0.4%.
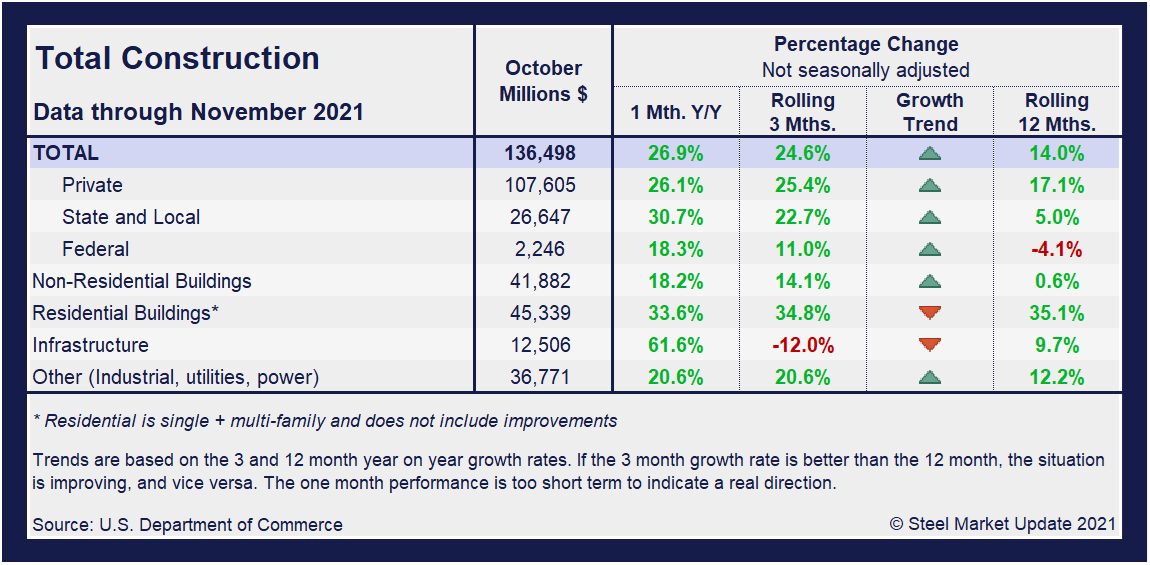
For the year-to-date, construction has consumed $1.626 trillion, 9.3% more than the $1.487 trillion spent during the first 11 months of last year. The results continue to disappoint, however, as the domestic marketplace is now more than a year removed from the worst of the pandemic and struggling to expand as many had anticipated.
Construction put in place in the private sector was at a seasonally adjusted $1.274 trillion in November, up from the revied $1.266 trillion the prior month, a 0.6% increase. Publicly funded construction spending in November rose 0.2% to an annual rate of $352.3 billion, rising for the second straight month after increasing 1.8% in October. Outlays on state and local government construction projects dropped 0.2%, while federal government spending decelerated 0.4%.
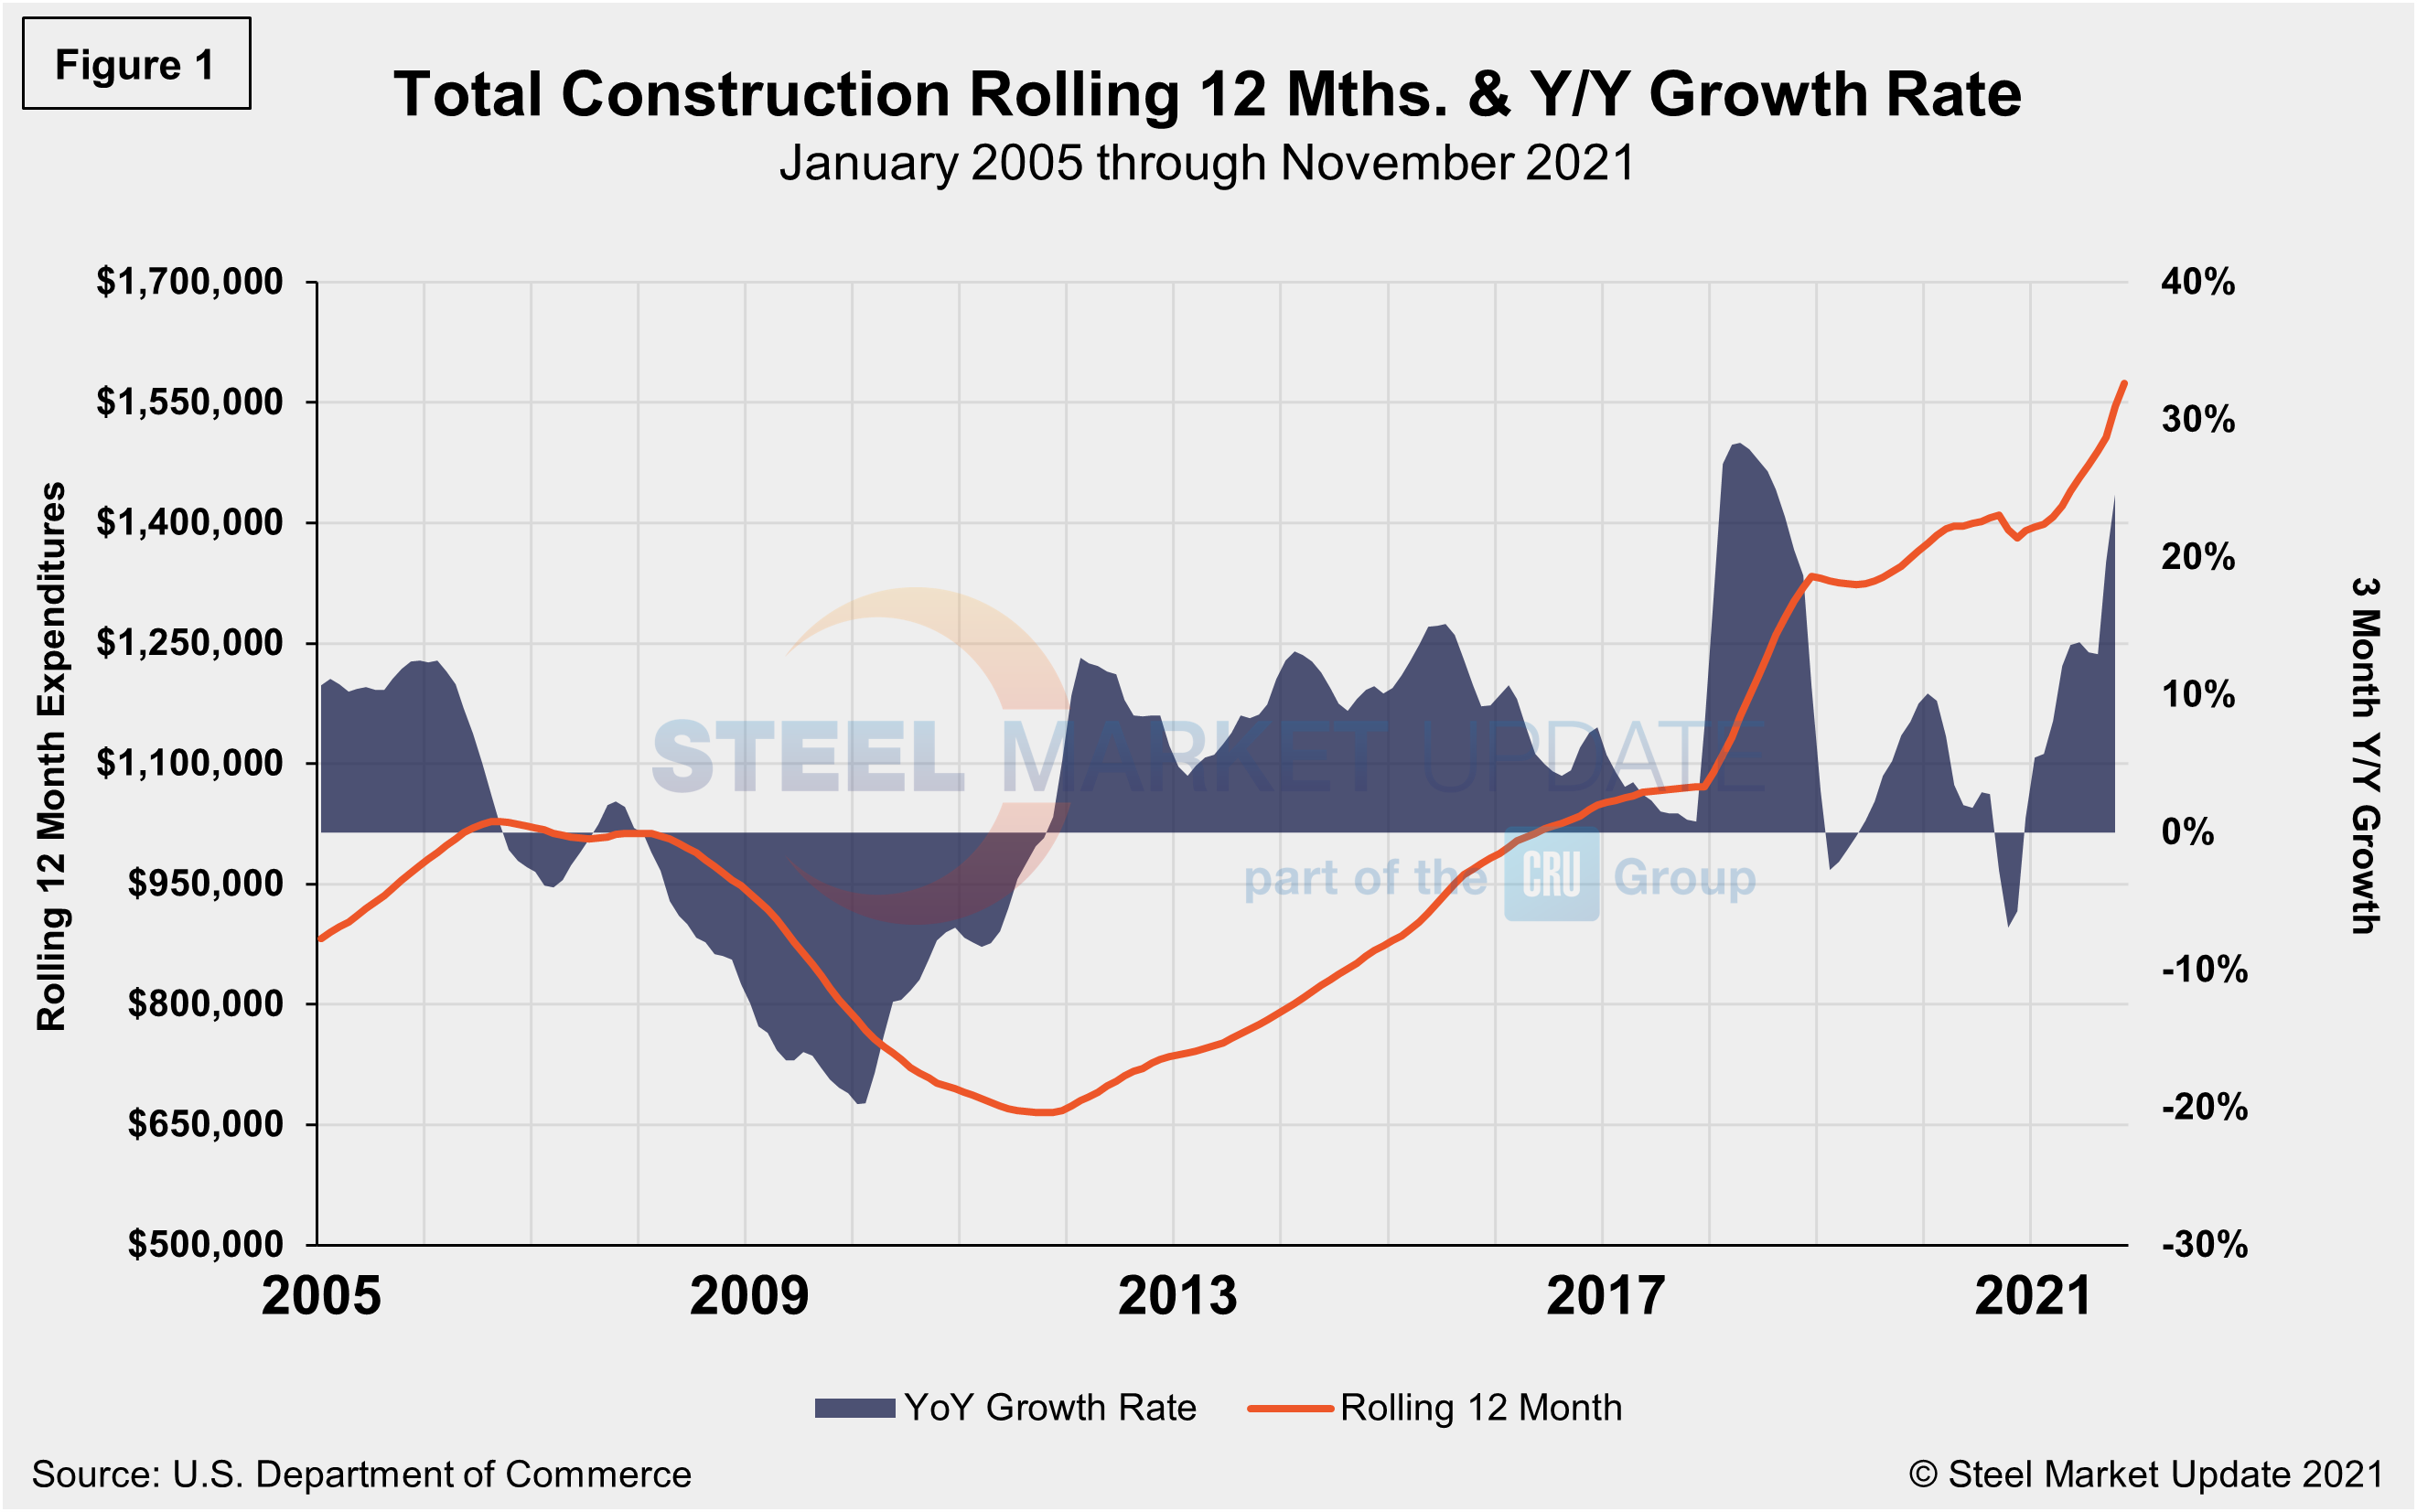
Total construction expenditures and its major categories are shown in the table and chart (Figure 1) below.
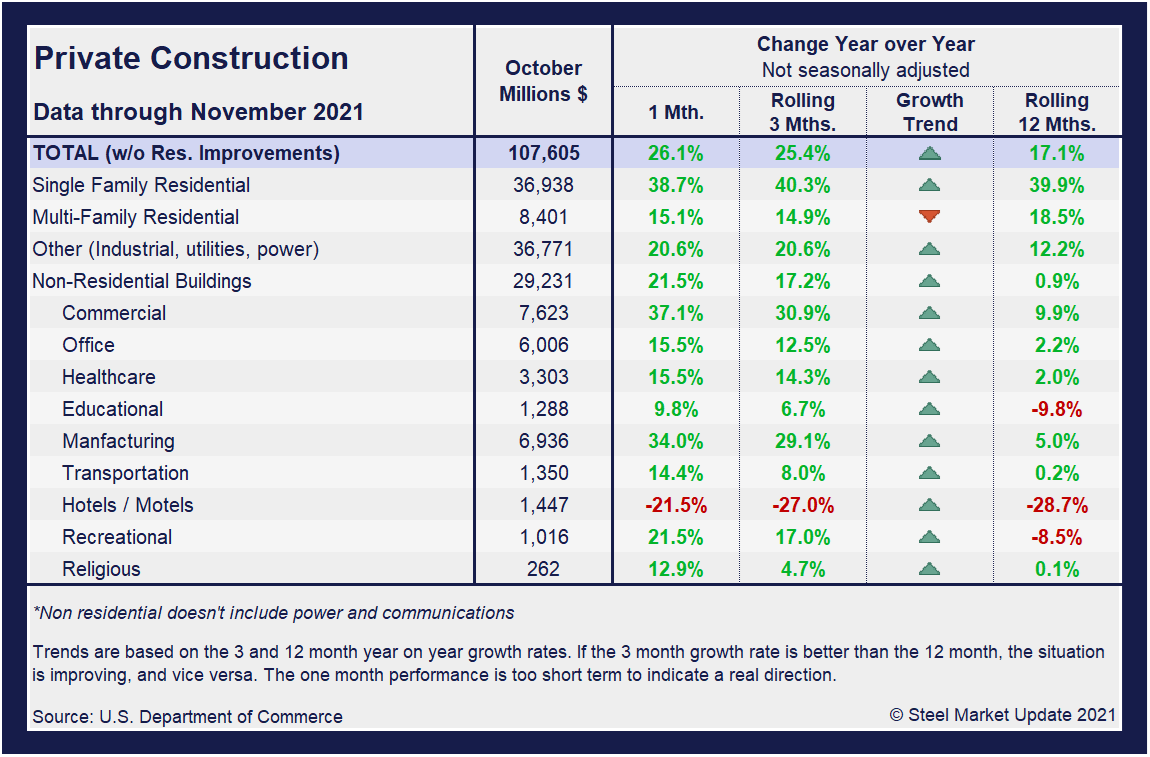
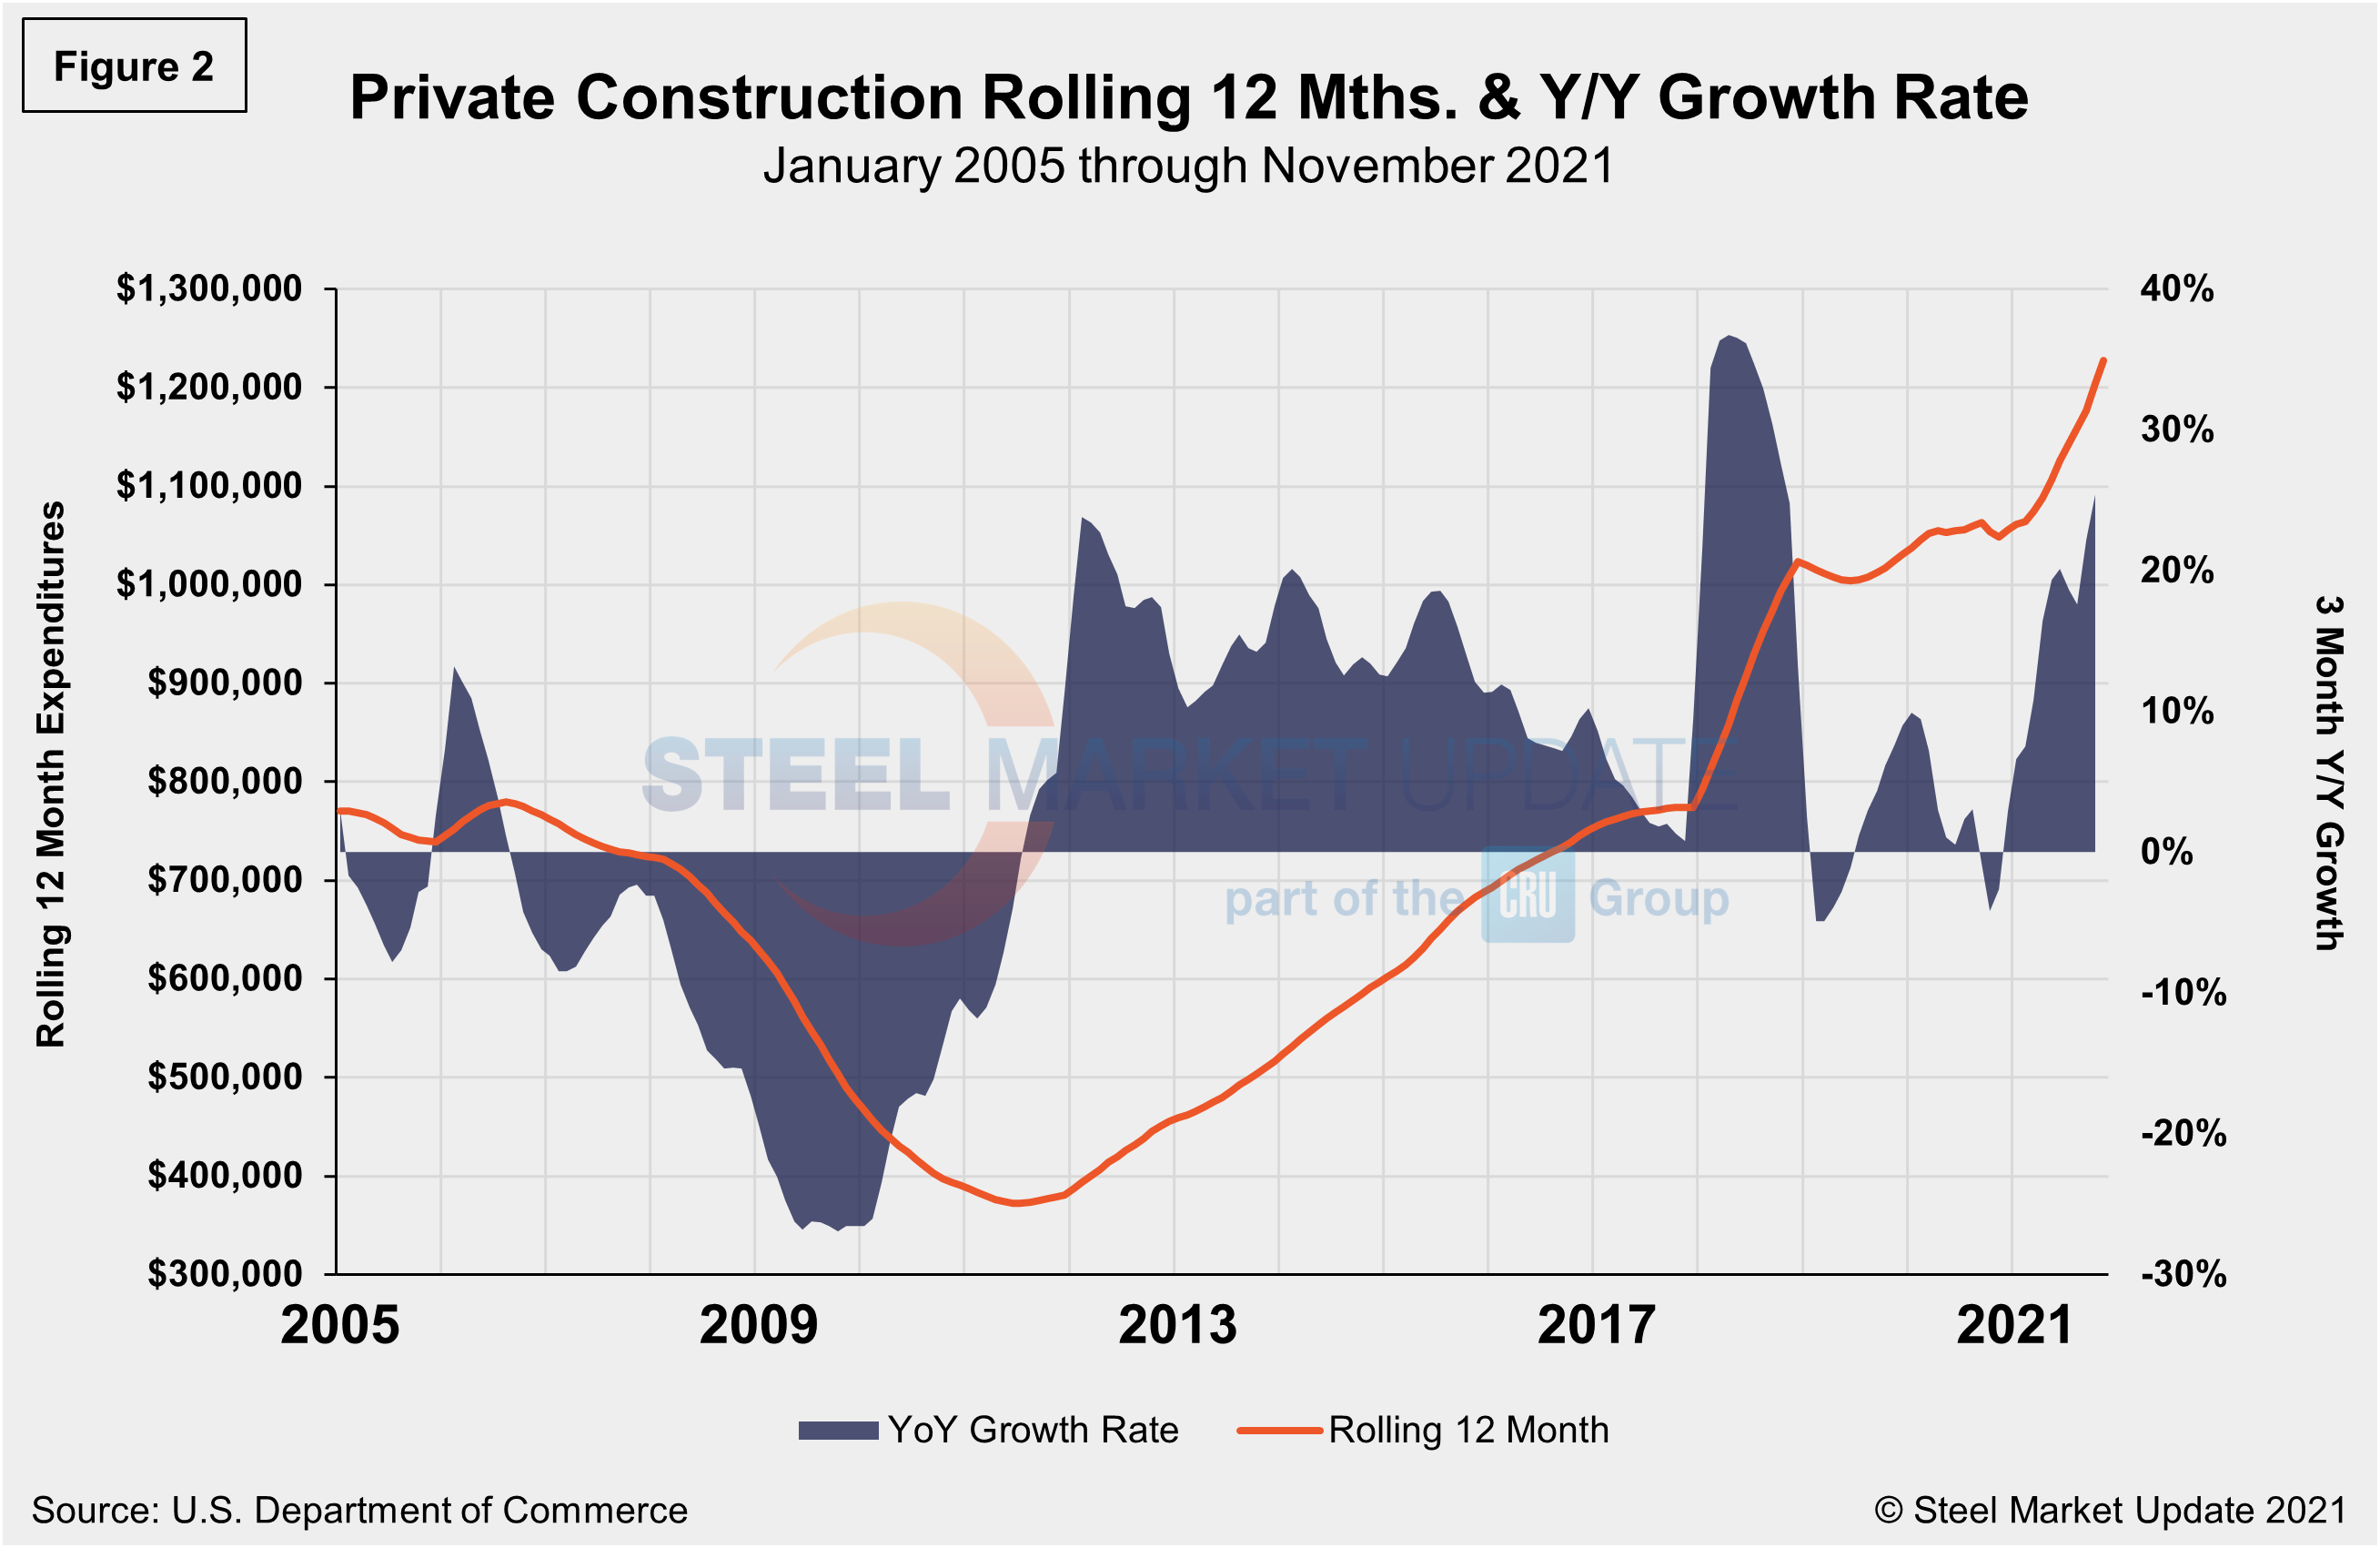
Private Construction
The breakdown of private expenditures into residential and nonresidential and their subsectors are highlighted in the table below. Private construction spending increased 17.1% year over year to an annual rate of $1.274 trillion. Within that category, private residential construction spending rose 35.1% annually, while private nonresidential was expanded by just 0.6% compared the same period.
There were gains in both residential and nonresidential private construction. Spending on new single- and multifamily residential projects, along with additions and renovations to existing houses, increased 0.9% for the month and 16.3% from a year earlier. Weighed down by declines in home improvements and single-family homebuilding, residential investment contracted for two consecutive quarters in Q2 and Q3, with many speculating further contraction in the fourth quarter.
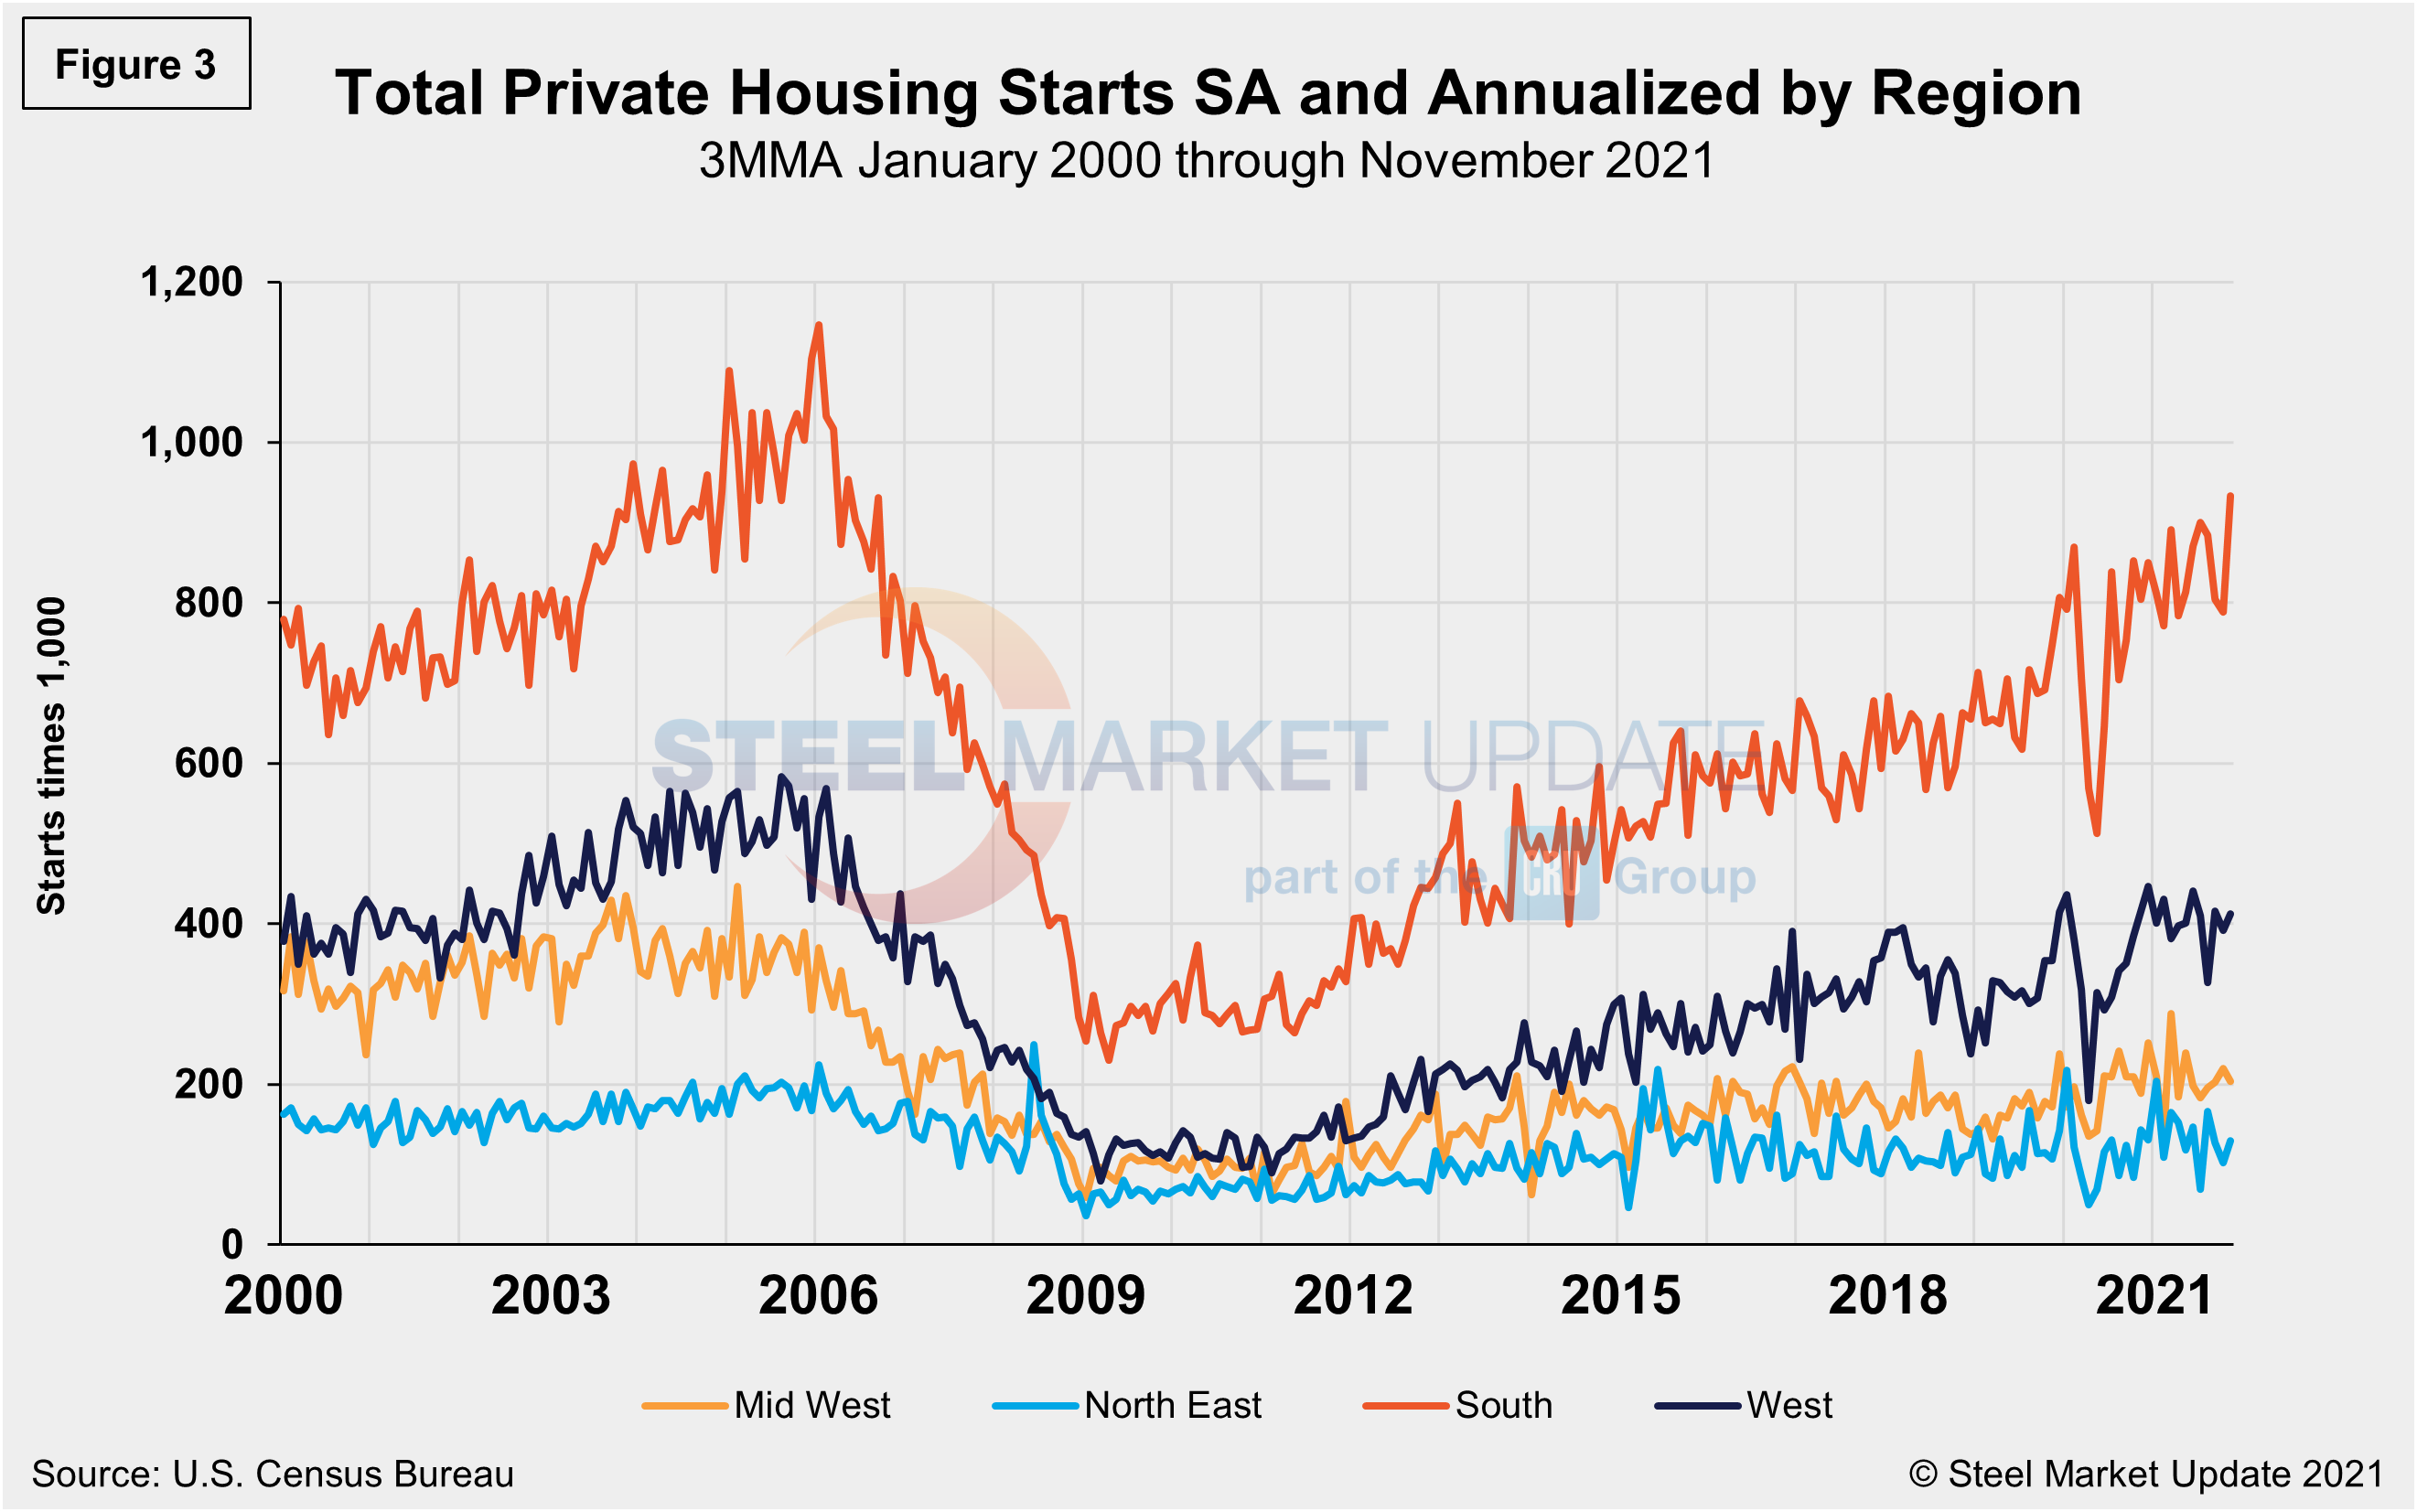
Total housing starts in the four regions are displayed below (Figure 3). Privately‐owned housing starts in November were at a seasonally adjusted annual rate of 1.679 million, up 11.8% from the revised October estimate of 1.502 million. The surge was driven by a single-family uptick at a rate of 1.173 million, up 11.3% from October’s revised figure of 1.054 million. Both single-family and multifamily properties saw a pickup in November despite labor and material shortages.
The South region continues to be the strongest for housing starts at 933,000 in November, besting the West—the second-place region—by more than double. The Northeast continued to trail the other three regions with just 130,000 starts in November. All four regions were directly impacted by the widespread COVID-19 shutdowns last year, causing housing starts to fall sharply. Since then, they have recovered to pre-pandemic levels, but have been widely inconsistent due to supply-side limitations and rising material costs.
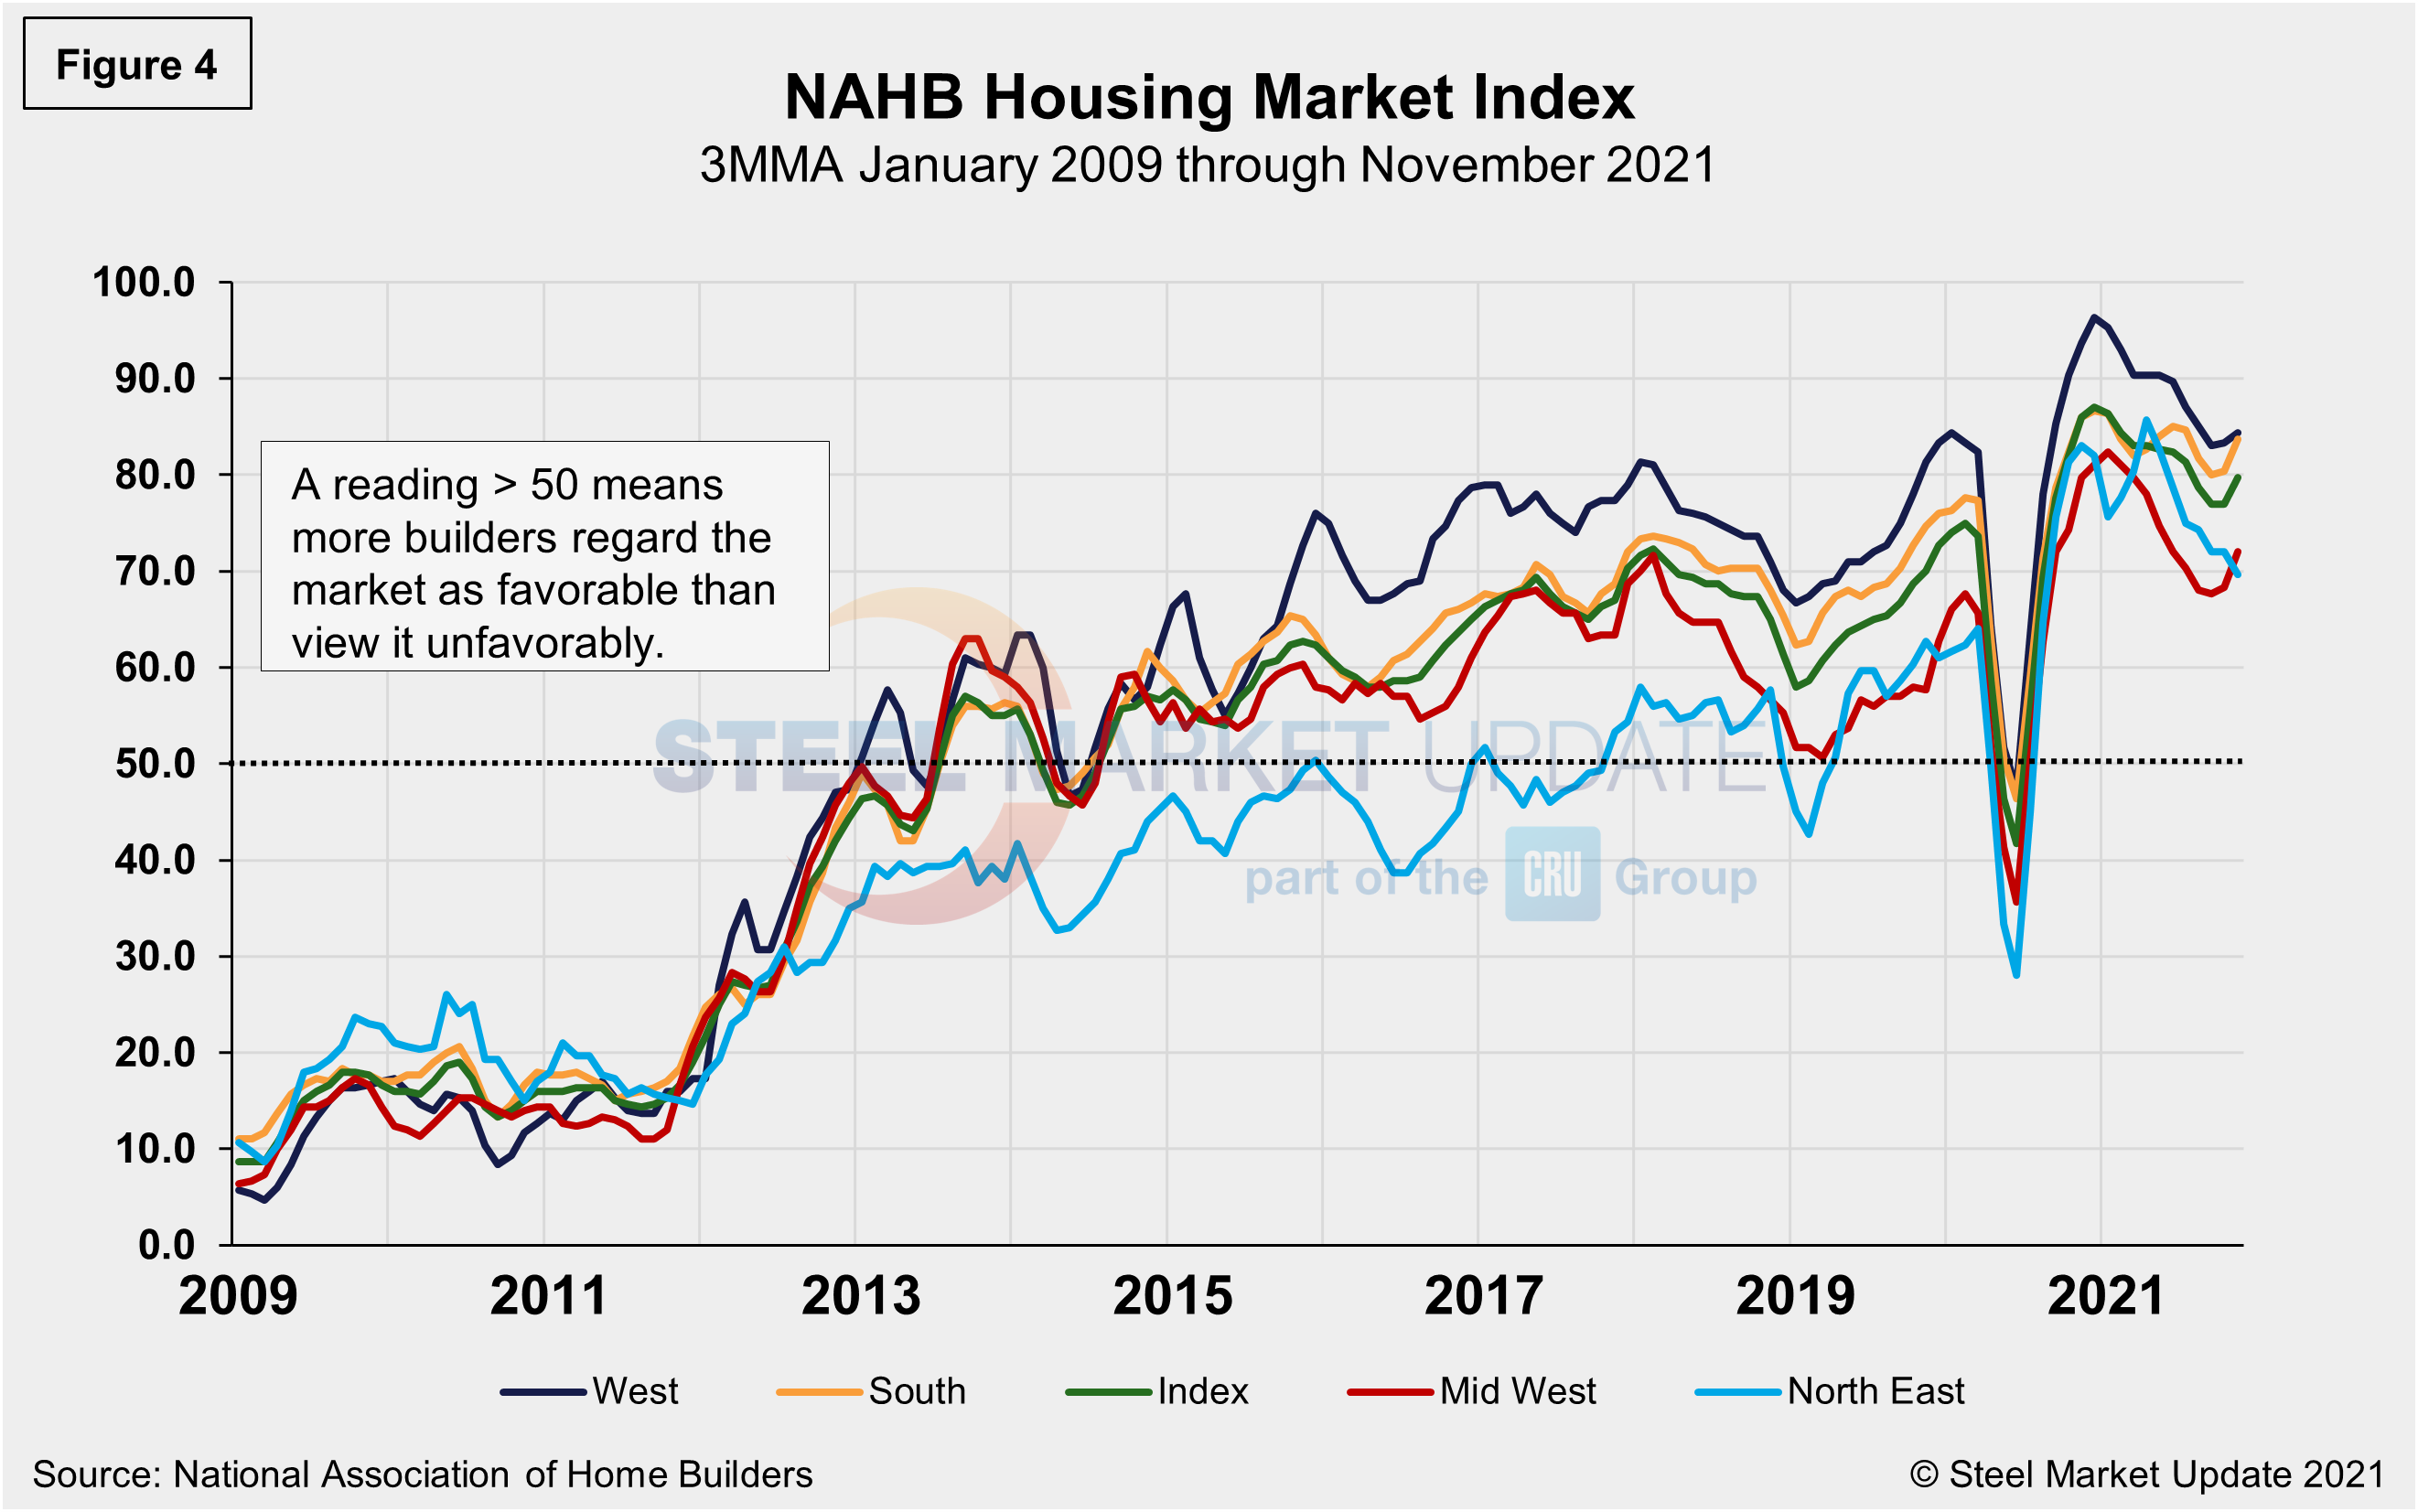
The National Association of Home Builders Optimism Index nearly crashed in April 2020 at the onset of COVID-19, but recovered well through December last year. Since the beginning of 2021, optimism among home builders has been tempered by the high costs of lumber and other building materials and the shortage of skilled labor. The index registered 83 in November, a positive move from 80 the month prior, and rising for the second straight month. Advance reports indicate that the index may rise further in December (Figure 4).
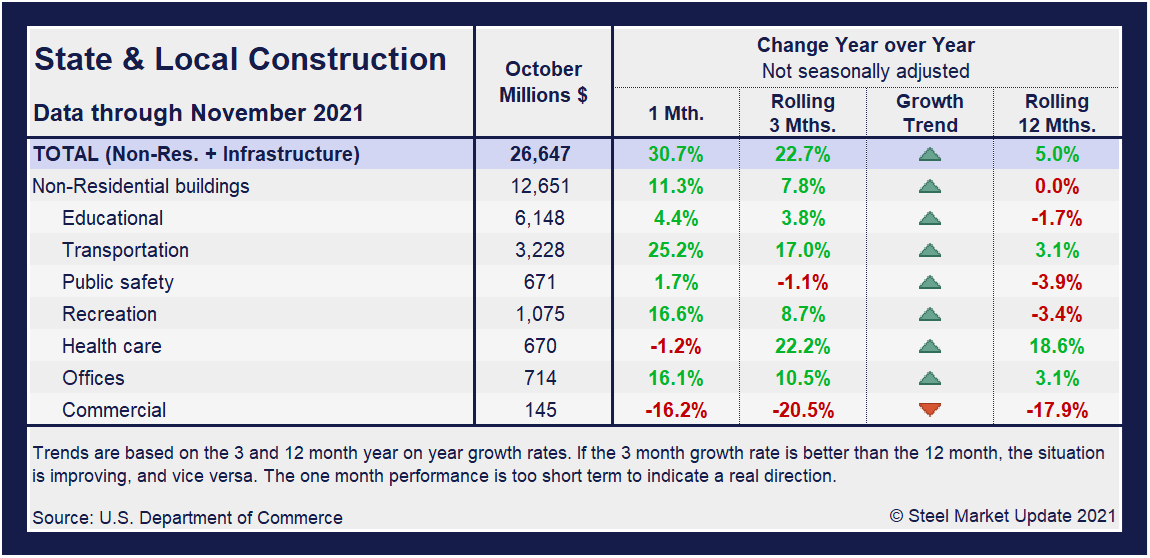
State and Local Construction
Spending on public construction projects slipped 0.2% in November to $352.3 billion after rising 1.6% in October. Outlays in private nonresidential spending were virtually unchanged in November on a monthly basis,
Combined private and public spending on electric power and oil and gas projects – the largest nonresidential segment – rose 0.1% for the month and 7.5% year-over-year. Among other large segments, commercial construction – comprising warehouse, retail, and farm structures – dipped 0.1% in November but jumped 15.1% year-over-year. Manufacturing construction increased for the 11th month in a row, by 0.9%, putting the total 22.4% above the year-earlier level.
The largest public categories posted mixed results. Highway and street construction slid 0.8% from October but rose 0.2% compared to November 2020. Educational construction climbed 0.3% for the month but declined 6.3% year-over-year. Transportation spending fell 0.5% in November but rose 0.7% from the year-earlier total.
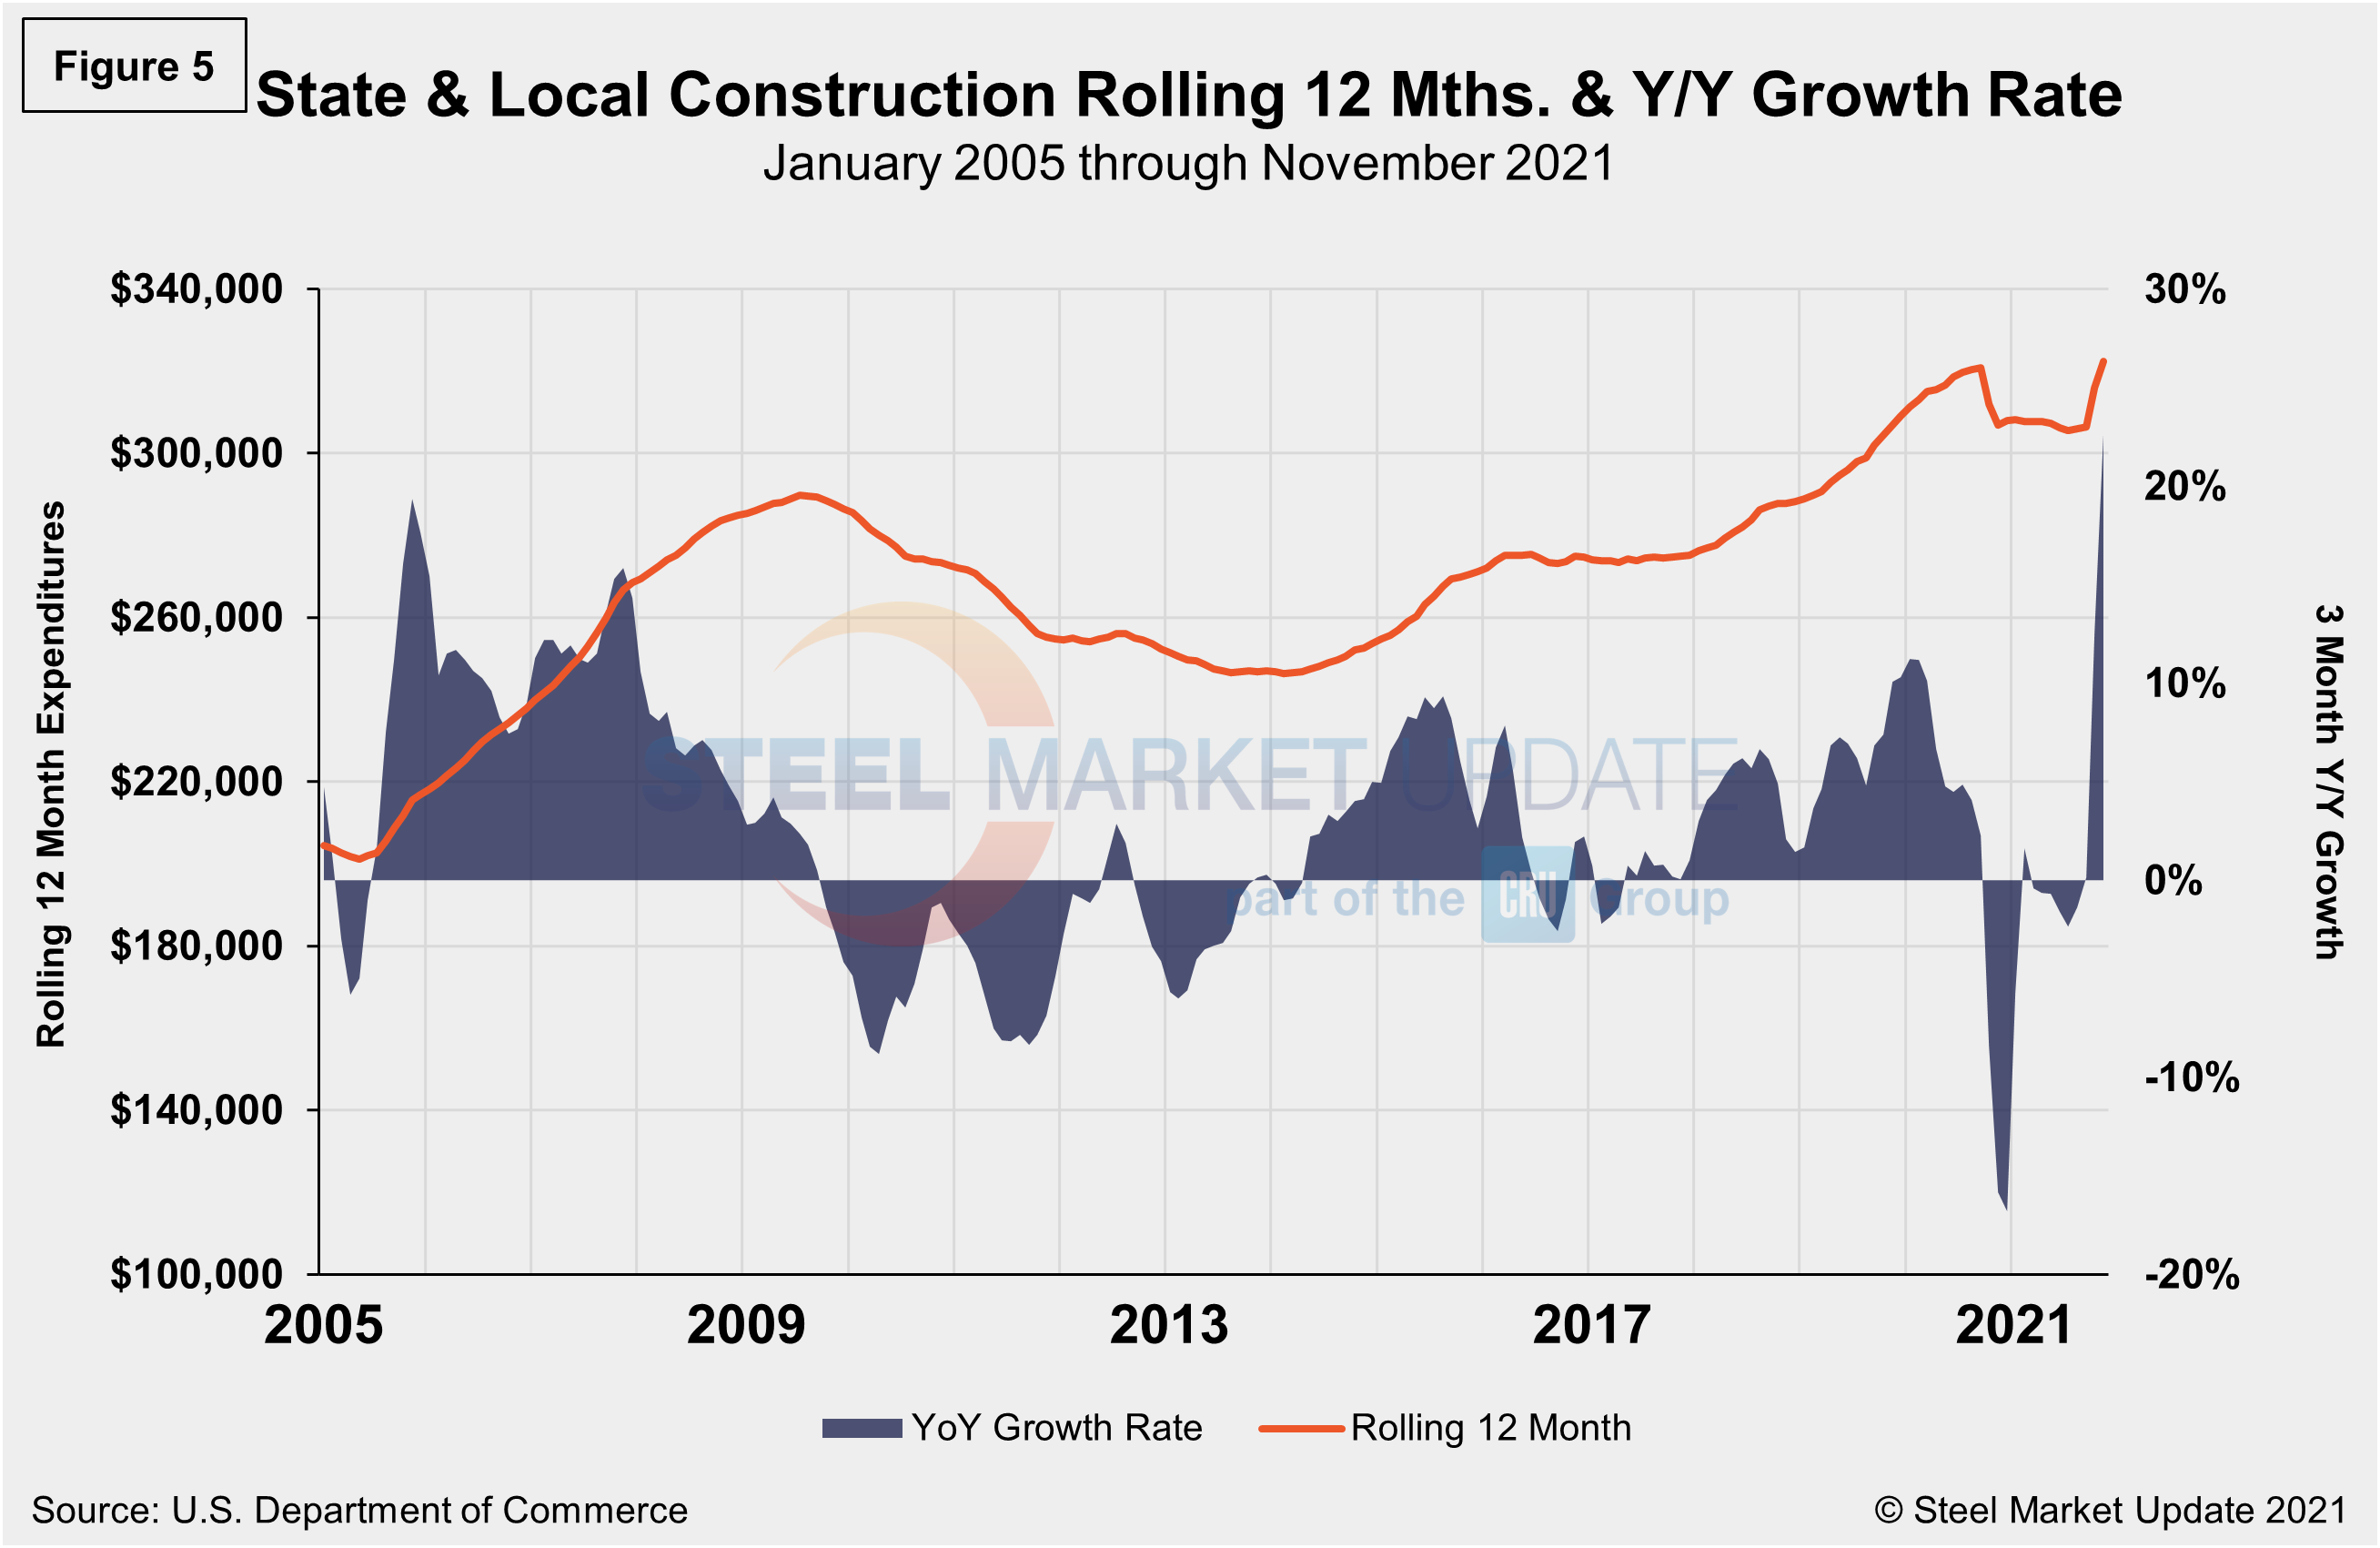
In three months through November, overall state and local construction was up 22.7%, a vast improvement from the month prior when the sector saw a boost of 12.3%. Education, public safety and recreation, though still lagging pre-pandemic levels, are the subcategories currently trending up. Figure 5 shows the history of total S&L expenditures.
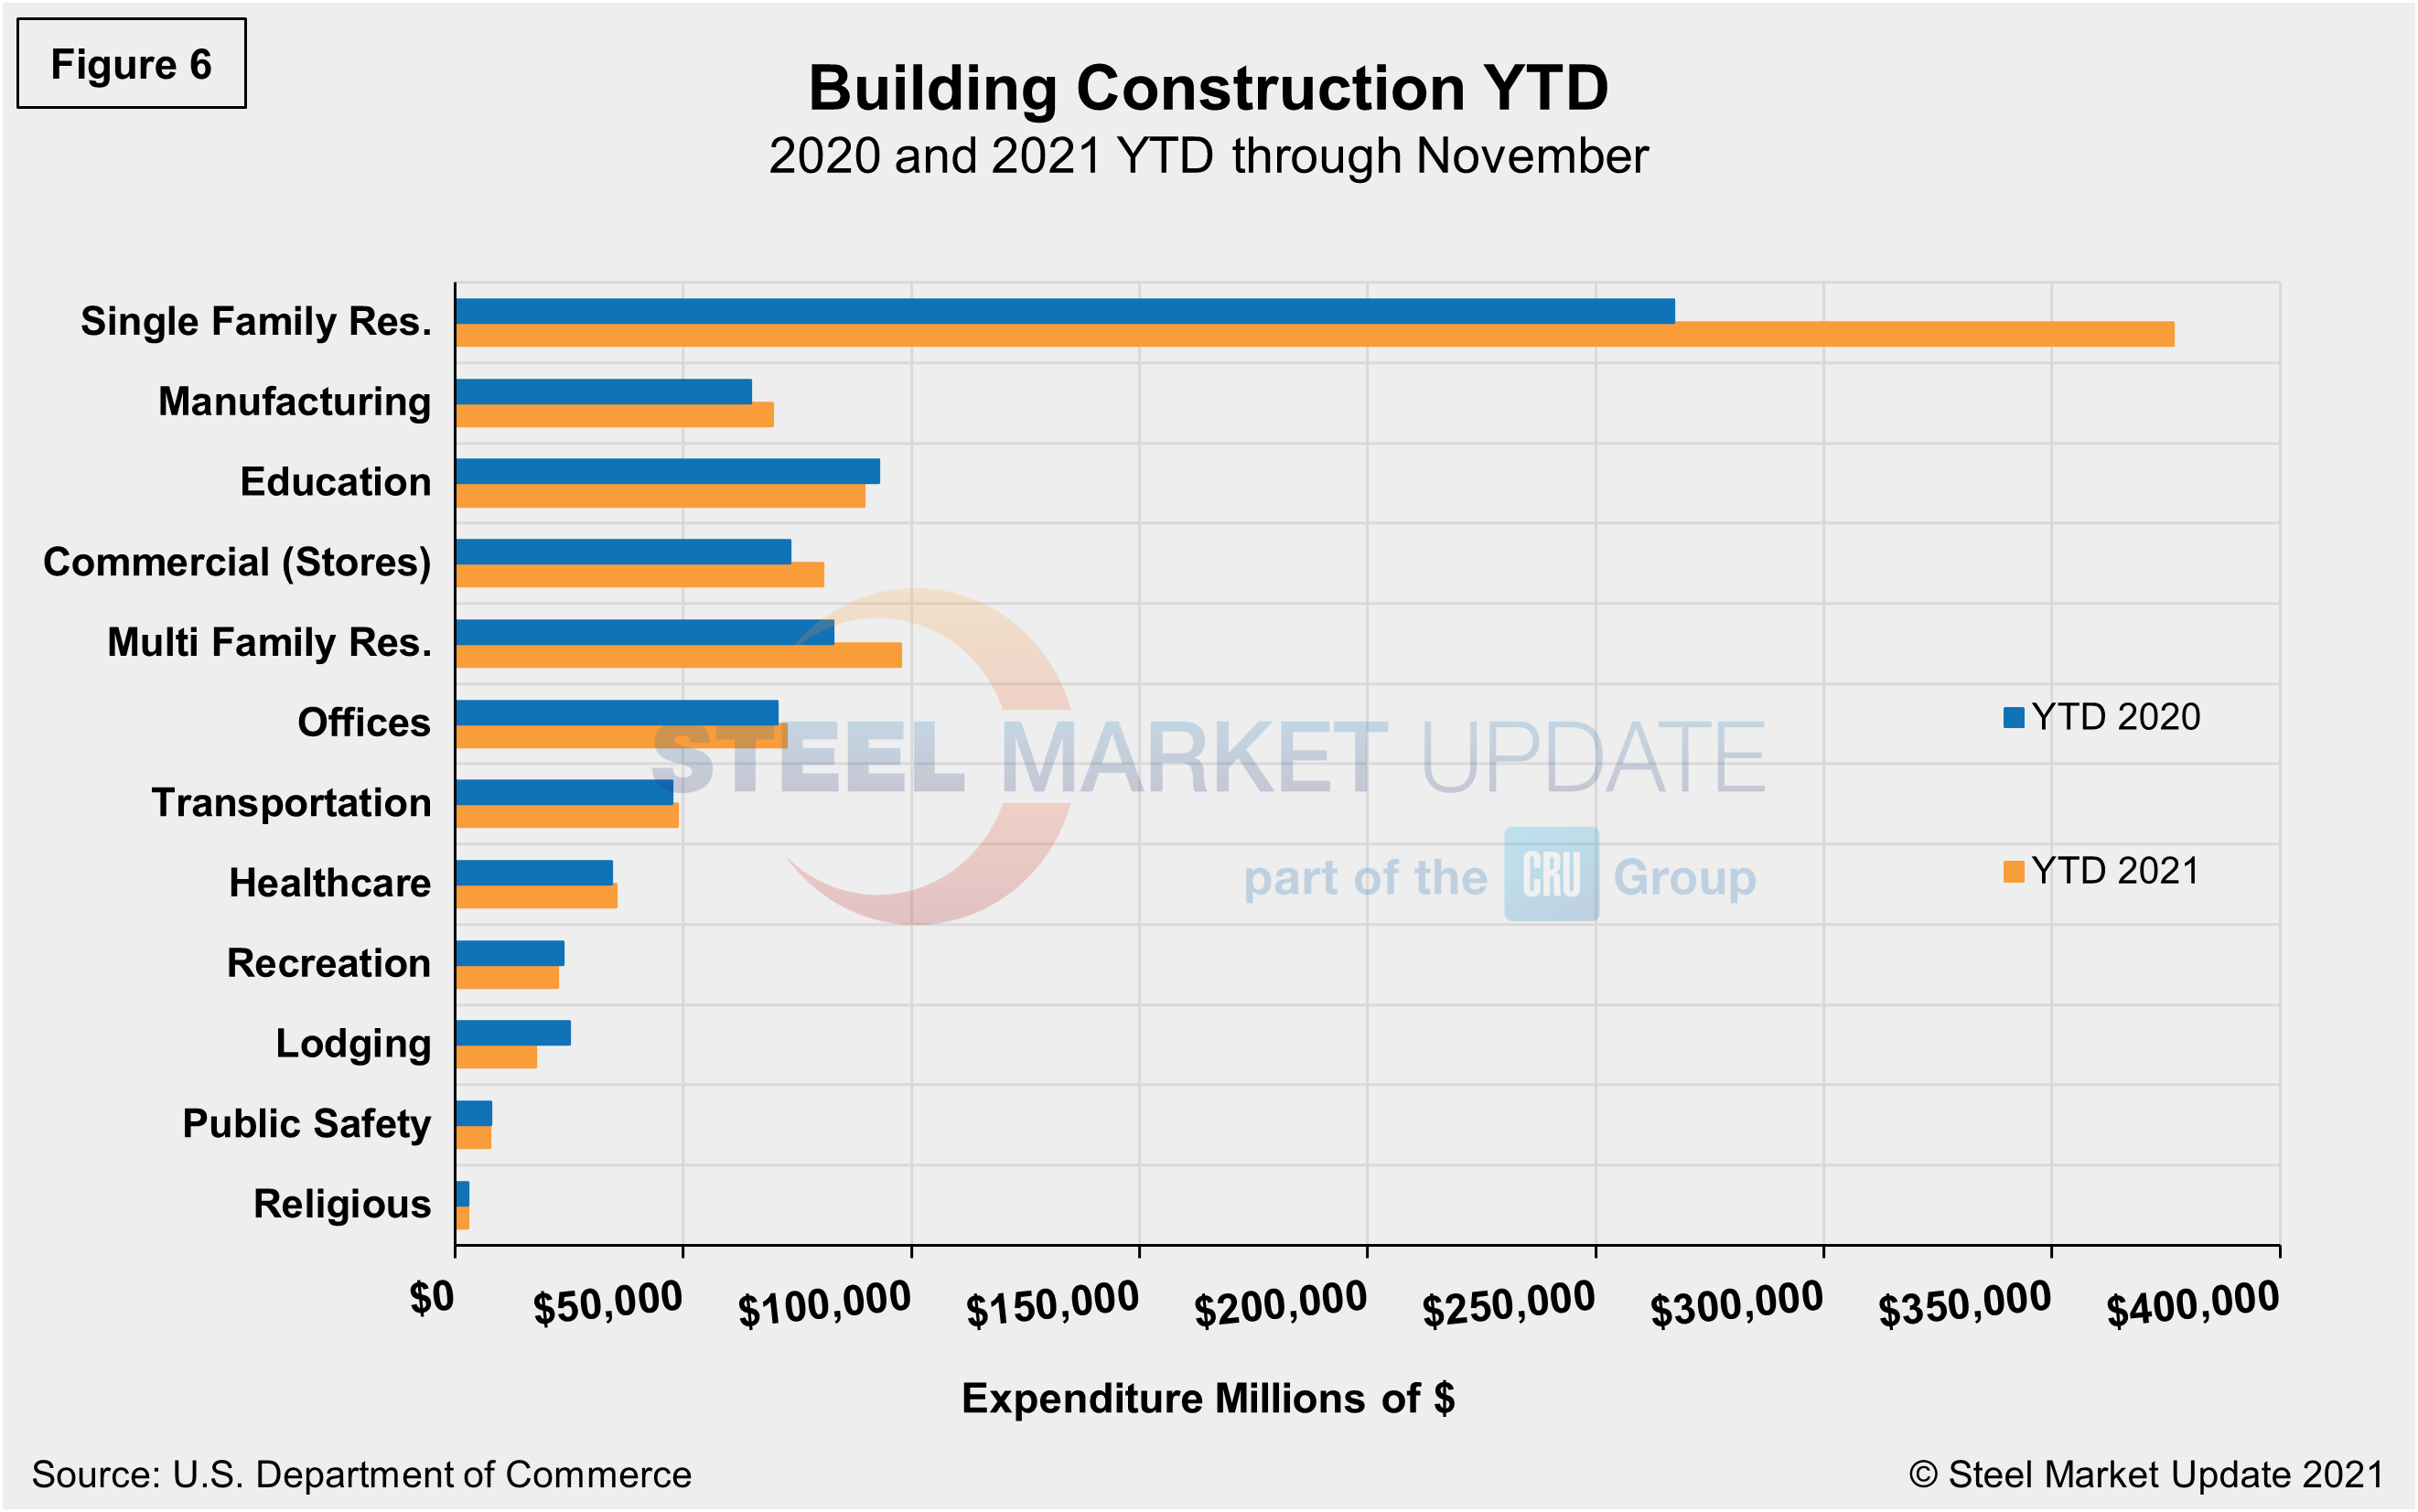
Year-to-date expenditures for construction of the various building sectors for 2020 and 2021 are compared in Figure 6. Single-family residential construction was dominant in 2020 with expenditures totaling an annualized $301.9 billion. To date, 2021 has been the same. Through November, expenditures for single-family construction were $376.7 billion, exceeding 2020’s total and 41.1% above year-ago levels when expenditures were $267.1 billion. Multifamily residential at 18.1%, commercial at 10.0%, and manufacturing at 7.2% are the subsectors experiencing the strongest year-to-date expansion compared to the same year-ago period. Lodging is behind by double digits at 29.2% year on year, followed by recreation and public safety, down 4.8% and 4.6%, respectively.
Explanation: Each month, the Commerce Department issues its Construction Put in Place (CPIP) data, usually on the first working day covering activity one month and one day earlier. There are three major categories based on funding source: private, state and local, and federal. Within these three groups are about 120 subcategories of construction projects. SMU analyzes the expenditures from the three funding categories to provide a concise summary of the steel-consuming sectors.
By David Schollaert, David@SteelMarketUpdate.com


