

Market Data

January 12, 2022
Employment by Industry: December Underperforms
Written by David Schollaert
The U.S. labor market disappointed once again, adding just 199,000 jobs in December, down from the 249,000 jobs added the month prior. Despite seeing the smallest gains in a year, the unemployment rate fell to 3.9%, from 4.2% in November. The latest data from the U.S. Bureau of Labor Statistics showed that the U.S. economy created far fewer jobs than expected in December, a trend seen over the past several months.
The December numbers cap a year defined by swings in a job market that has underperformed as it remains entangled with the pandemic nearly two years on. All told, data suggest that an absence of available workers – and not a lack of demand – may be part of the reason hiring has languished over the past few months.
November’s results came in at a slower rate than the 400,000 anticipated by experts. By industry, some of the services-related sectors hardest hit initially by the pandemic saw muted hiring at the end of December. Leisure and hospitality jobs rose by 53,000 in the last month of the year, higher compared to November’s gain of 41,000, but coming in well below the 211,000 seen in October.
Other industries saw a deceleration in hiring in December. Transportation and warehousing jobs rose by just under 19,000 during the month after a rise of more than 42,000 in November, while professional and business services positions rose by 43,000 after a gain of 72,000 during the prior month. Education and health services employment gains totaled 10,000, slowing from 14,000 in the prior period. Meanwhile, retail trade employers shed jobs for a back-to-back month.
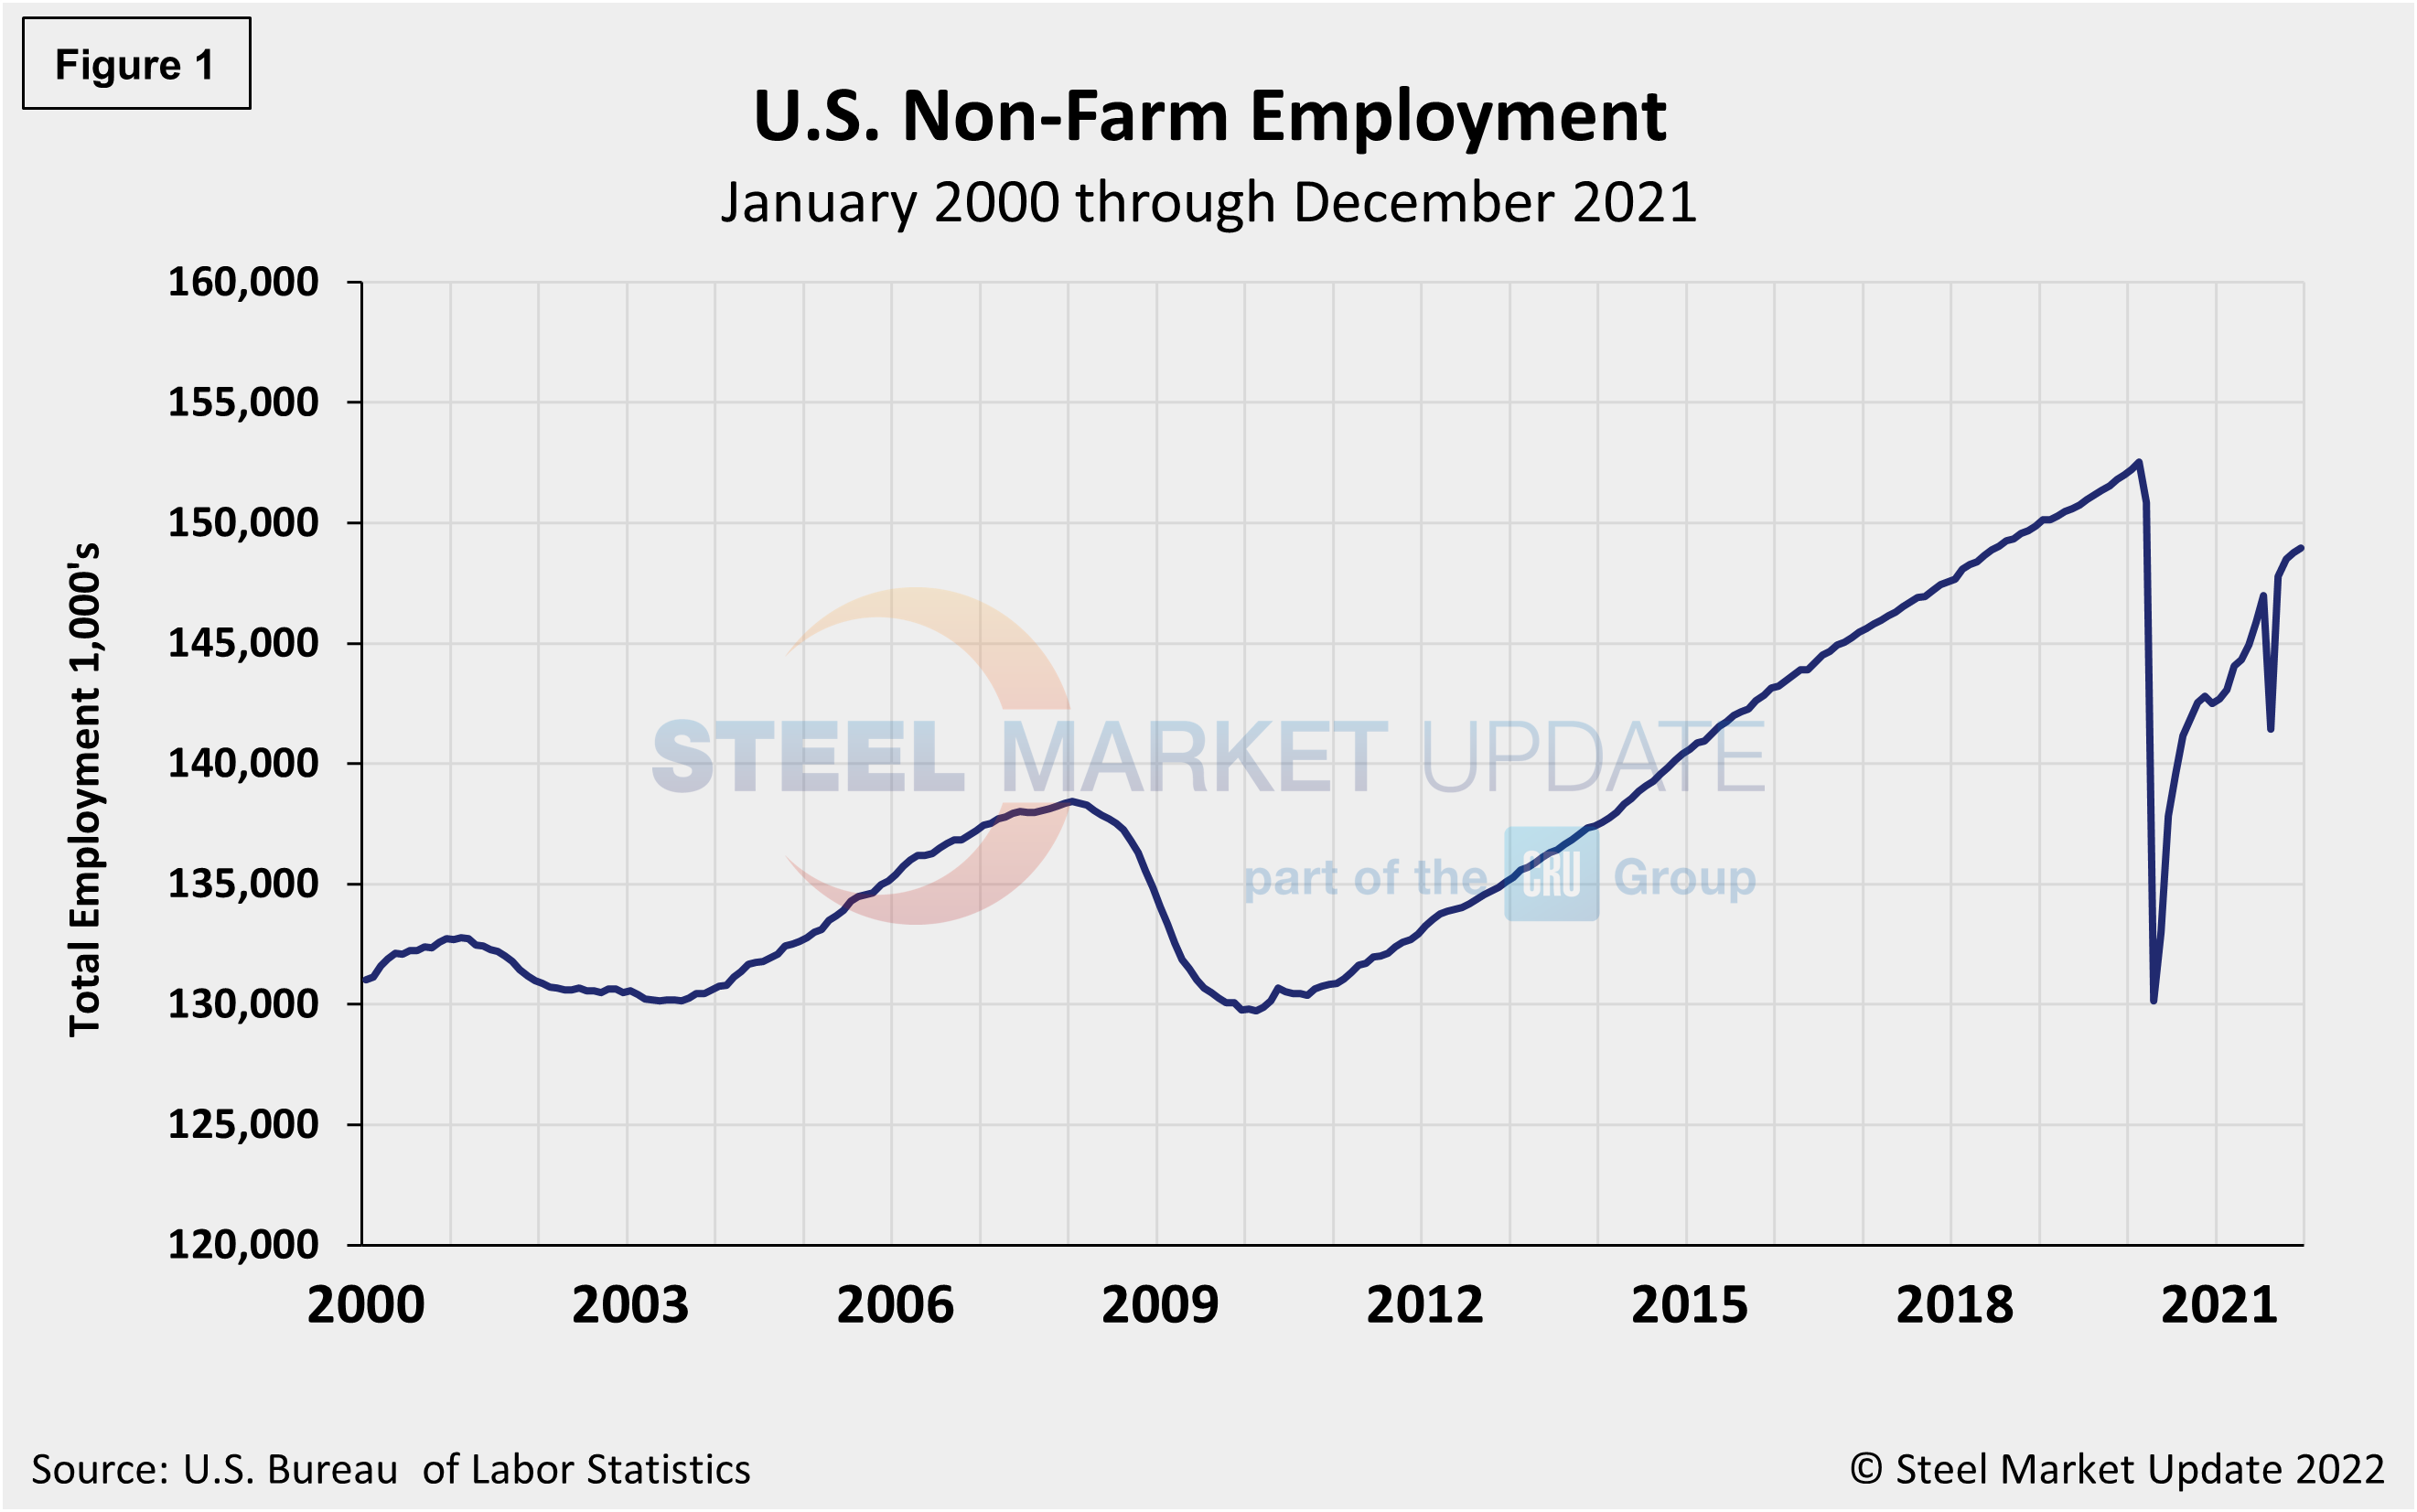
In total, the number of unemployed persons fell by 483,000 to 6.3 million last month. Figure 1 shows the total number of people employed in the nonfarm economy.
Designed on rolling time periods of 1 month, 3 months, 1 year and 2 years, the table below breaks total employment into service industries and goods-producing industries, and then into private and government employees. Most of the goods-producing employees work in manufacturing and construction. Comparing service and goods-producing industries in December shows service jobs have increased by just 0.1%, while goods-producing jobs rose by 0.3% from November’s result. Despite steady month-on-month gains, both industries remain behind pre-pandemic levels. Note, the subcomponents of both manufacturing and construction shown in this table don’t add up to the total because we have only included those with the most relevance to the steel industry.
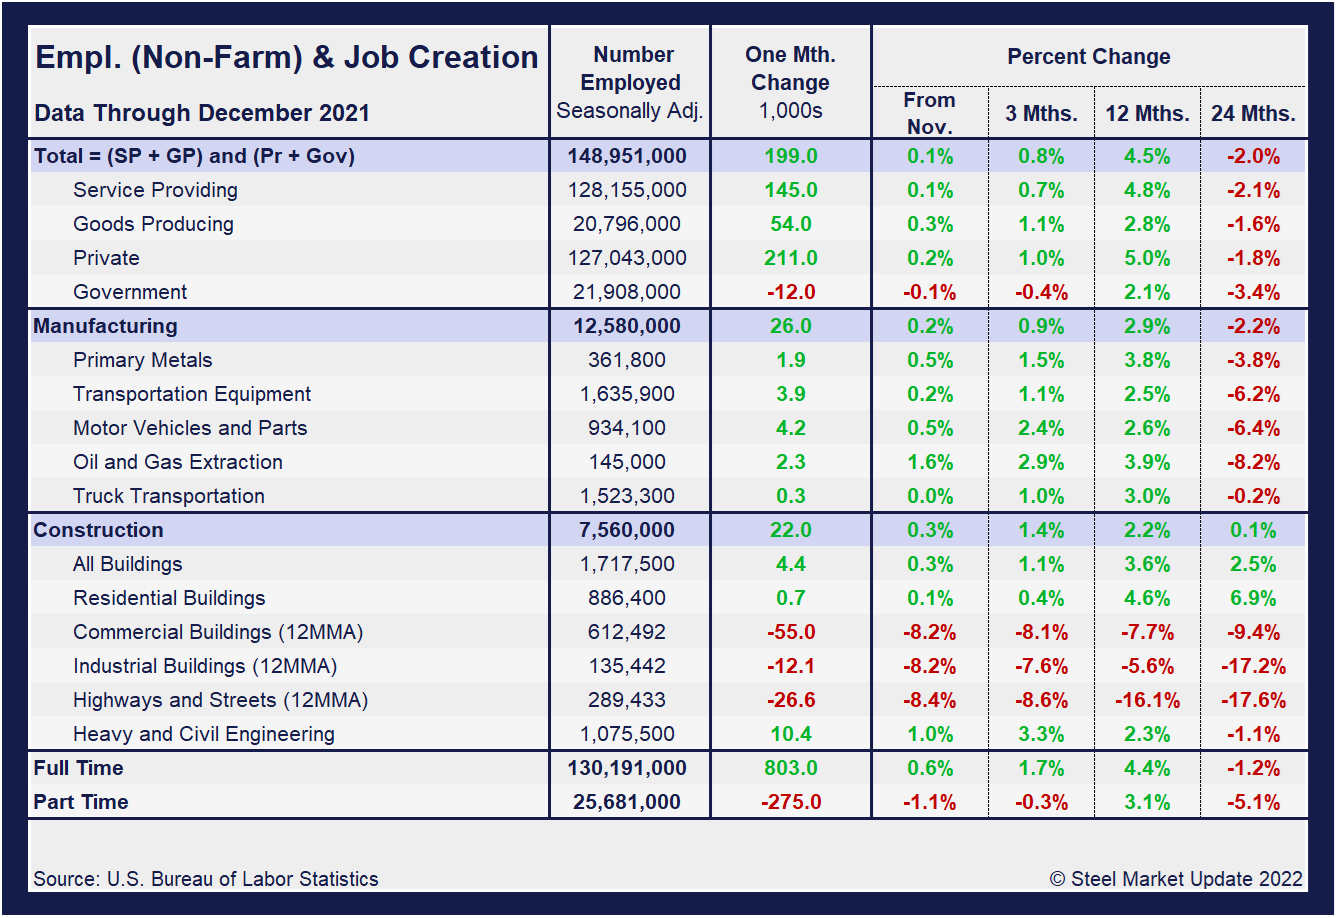
Comparing December to November, manufacturing employment was up 0.2%, matching the same gain seen the month prior. Construction was up 0.3% month on month compared to a 0.4% increase in November. The construction sector has been driven by the residential market, a 4.6% increase year on year. Gains have been held back, however, by struggling commercial and industrial building. Despite the overall improvement, the inconsistencies in some of the subcomponents reflect the obstacles still facing the U.S. economy and domestic job creation. The three-month and 12-month comparisons show a good recovery, but still lag the 24-month pre-pandemic comparisons In the year-over-year contrast, manufacturing is up 2.9% and construction is up 2.2%. Further growth is still expected as the marketplace advances from the freefall seen in the second quarter of 2020.
Manufacturing employment increased by just 26,000 jobs in December, behind increases of 31,000 and 60,000 jobs in November and October, respectively. December was led by gains of 8,000 in machinery – reflecting the return of workers from a strike. Manufacturing employment is down by 219,000 since February 2020.
In December, construction employment rose by 22,000, trending down following increases of 31,000 jobs the month prior and 44,000 new jobs in October. During the month, nonresidential specialty trade contractors added 13,000 to their payrolls, and in heavy and civil engineering construction, 10,000 new jobs were added. Construction employment is 88,000 below its February 2020 level.
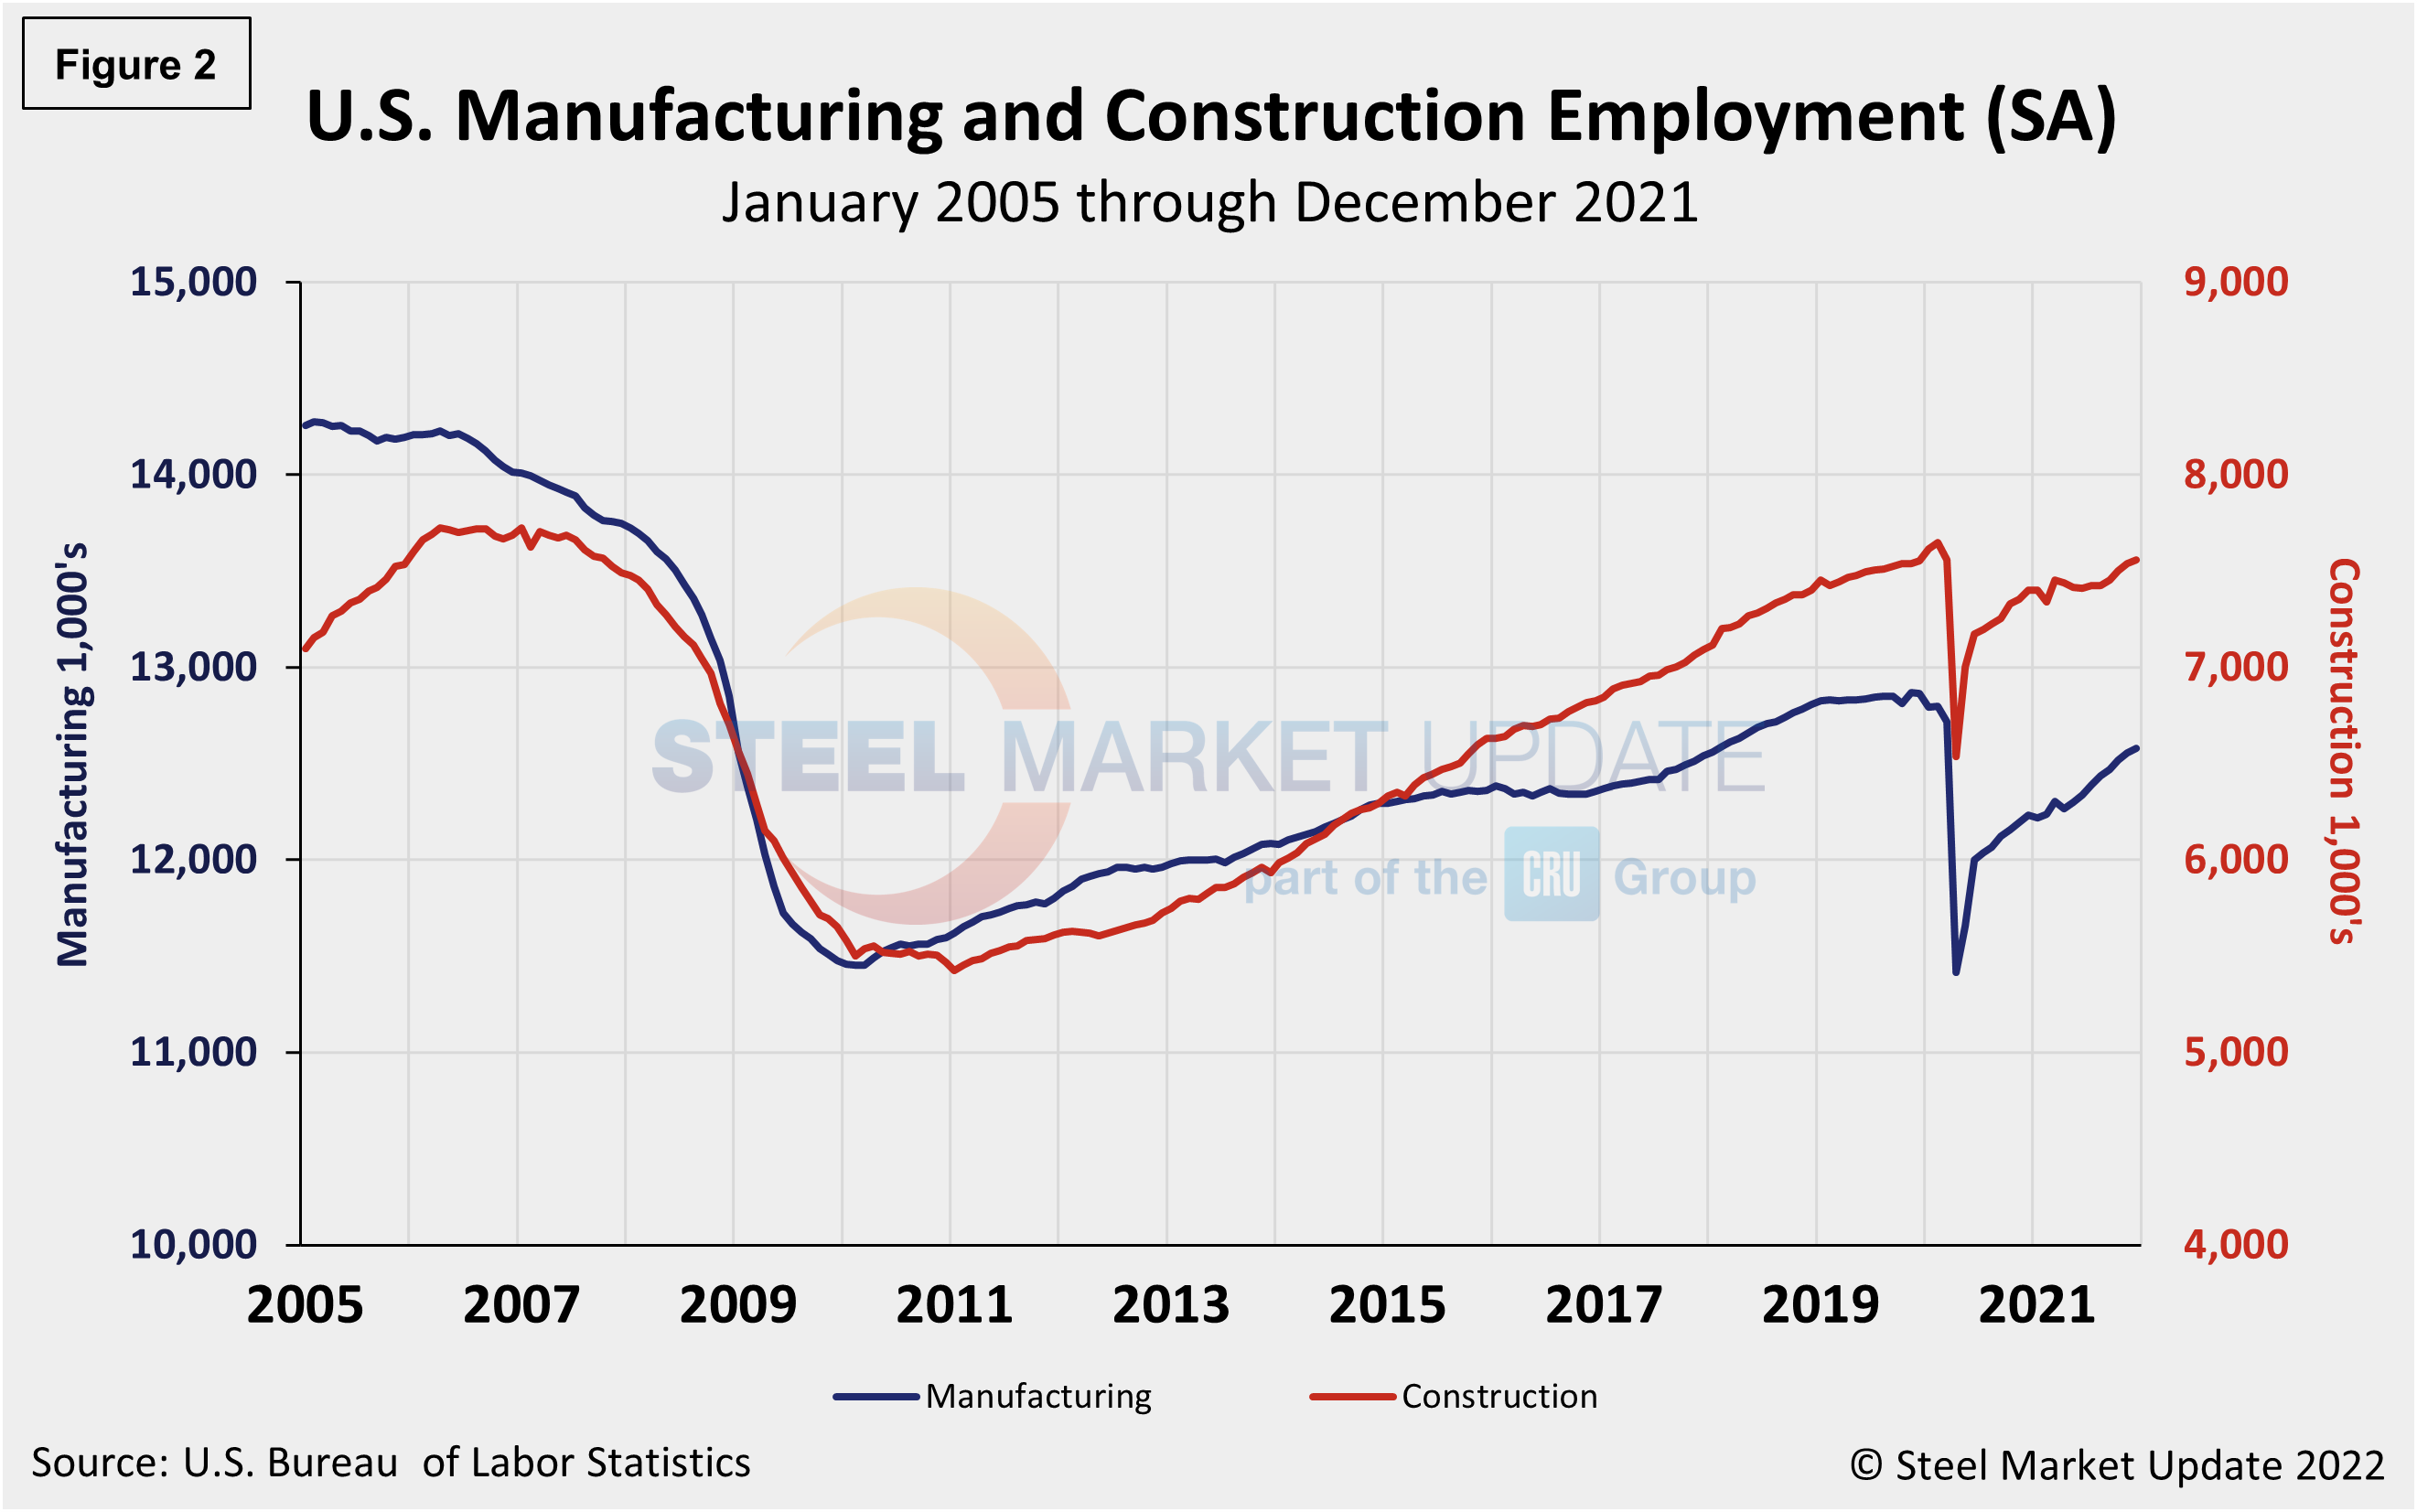
The history of employment in manufacturing and construction since January 2005 is show below in Figure 2, seasonally adjusted.
According to human resources consulting firm Challenger, Gray and Christmas, Inc., companies in the Health Care/Products sector announced the most job cuts in December with 4,550, for a total of 31,997 for the year, down 49.7% from the 63,576 cuts recorded in 2020.
Aerospace/Defense companies have announced the most cuts this year with 34,627, 59.8% lower than the 86,125 announced through 2020.
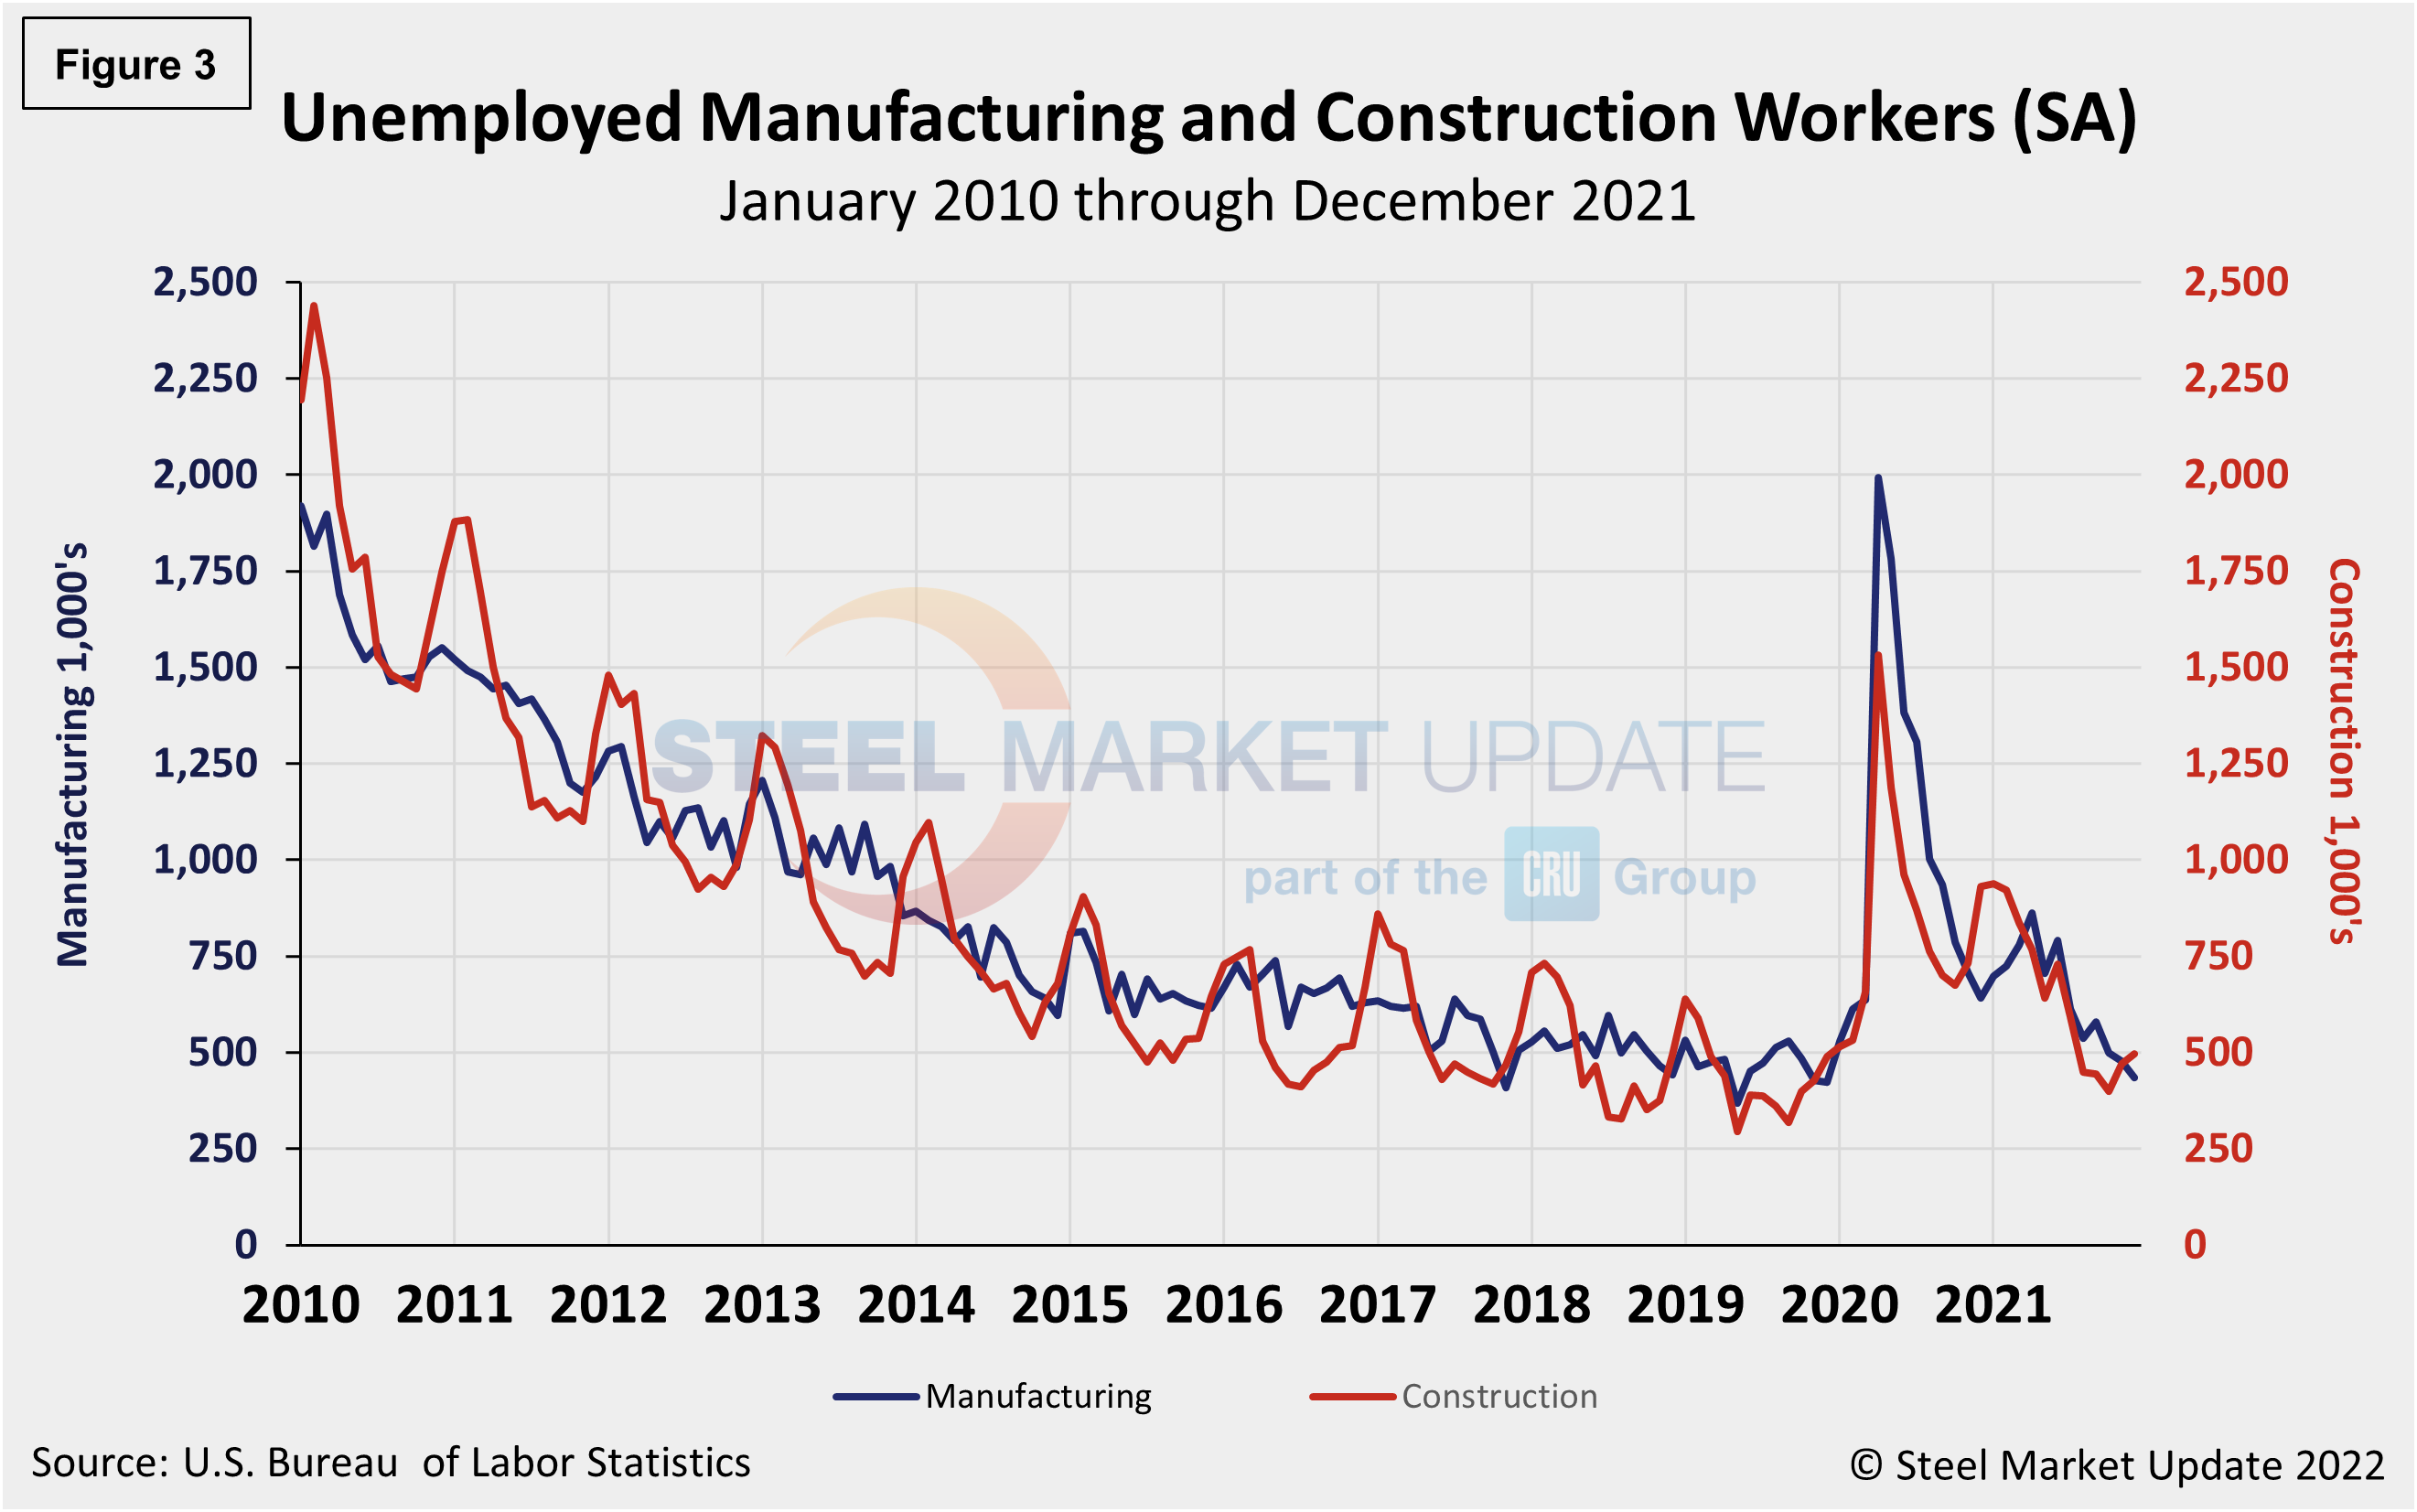
The reported number of unemployed manufacturing and construction workers is shown in Figure 3. Construction and manufacturing unemployment continued to diverge in December. Construction unemployment was up 6.0% month on month, from 469,000 in November to 497,000 in December. Manufacturing’s unemployed fell from 478,000 in November to 435,000 in December, a 9.0% decline month on month. Both sectors have been heavily impacted by supply-chain disruptions and labor force constraints.
Explanation: On the first or second Friday of each month, the Bureau of Labor Statistics releases the employment data for the previous month. Data is available at www.bls.gov. The BLS employment database is a reality check for other economic data streams such as manufacturing and construction. It is easy to drill down into the BLS database to obtain employment data for many subsectors of the economy. The important point about all these data streams is not necessarily the nominal numbers, but the direction in which they are headed.
By David Schollaert, David@SteelMarketUpdate.com


