

Market Data

January 12, 2022
U.S. Job Creation: December Labor Market Disappoints Again
Written by David Schollaert
U.S. job growth was weaker than expected in December, well below estimates for the fourth time in the past five months. November payrolls rose by 199,000, well below the 400,000 anticipated by economists and underperforming for the second straight month.
Despite the big hiring miss, the unemployment rate fell again to 3.9%, a 0.3 percentage point decline in spite of rising labor force participation, the Labor Department reported.
Job creation was highest in leisure and hospitality, a key recovery sector, which added 53,000. Professional and business services contributed 43,000, while manufacturing added 26,000, according to the Bureau of Labor Statistics (BLS).
In the goods-producing sector, both construction and manufacturing employment growth also slowed compared to November. Manufacturing job gains alone came in at 26,000, missing consensus estimates of 35,000.
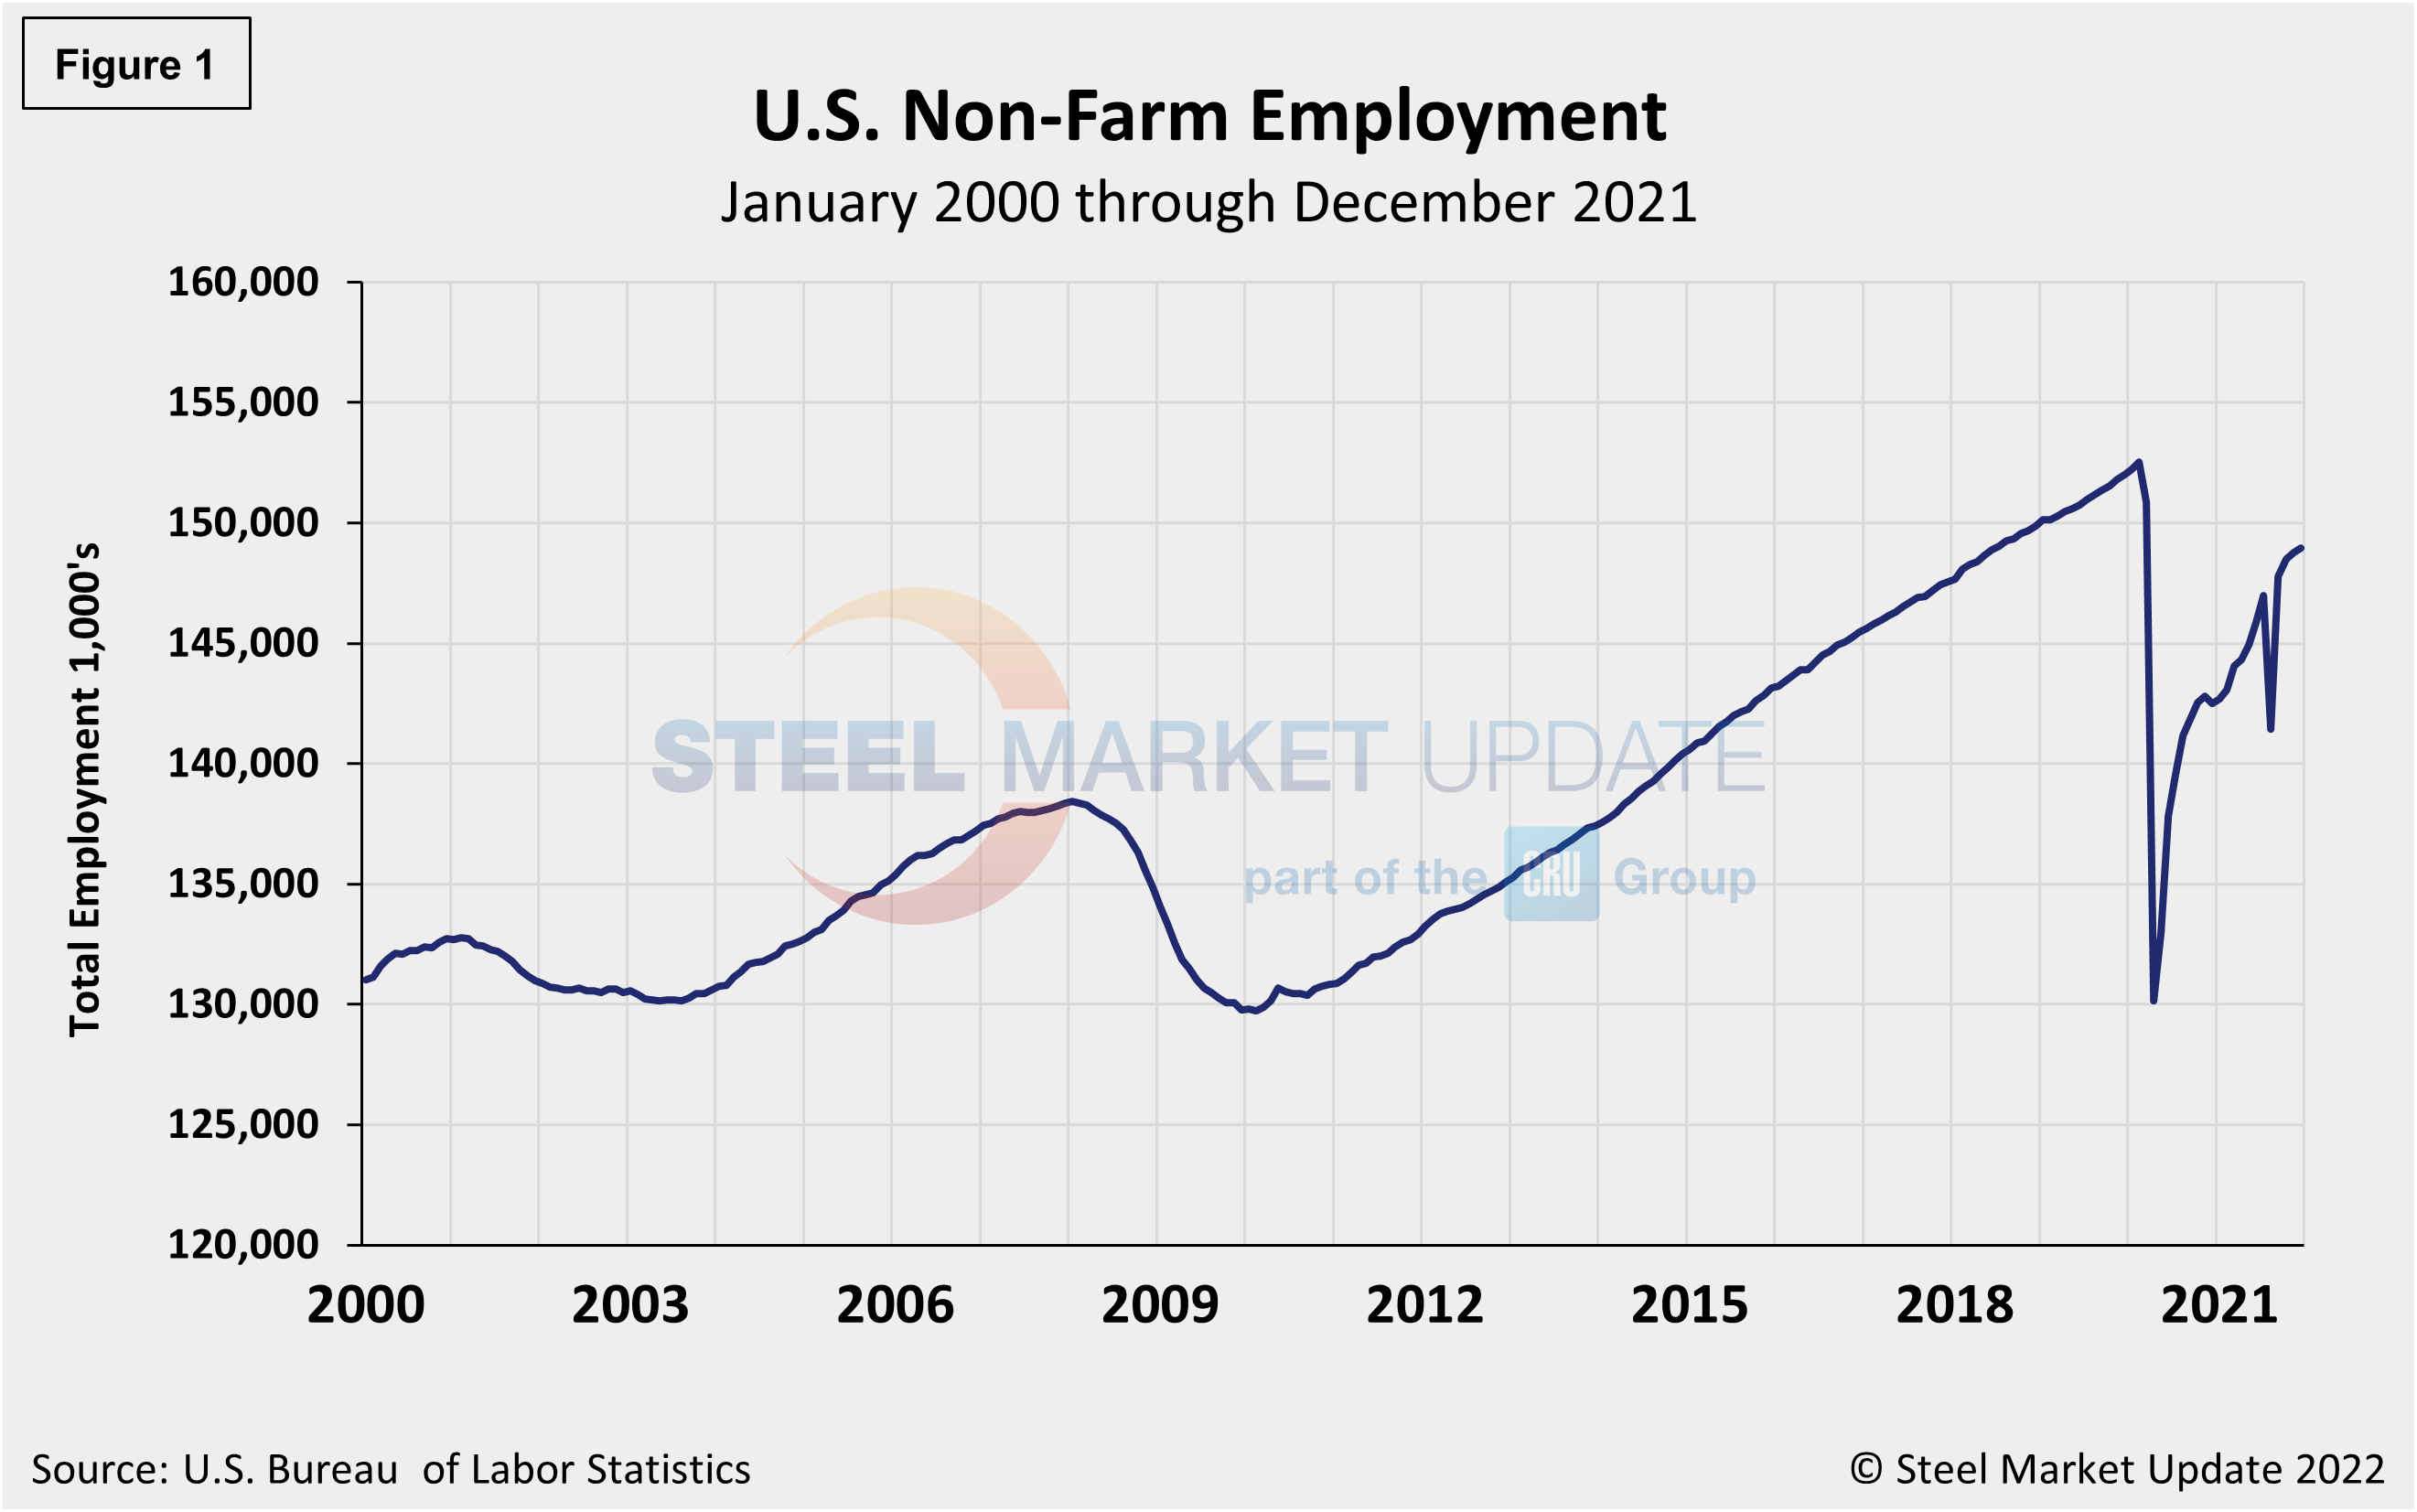
But despite the disappointment on headline payrolls, other metrics within the report were as strong or stronger than economists were anticipating. The unemployment rate improved more than expected to 3.9%, or the best level since February 2020’s 50-year low of 3.5% just prior to the pandemic. The labor force participation rate was upwardly revised by a tick to 61.9% for November and held at this level in December. The size of the civilian labor force remained lower by more than 2 million compared to pre-pandemic levels, however. Figure 1 shows the total number of nonfarm workers employed in the U.S. since 2000.
The number of long-term unemployed (out-of-work for at least 27 consecutive weeks) declined by 185,000 in December to 2.0 million. This measure is down from 4.0 million a year earlier, but is 887,000 higher than in February 2020. The long-term unemployed accounted for 31.7% of the total unemployed in December.
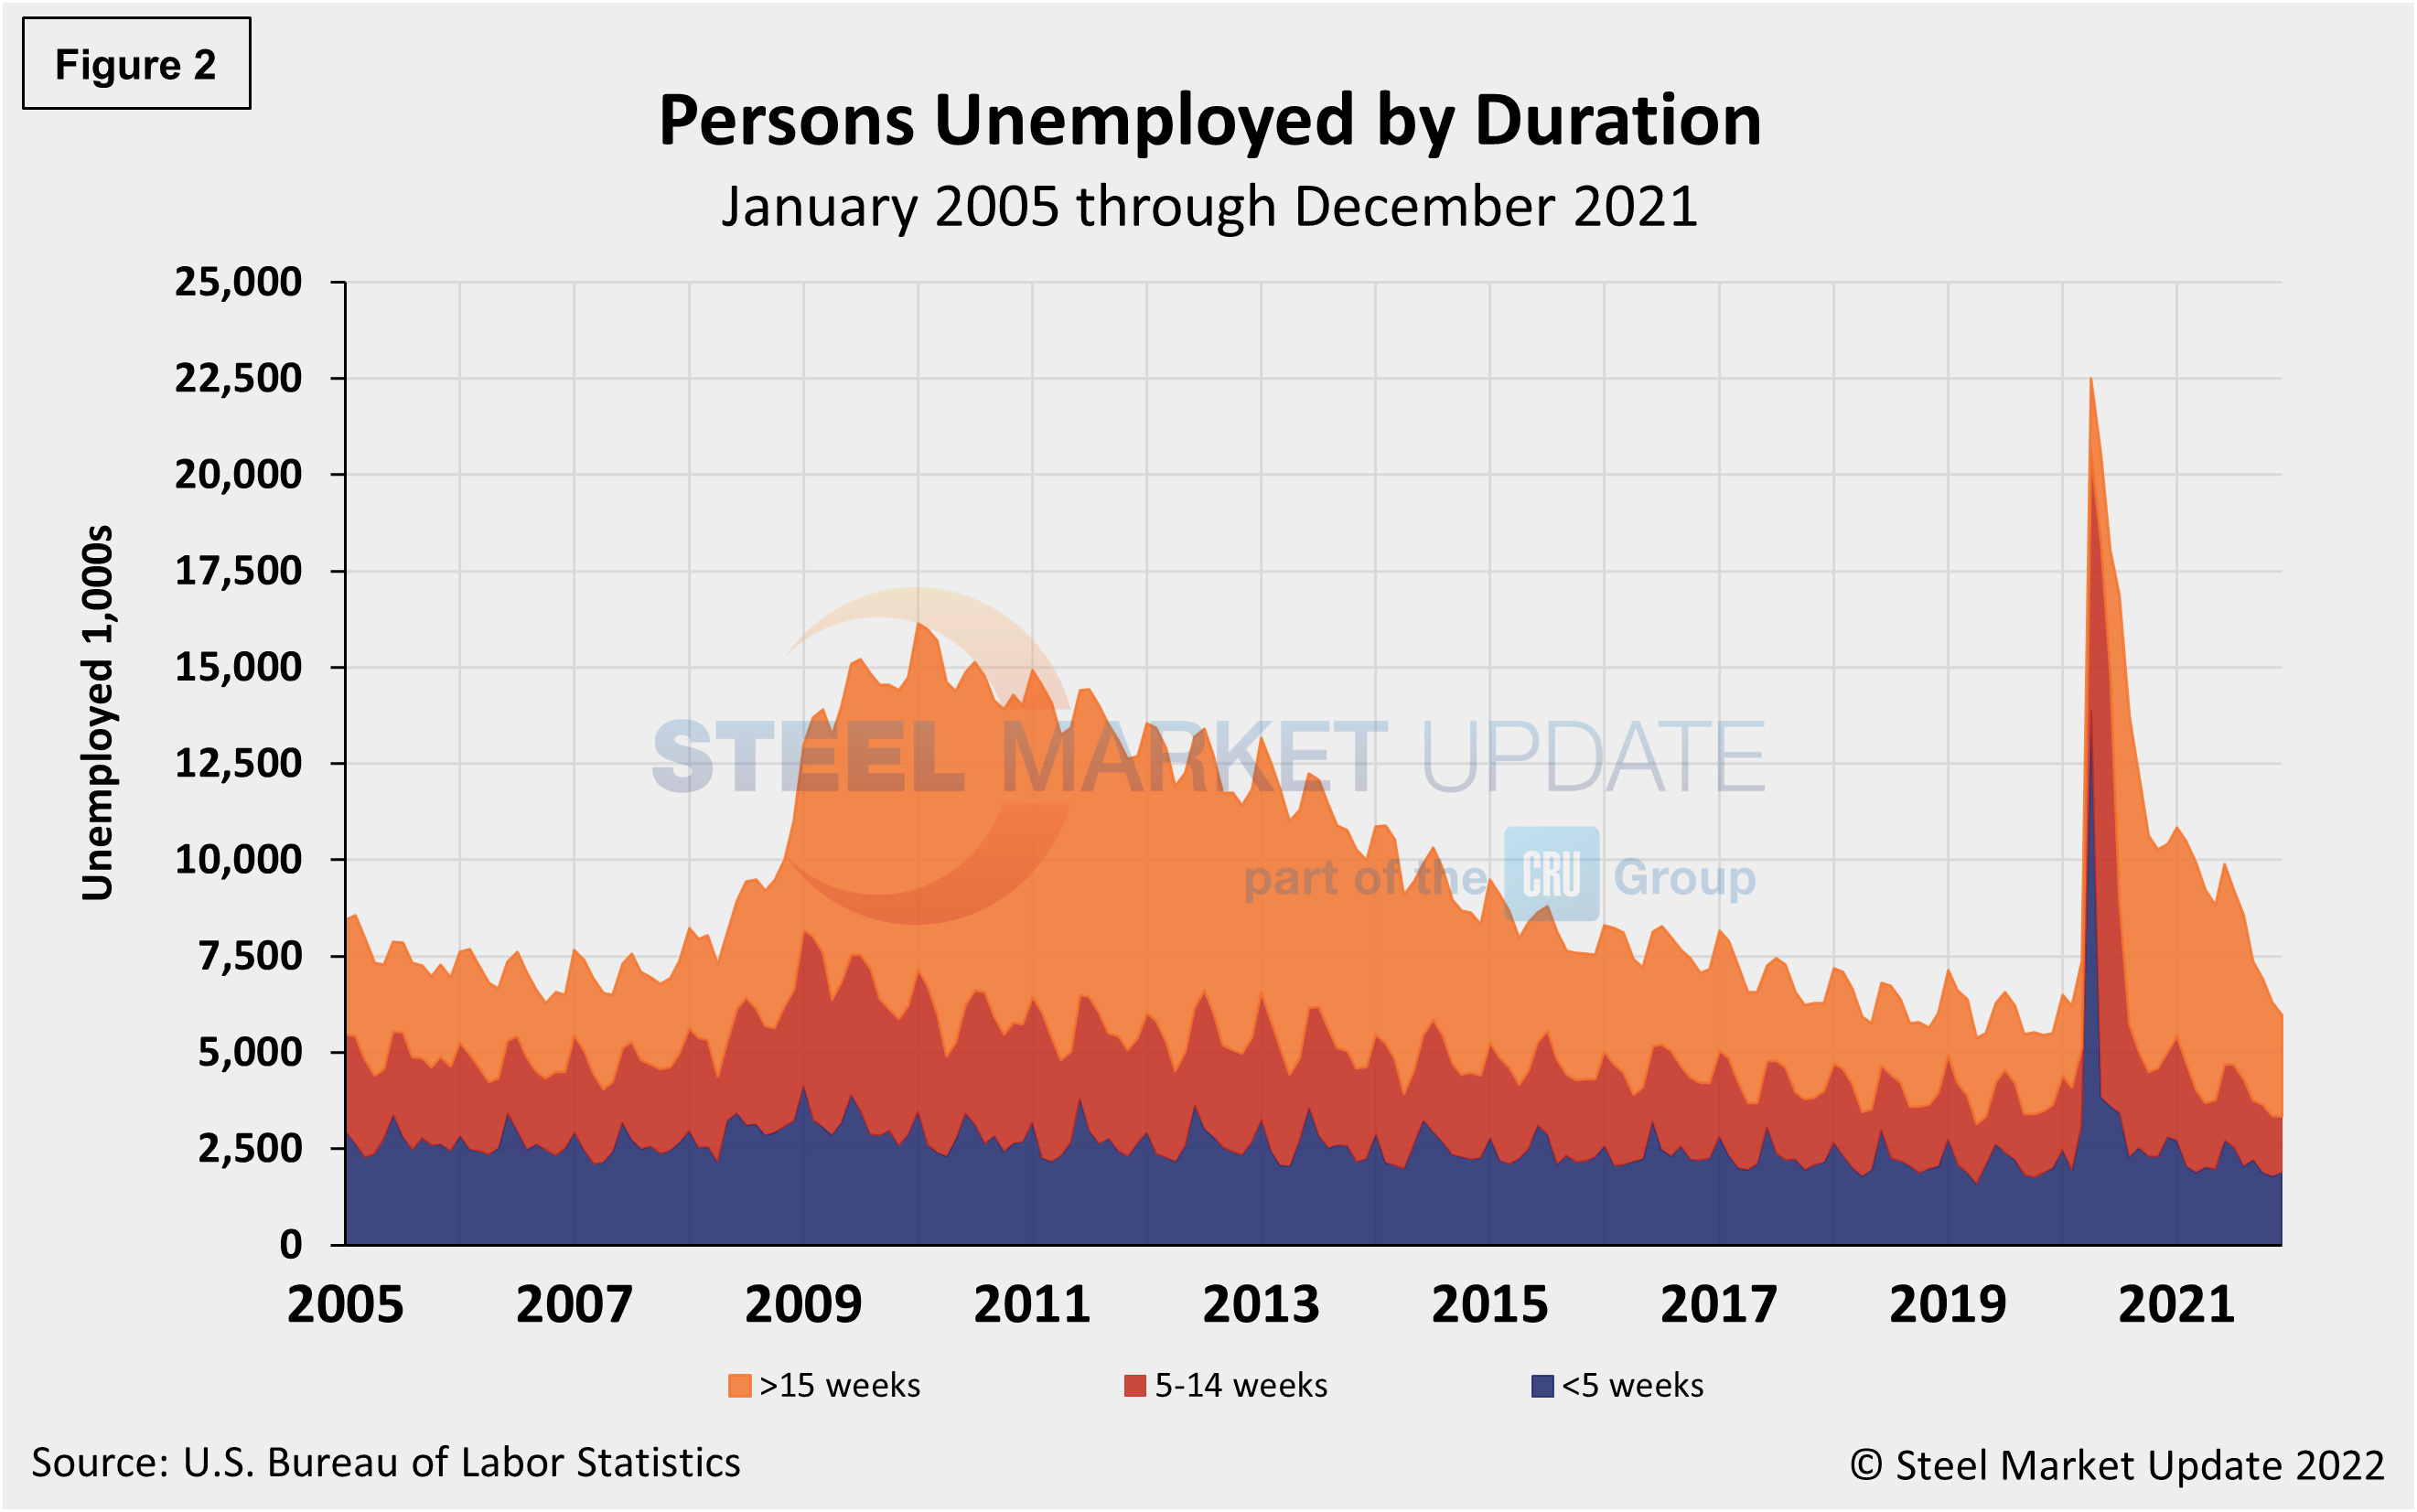
The historical picture for the duration of unemployment since January 2000 is broken down into <5 weeks, 5 to 14 weeks, and >15 weeks in Figure 2. The total number unemployed was 5.964 million at the end of December, a decrease of 338,000 compared to November. Although unemployment remains above pre-pandemic levels by roughly 254,000 people, about 16.5 million more people now have jobs compared to the 22.5 million thrown out of work during the worst of the pandemic in April of 2020. As of Jan. 8, 44.0% had been unemployed for more than 15 weeks, 24.4% for 5 to 14 weeks, and 31.6% for less than 5 weeks.
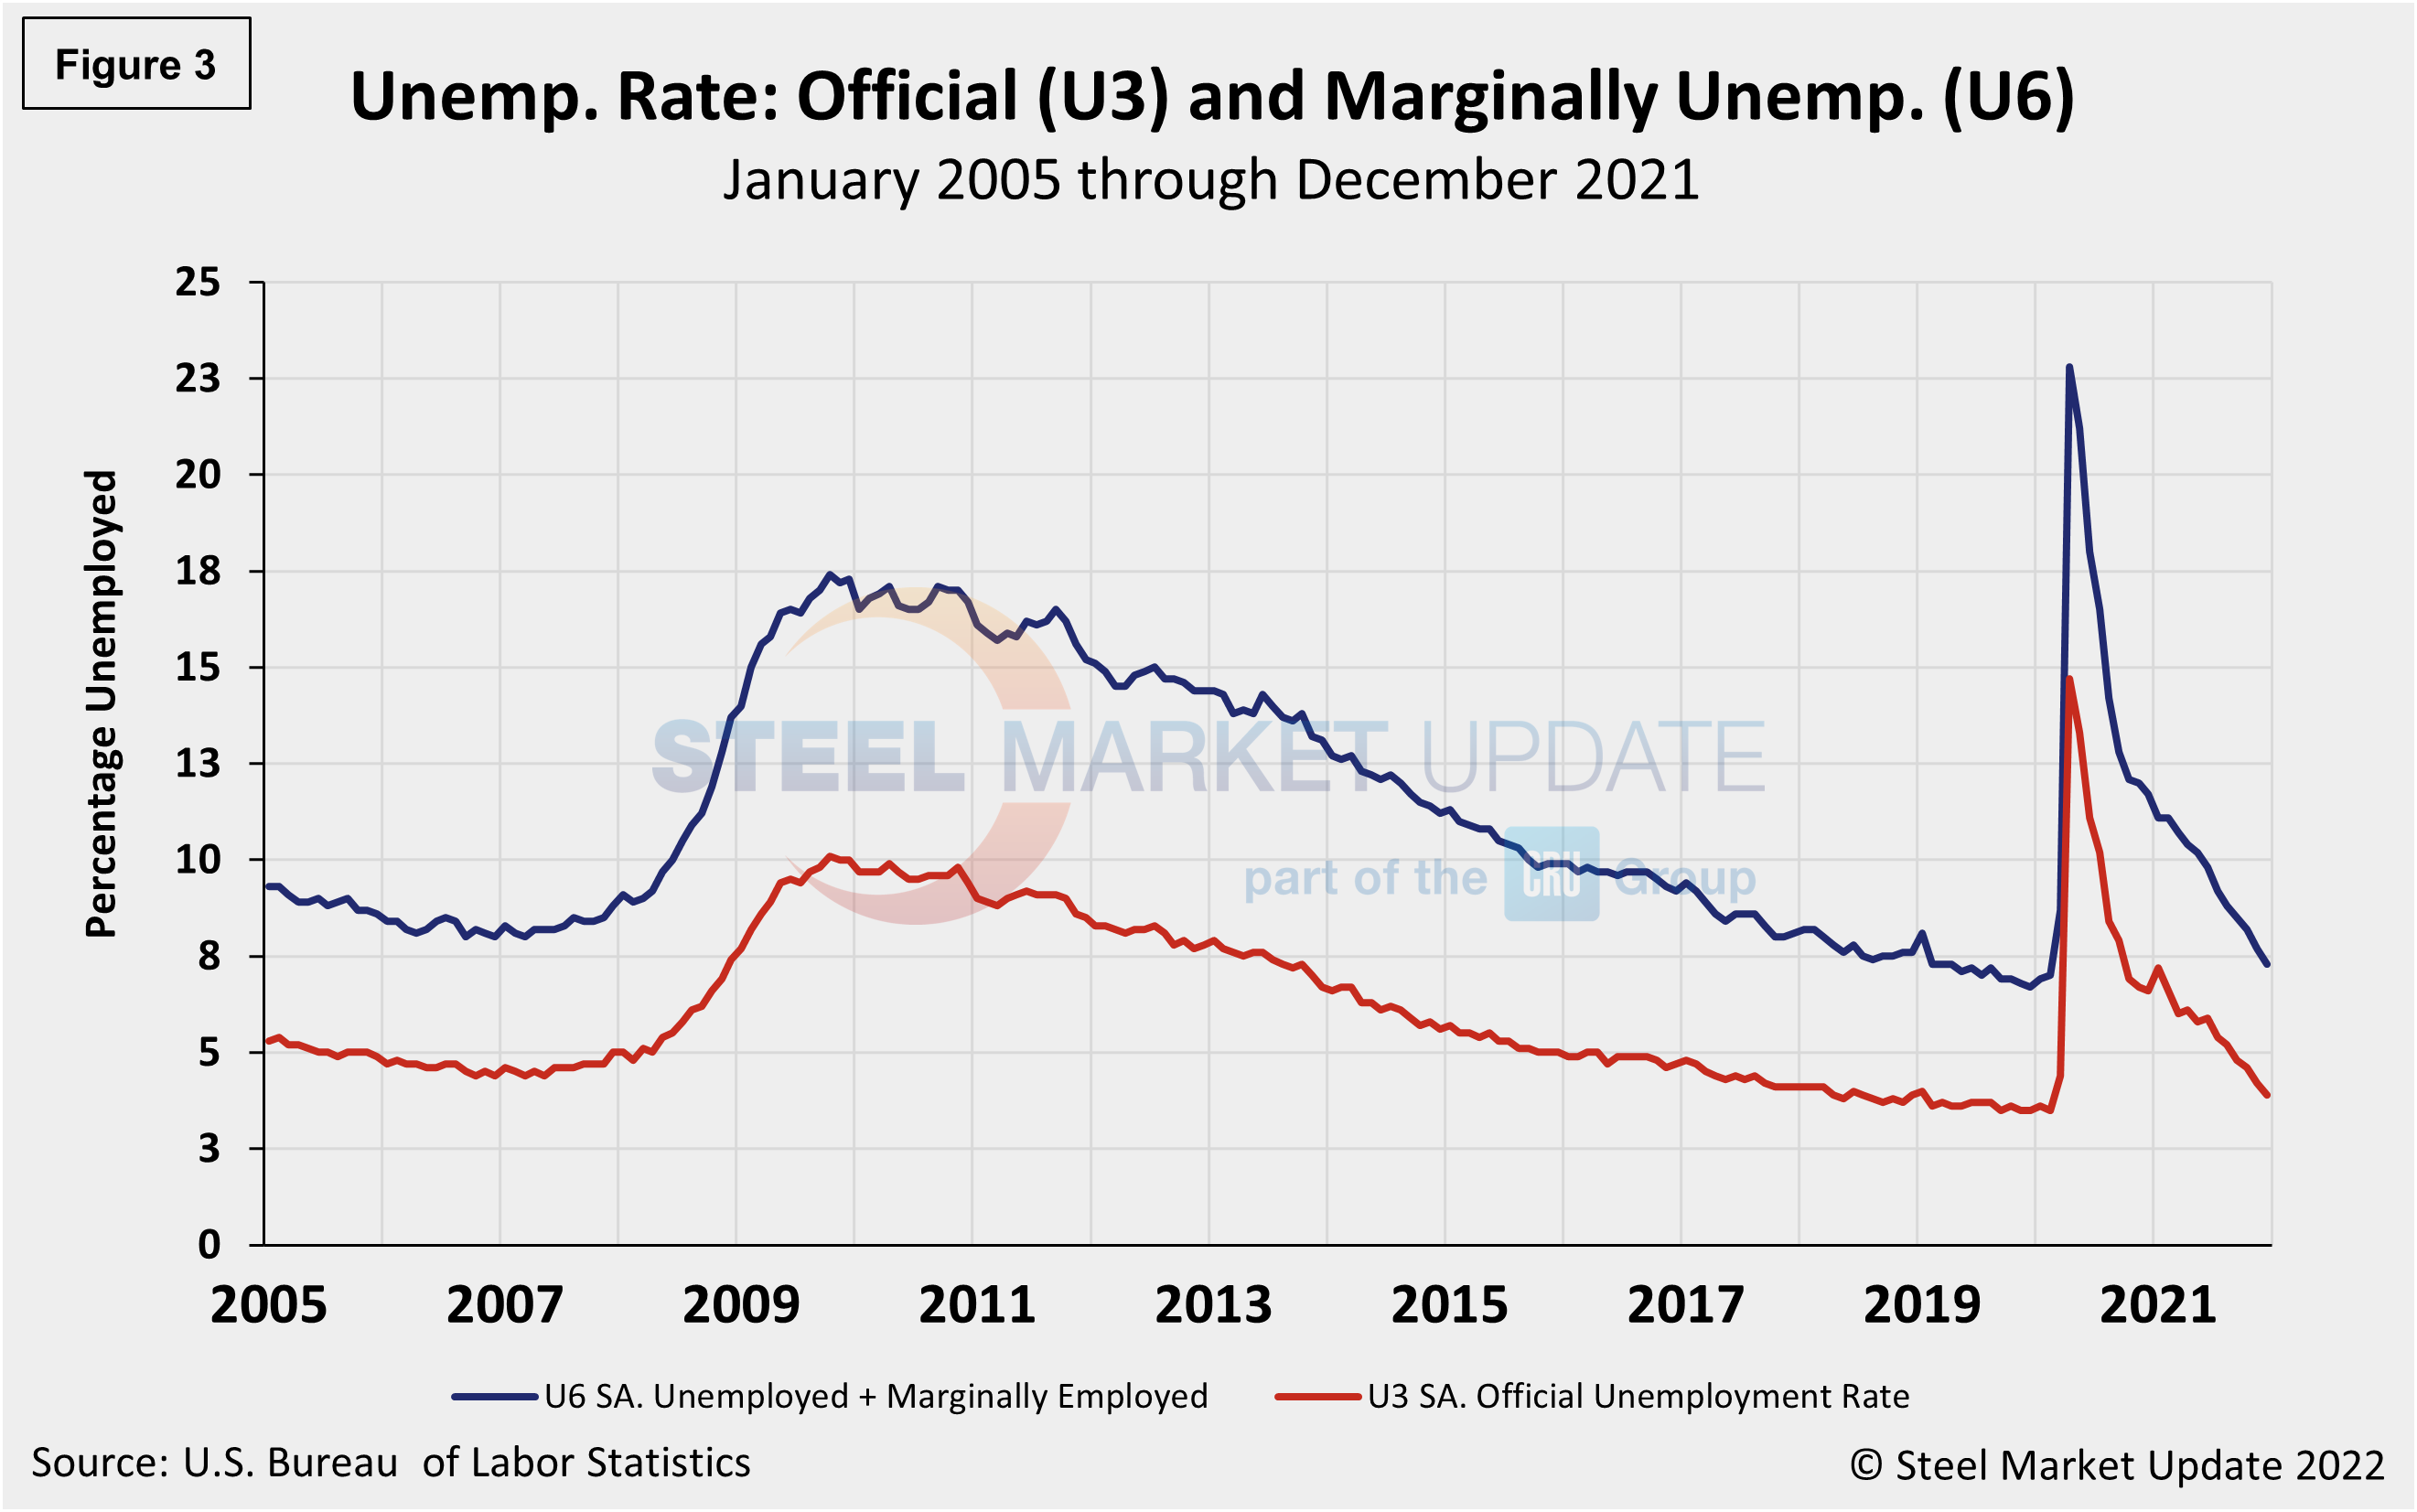
The official unemployment rate, U3, reported in the BLS Household survey (see explanation below) increased from 3.5% in February 2020 to 14.7% in April 2020. Since then, it has trended down at a slow pace. December’s fall to 3.9% was the lowest mark in 22 months. U6, a more encompassing measure of unemployment that includes discouraged workers and those holding part-time jobs for economic reasons, dropped even more to 7.3% from 7.7% (Figure 3).
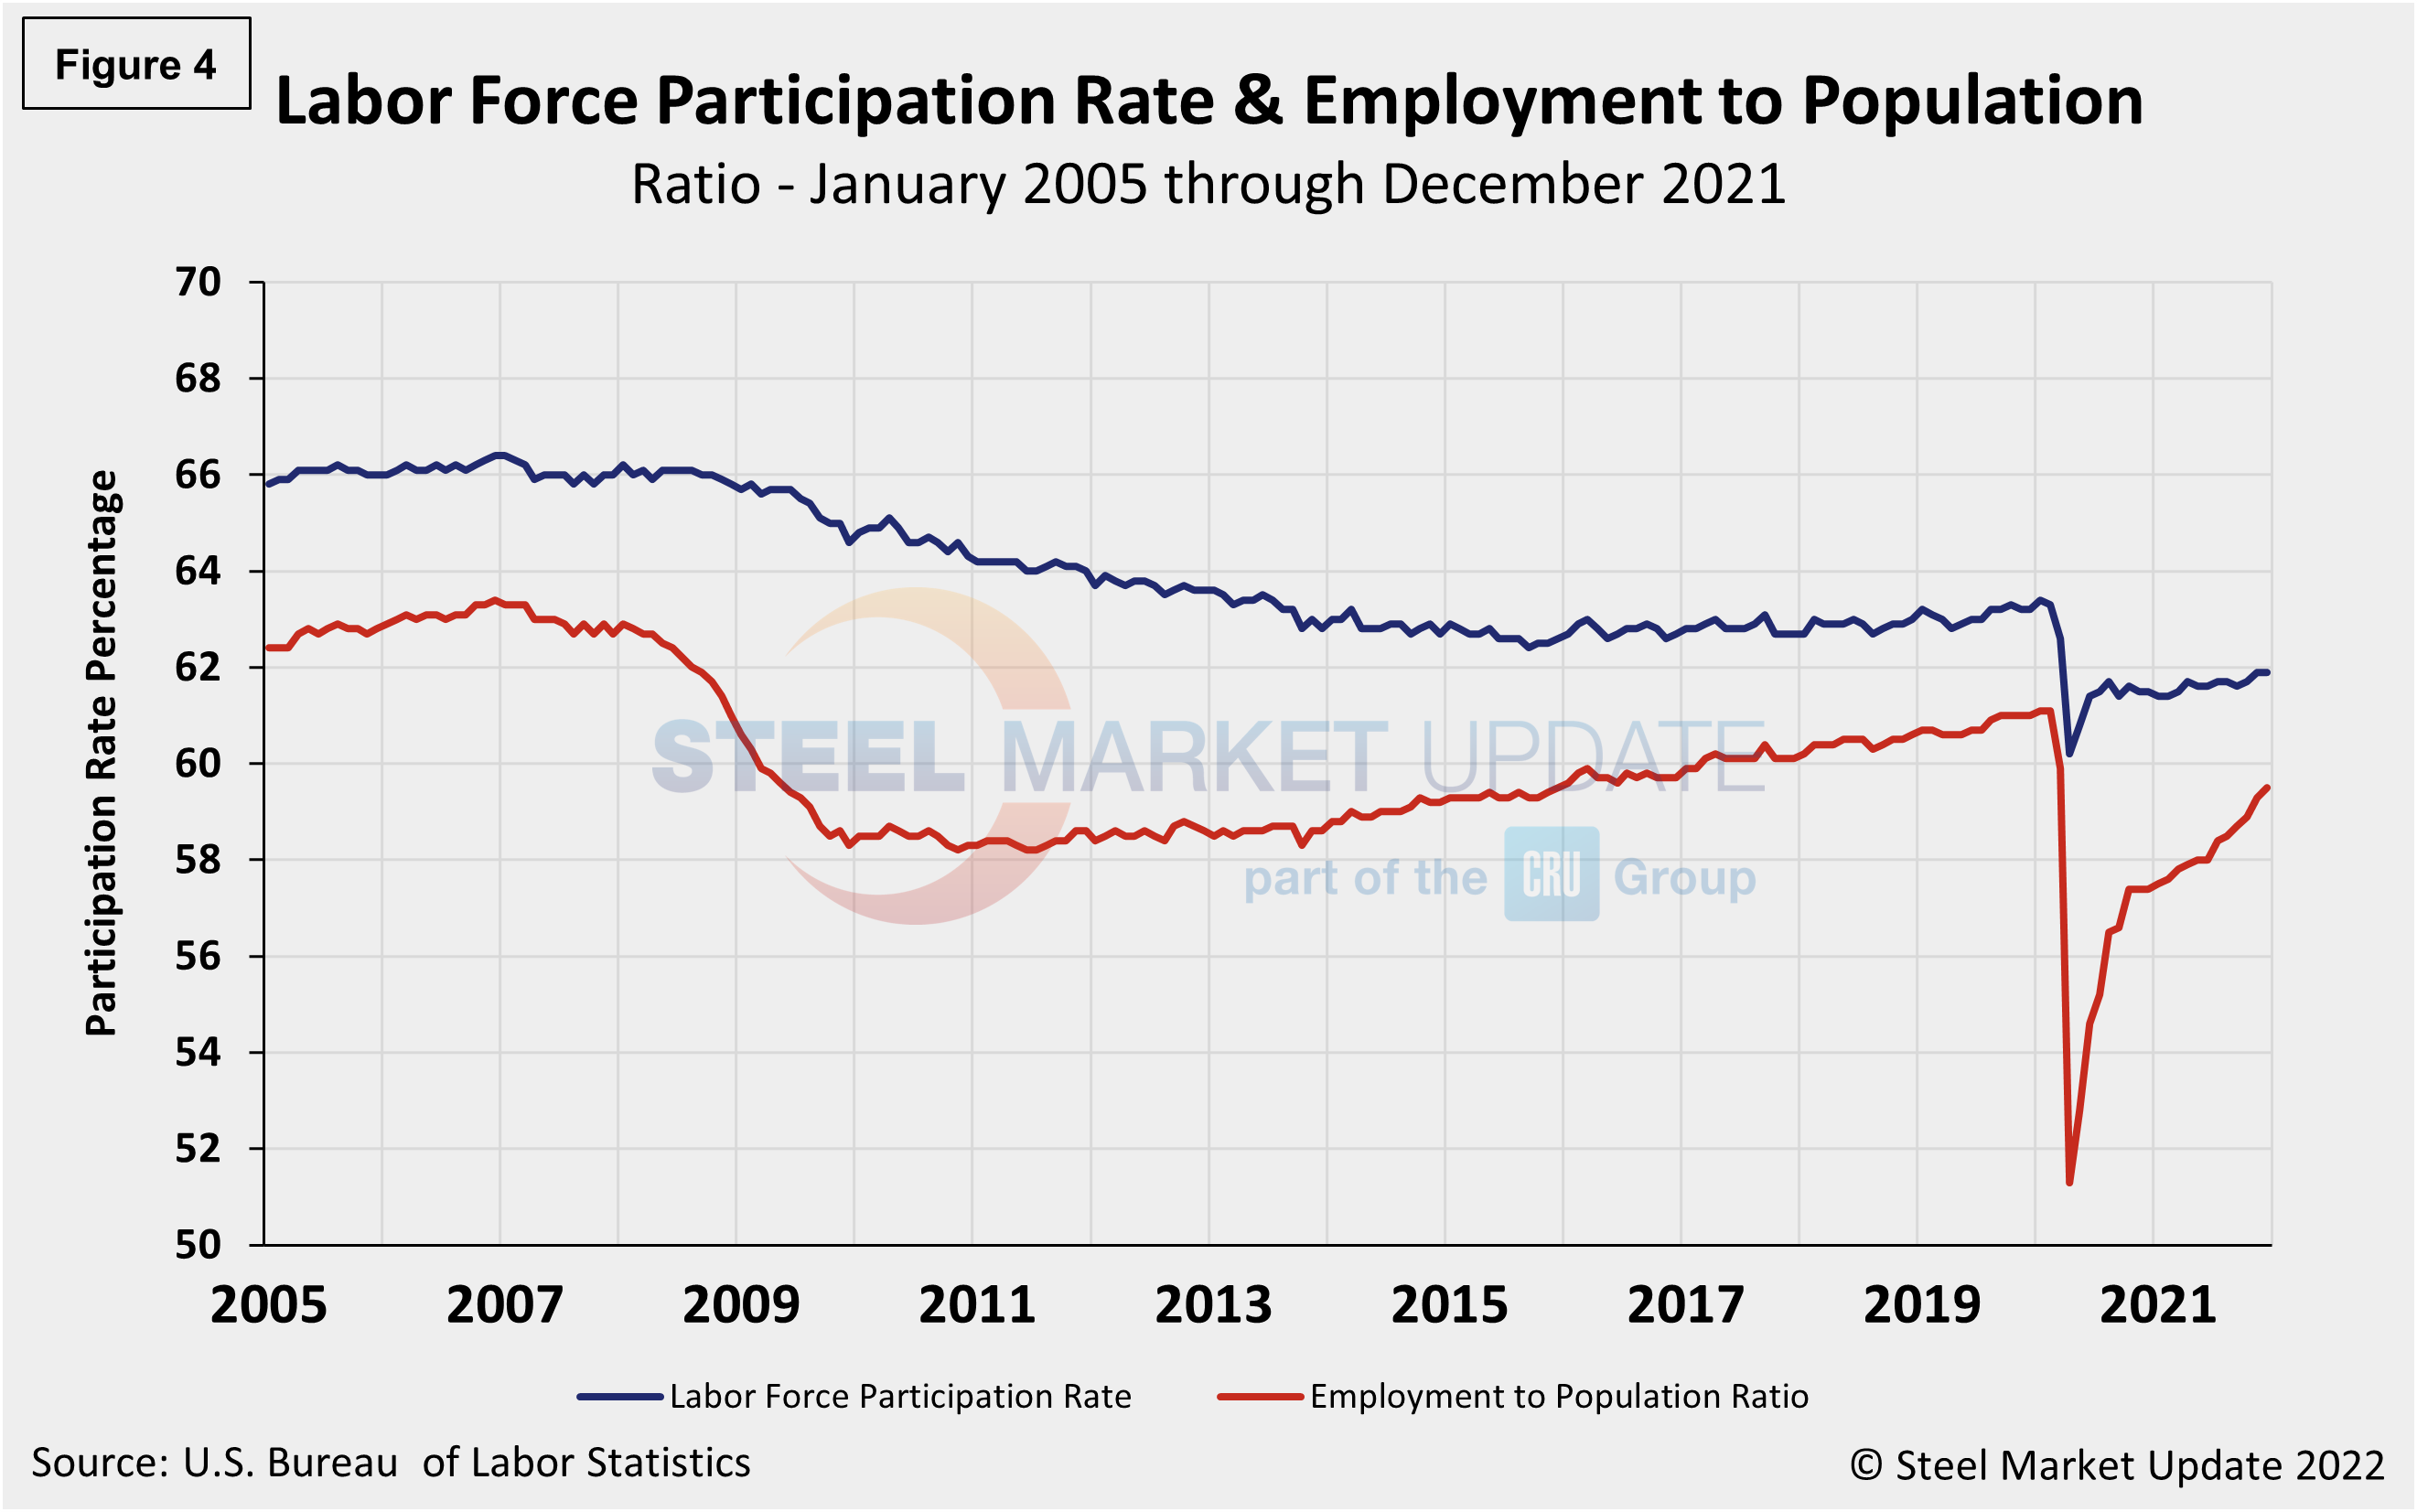
Another gauge, and more definitive view, are the number employed as a percentage of the population. Last month, the employment-to-population ratio was 59.5%, a marginal increase from November when the ratio was 59.3%, highlighting the challenges many companies continue to report in filling openings. Figure 4 shows both measures on one graph.
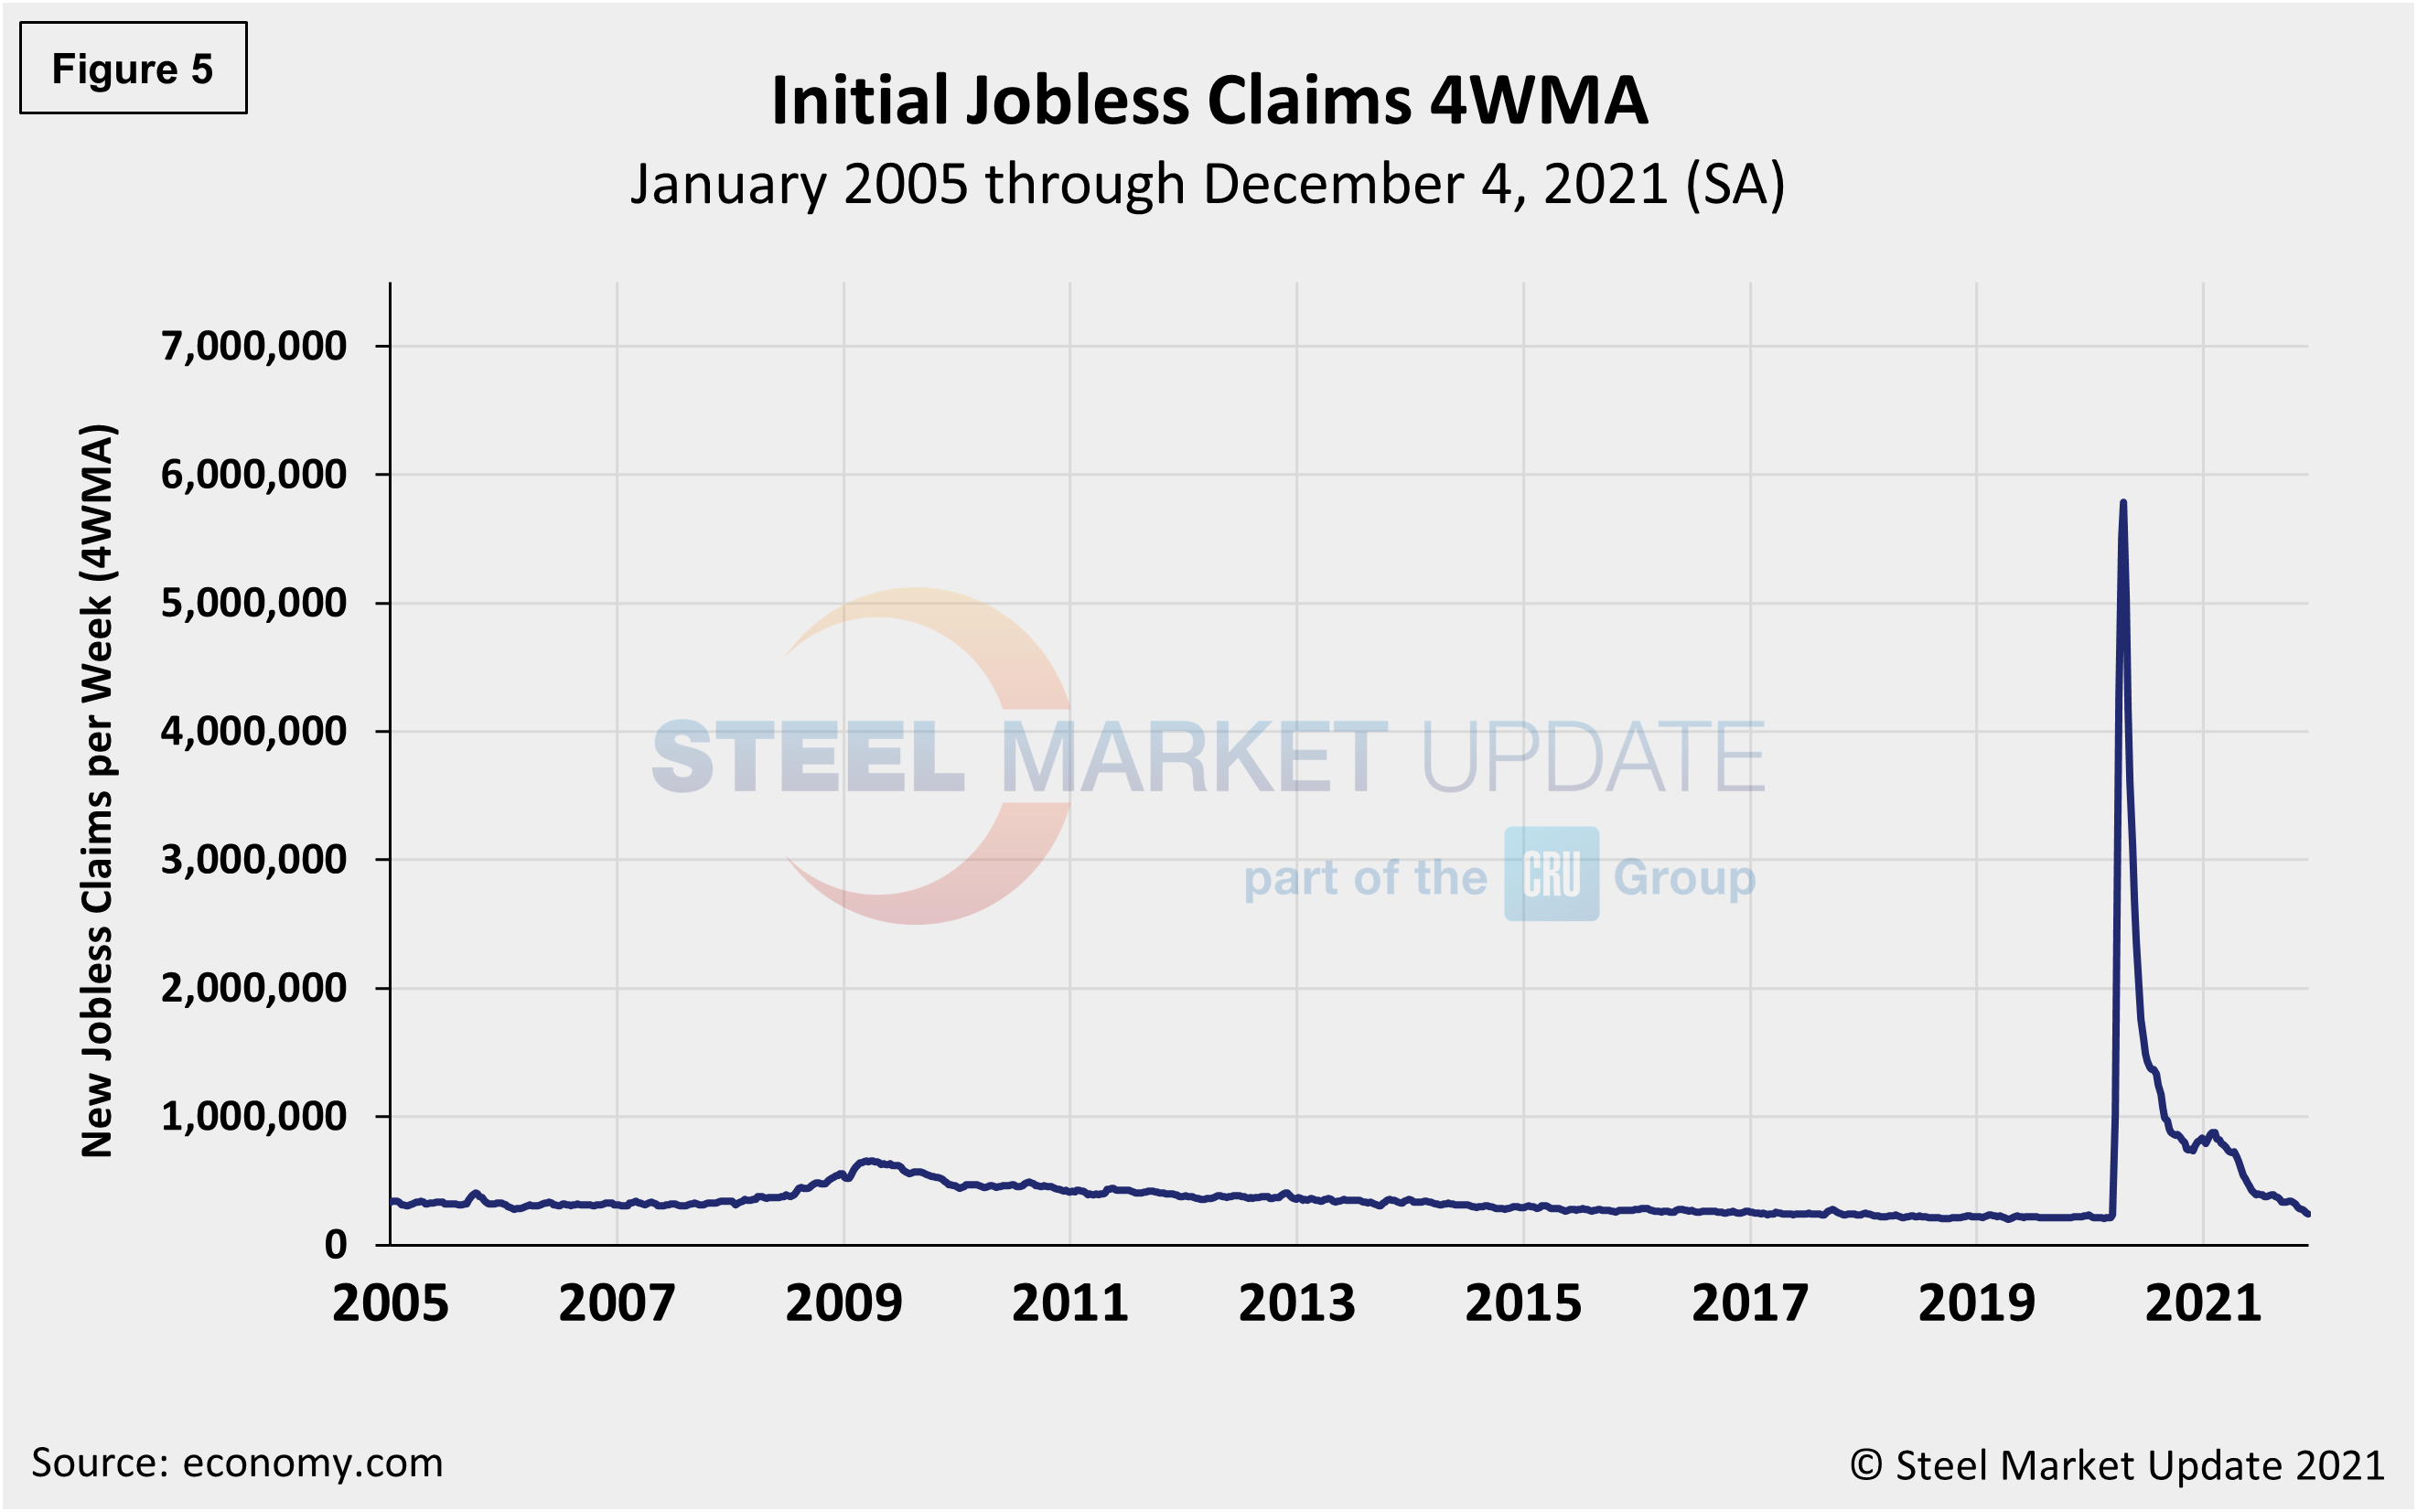
Initial claims for unemployment insurance, which are reported weekly by the Department of Labor, increased by 9,000 to 207,000 in the week ended Jan. 8. Unemployment claims had declined by 8,000 over the prior two weeks, but saw a reversal this past week.
“U.S. initial claims for unemployment insurance benefits unexpectedly edged higher in the week ended Jan. 1, 2022,” reported Economy.com. “New filings increased from a revised 200,000 to 207,000. The Labor Department estimates that unadjusted for seasonal variation, new filings normally increase by 50,000 in the week ended Jan. 1, 2022, likely attributed to holiday layoffs. This year, initial claims were up 57,000 in the week ended Jan. 1. Continuing claims for unemployment insurance benefits were up 36,000 to 1.754 million in the week ended Dec. 25, while the insured unemployment rate remained at 1.3%.”
The recent change in initial claims continues to point to a recovering labor market. Figure 5 shows the four-week moving average of new claims since January 2005, seasonally adjusted.
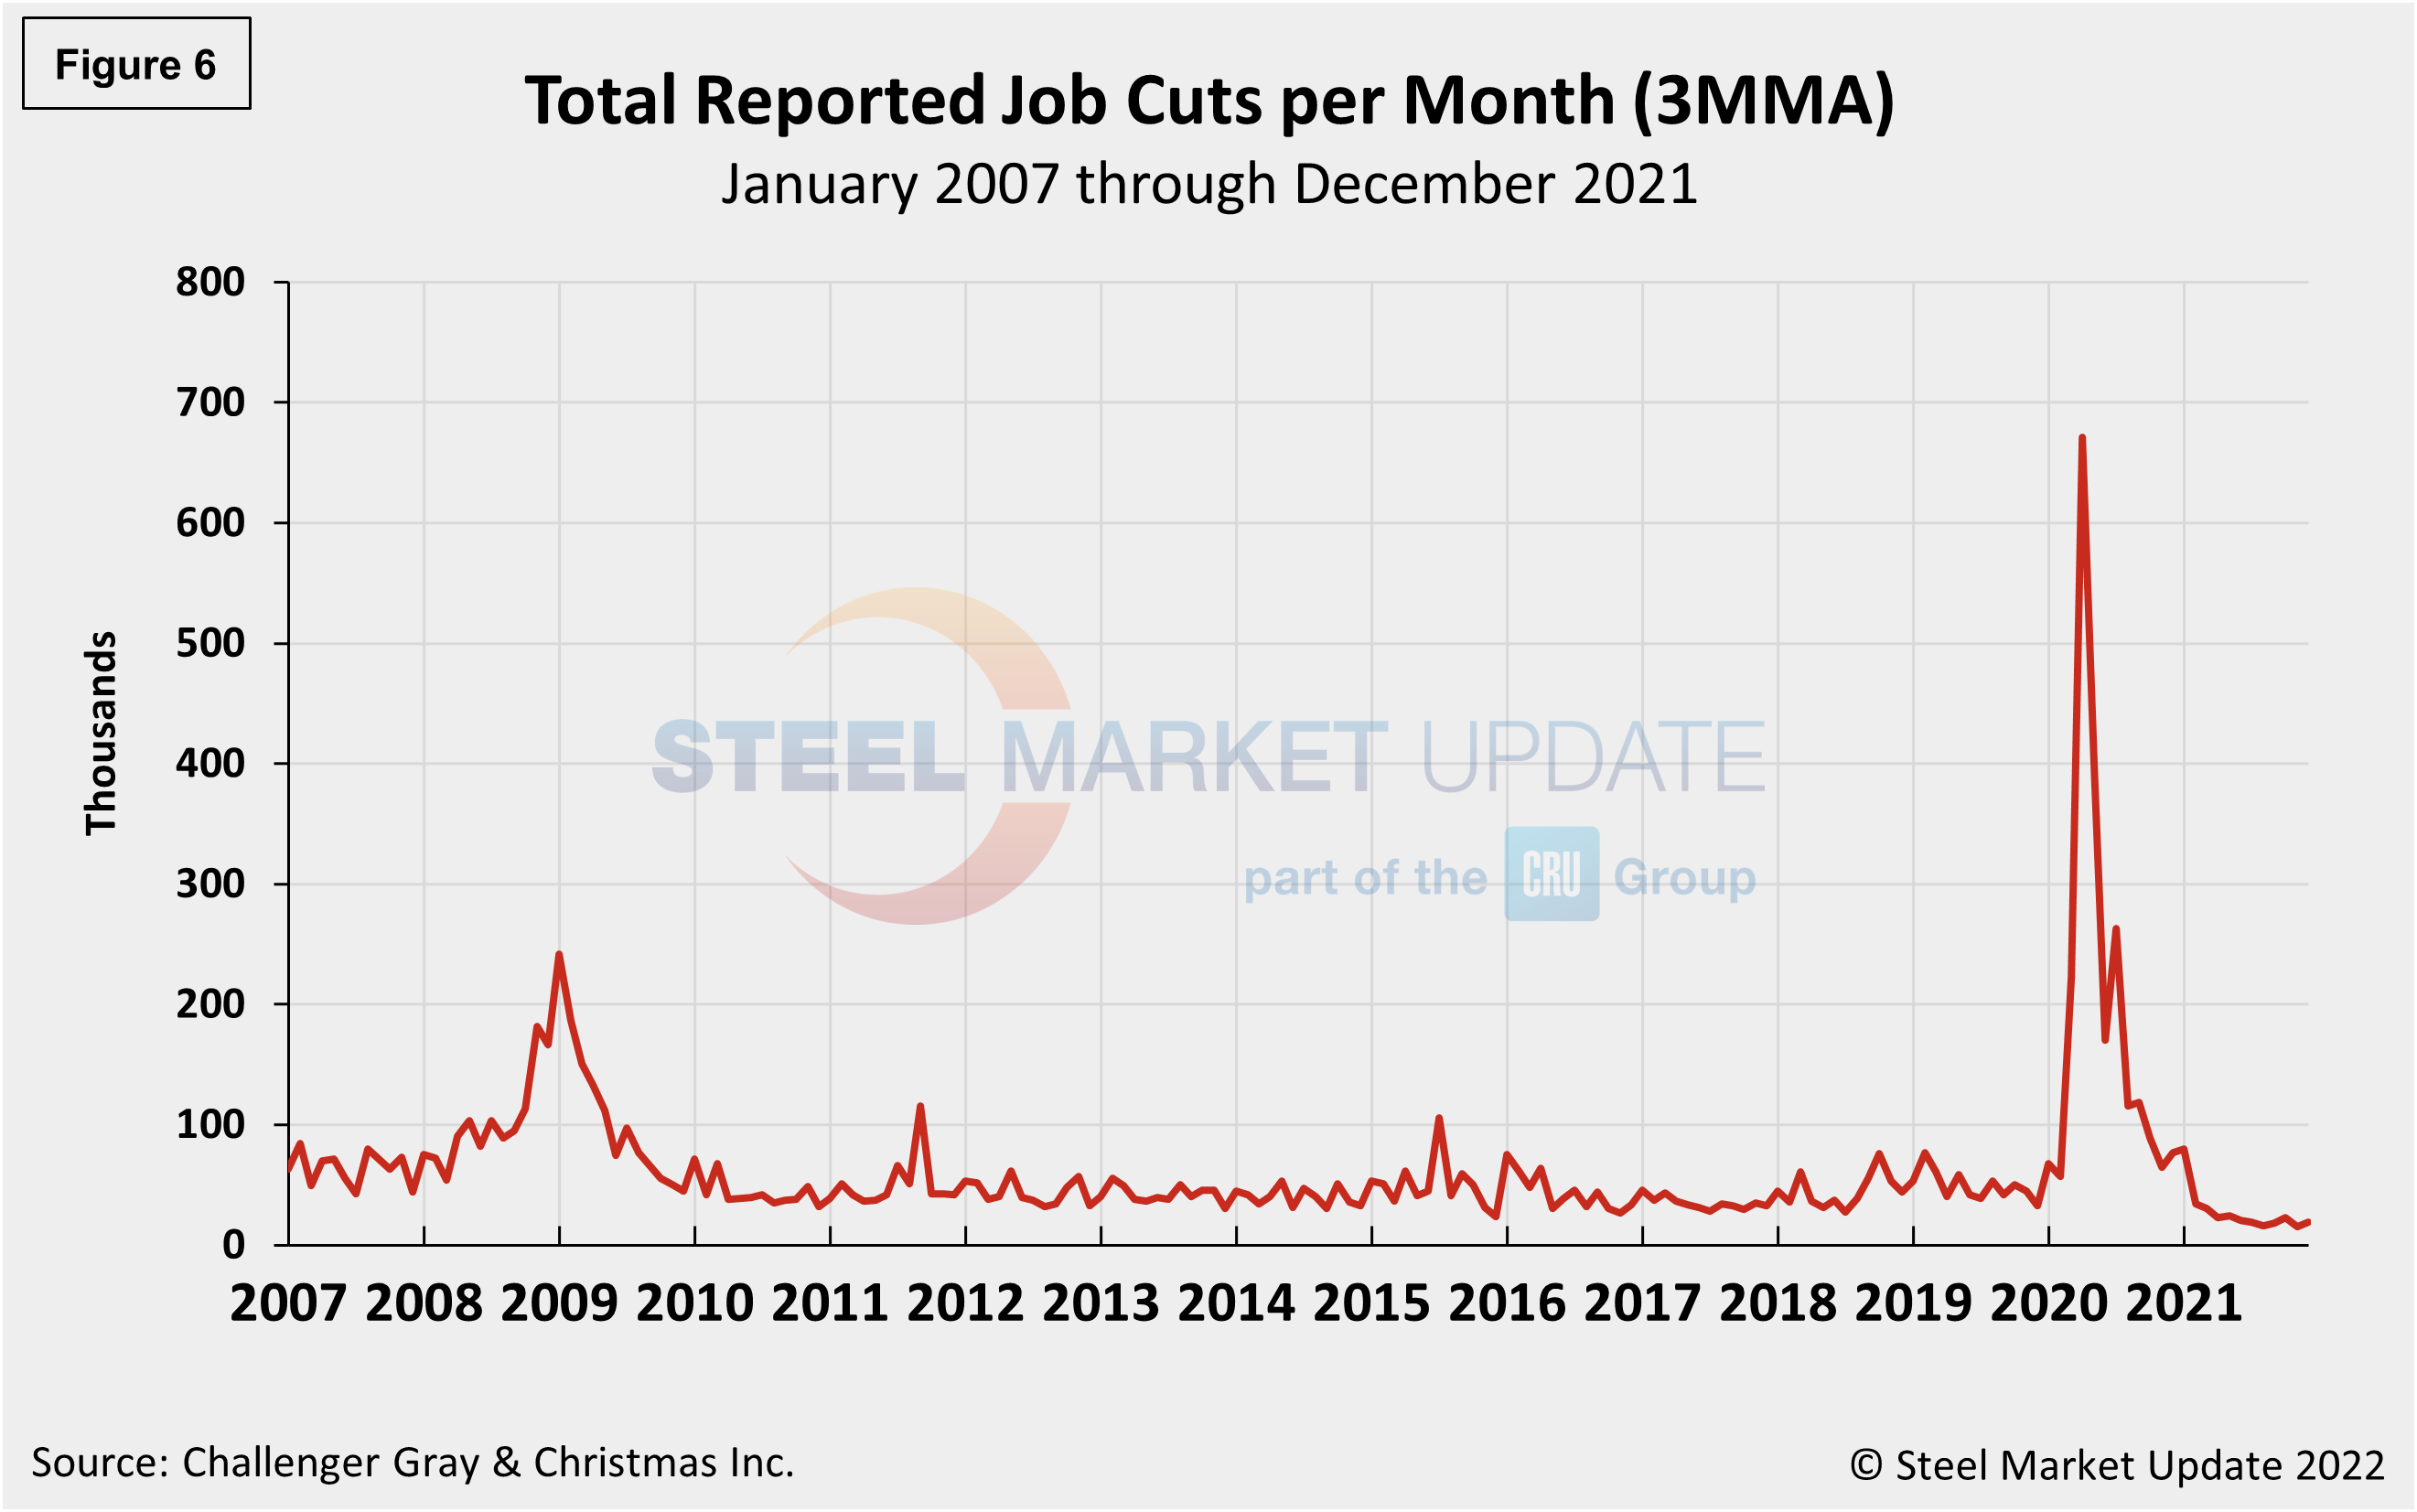
Human resources consulting firm Challenger, Gray and Christmas, Inc., produces a monthly employment update for the U.S. It reported that job cuts in December were 19,052, a 28.1% increase from the 14,875 cuts reported the prior month. December’s total is 75.3% lower than the same year-ago period when 77,030 cuts were announced. Figure 6 shows the monthly job cuts reported by Challenger on a 3MMA basis since January 2007.
According to Challenger, COVID continues to influence numbers, as resignations hit a new record in November with 4.5 million.
“Workers are leaving jobs in droves, particularly in-person jobs in Entertainment/Leisure, Health Care, and Transportation, according to the Department of Labor,” said Challenger. “This trend is likely to continue as we contend with the largest surge in COVID cases we’ve yet seen, spurred by Omicron.”
“The sheer number of COVID cases will impact the labor market, regardless of how severe illnesses are,” Challenger added. “Working parents are dealing with massive interruptions in schooling, requiring them to revert to managing virtual classes or take over child care themselves. Meanwhile, those with COVID safety concerns will continue to shun in-person roles.”
In the final quarter of 2021, U.S. companies announced 56,749 job cuts, up 7.4% from the 52,560 announced in the third quarter, and down 74.5% from the 222,249 cuts announced in the same quarter of 2020.
In 2021, employers announced plans to cut 321,970 jobs from their payrolls, down 86% from the 2,304,755 jobs eliminated in 2020. It is the lowest annual total on record since Challenger began tracking in 1993.
“The main difference between now and prior COVID waves is that much of the financial support from the government – expanded unemployment benefits, pandemic pay, sick leave, child credits, student loan payment suspension, eviction moratoriums – is gone, which may push workers, who were leaving the workforce for child care, COVID concerns, or burnout, back into the labor market before they would have with that assistance intact,” concluded Challenger.
Explanation: On the first Friday of each month, the Bureau of Labor Statistics releases the employment data for the previous month. Data is available at www.bls.gov. The BLS reports on the results of two surveys. The Establishment survey reports the actual number employed by industry. The Household survey reports on the unemployment rate, participation rate, earnings, average workweek, the breakout into full-time and part-time workers and lots more details describing the age breakdown of the unemployed, reasons for and duration of unemployment.
By David Schollaert, David@SteelMarketUpdate.com


